Study of Road Condition & Traffic in accordance
with Road Safety-Case Study of NH-44
Zakir Hussain Thoker1, Brahamjeet Singh2, Pooja Sharma3
1
M.Tech. Student, 2Assistant Professor, 3HOD Department of Civil Engineering, DeshBhagat University, Punjab (India)
Abstract: The main focus of this research was to improve the road condition and analyse the different stretches for safety
parameters as we know Road Crashes take away the right to life of 3,0000 people everyday. This is a global humanitarian disaster, and it is man-made (Global Road Safety Partnership Annual Report). In this study the site selected was checked for the accidental occurrence and the causes of accidents were also studied. The selected site was divided into four stretches and accidental data of all four stretches was observed. The accidents of each stretch was classified as Fatal Accident, Major Injury and Minor Injury. The Average daily traffic per day and conversion of same to PCU per day, per hour from year 2013 to 2017 was also studied. The PCU Per hour for year 2013 was decreased from 1027.338075 to 895.8942667 in year 2014 due to devastating floods that occurred in Kashmir in year 2014 and consequently the accidental rate was decreased from 143 accidents in year 2013 to 89 accidents in year 2014. The Accidental rate and frequency of accidents on all four stretches was also studied. The objective of study was to find out the Black Spots on all four stretches and problems of Black spots were analysed and due Safety Enhancement procedures were also provided. The accidental investigations of various accidents that have occurred on particular stretches were also studied and their causes and remedies to make those spots least accident prone were also incorporated in study.
Keywords: Sight Distance, Road Safety, Qazigund, Black Spot, Wanpoh, Bijbehara, Awantipora, PCU, ADT
I. INTRODUCTION
Road safety is one of the most important problems in our society. Every year 1.2 million of people are killed and between 20 and 50 million people are injured in road accidents. If current trends continue road traffic accidents are predicted to be third leading contributor to the global burden of Disease and injury by 2020.
India had earned the dubious distinction of having more number of fatalities due to road accidents in the world. Road safety is emerging as a major social concern around the world especially in India ( Shivkumar and Krishnaraj).
Accidents are a drain on the national economy and may lead to disablement, death, damage to health and property, social suffering and general degradation of environment.
To minimize the no of crashes by any kind and severity expected to occur on the entity during a specific period is known as road safety. Accidents and the fatalities on road are the result of inter-play of a number of factors. Road users in India are heterogeneous in nature, ranging from pedestrians, animal- driven carts, bi-cycles, rickshaws, hand carts and tractor trolleys, to various categories of two/three wheelers, motor cars, buses, trucks, and multi-axle commercial vehicles etc., The vehicle population has been steadily increasing because of change in the style of living of people. Increase in vehicle population with limited road space used by a large variety of vehicles has heightened the need and urgency for a well thought-out policy on the issue of road safety. In India the rate of accident is directly proportional to growth of vehicle population.
Road traffic safety refers to methods and measures for reducing the risk of a person using the road network being killed or seriously injured. The users of a road include pedestrians, cyclists, motorists, their passengers, and passengers on-road public transport, mainly buses and trams. Best practice of road safety strategies focus upon the prevention of serious injury and death crashes in spite of human fallibility. Safe road design is now about providing a road environment which ensures vehicle speeds will be within the human tolerances for serious injury and death wherever conflict points exist
II. LITERATUREREVIEW
The relevant literature on this study include driver characteristics, vehicular characteristics and environmental characteristics which were reviewed and presented here.
Rio et al. (1991) studied the blood samples reports of 5745 spanish drivers killed in road accident. He found psychoactive drugs among 50.1% of those driver killed in road accidents. Mainly alcohol(43.8%), illicit drugs(8.81%) and medicinal drug(4.7%).for one every three cases(32%) a bac ( breath analyser coefficient)over 0.8g/l was recorded, cocaine(5.2%),opiates(3.2%) and cannabis(2.2%) were three illicit drugs most frequently detected. Among medicinal drugs were benzodiazepines (3.4%), antidepressant drugs (0.6%) and analgesics (0.4%)
Zegeer et al. (1991) studied the relationship between lane or shoulder widening and accident reduction rate. He concluded that 21% reduction in accident can be achieved by widening the lane 4 feet per side.\
Sreedharan et al. (2010) explored the determinants use of crash helmets among motorcyclist in india. A cross sectional study conducted in kerala .the study found only 73.1% of motorcyclist were not using helmet which results more head injuries during crash in that region.
Oduro (2012) surveyed a number of accidents and found that 83% break failure result in accident. Brake ineffectiveness is due to vehicle overloading, uneven tyre pressure, incorrect brake adjustment, air in breaking system, automatic brake adjuster not working, brake fluid on lining .brake failure is due to broken pipe, low brake fluid level, cracked brake drum, brakes overheating.
Lee et al. (2012) developed a real- time crash prediction model by taking total travel time and crash potential reduction. The study result indicated the variable speed limit could reduce crash potential by 5-17%.omchainuek et al. (2013) investigated road side safety on thai nh. The result showed that speeding vehicles were involved in roadside crashes accounted for about 70% of the total crashes and 30% of road side crashes were due to road side trees.
mohmed et al. (2013) studied on crash related to visibility obstruction due to fog and smoke in florida. It was found that fog smoke related crashes are more likely to occur at night without street lighting leading to more severe injuries. Head-on and rear-end are common crashes in terms of crash risk and severity. These crashes are more prevalent on high speed road, undivided roads, roads with no sidewalks and two lane rural roads.
Houquani et al. (2014). Investigated hospitalized drivers who were involved in road traffic collision in uae.a logistic model was fitted using the variables like drivers demographic data, time, date, location, mechanism of collision, speed at collision and sleepiness. The conclusion was sleep is an important factor to road traffic collision. Further they advised to discontinue driving on highways feeling sleepy especially during lunar month of ramazan. Driver fatigue is a main problem in long journey due to restlessness.
III.OBJECTIVESOFTHESTUDY
Expansion in the road network, surge in motorization and a rising population of a country contribute towards increasing numbers of road accidents, road numbers of registered motor vehicles in the country and the country’s population have increased at a compound annual growth rate (CAGR) of 3.4 per cent from 2002 to 2017. During the same period, the number of road accidents in the country increased at a CAGR of 2.1 per cent. Similarly, the number of road accident fatalities and the number of persons injured in road accidents in the country between 2002 and 2017 increased by 5.8 per cent. Very little work has been done in India to analyse accidents on two-lane roads.
In the present study, “ Study Of Road Condition And Traffic In Accordance With Road Safety- Case Study Of NH-44” an attempt is made to study the road condition, safety and analyse the accidental prone black spots of the particular stretch from Qazigund Kashmir to Srinagar Kashmir, to provide solutions to these black spots to lower the accidental rate.
The major objectives of the present work are listed below
A. To study the annual, monthly, daily and hourly variation in accident rate on selected Stretch of urban two-lane road
B. To study the effect of traffic volume, density and capacity on accident rate on urban Two-lane road
C. To study the maintenance of road surface and shoulder on rate of accident.
D. Study Black Spots of selected stretch on NH-44
E. Study accidental cases with causes and remediations
F.
IV.DATACOLLECTION
The only information available for accident studies is the FIR (First Information Report) lodged in the police stations. The data from these records of last 14 years (2002-2017) were extracted from the FIR record filed under IPCno.279/337/338/304(A). Vehicles those involved in accidents and reported in the F.I.R. The categories of vehicles include tempo, auto, mini-truck, minibus, Tata indica, Tata-407, tractor, motor cycle, tanker, tailor (articulated vehicle), truck and bus.
A. Road Selected For study
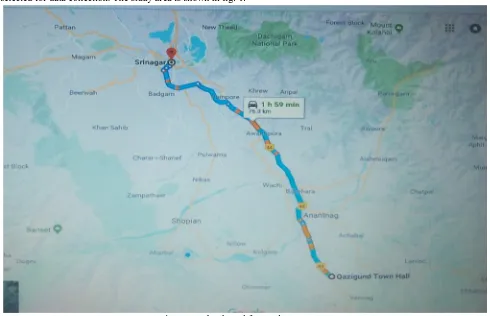
[image:3.612.62.552.181.497.2]The road from Qazigund to Pampore on NH-44 (Traditionally called NH 1A ) was chosen for this study. The following stretches were selected for data collection. The study area is shown in fig. 1.
Fig 1. Road Selected for Study on NH-44
B. Data Collected from Police Records
With the prior permission of the concerned S.P, the accident data were collected on NH-71 highway from four police stations as shown in Table 1. The police stations have their own FIR records of several years. The data from these records of last ten years were extracted from the FIRs filled under IPC NO.279/337/338/304 (A).
Police Station Road section covered under the police station
Qazigund 1 Km to 17 Km on NH-44
Wanpoh 17 Km to 28 Km on NH-44
Bijbehara 28 Km to 47 Km on NH-44
Awantipora 47 Km to 82 Km on NH-44
[image:3.612.37.576.562.702.2]C. Accidental Details
Accidental details during 2002-2017 on this road section are shown in Table 2. Accidental data were collected year wise from each police station records then sorted out month wise. Stretch wise accidental data is shown in table 3. Stretch one is depicted as S1 which is from Qazigund Kashmir to Wanpoh Kashmir. Stretch two is depicted as S2 which is from Wanpoh Kashmir to Bijbehara Kashmir. Stretch three is depicted as S3 which is from Bijbehara Kashmir to Awantipora Kashmir. Stretch four is depicted as S4 which is from Awantipora Kashmir to Srinagar Kashmir. Traffic Volume data is also given in Table 4.
Year Fatal Major injury Minor injury
2002 15 16 37
2004 11 35 50
2006 16 25 45
2008 20 32 39
2010 21 34 40
2013 18 41 84
2014 4 24 61
2015 13 32 81
2016 18 34 84
2017 11 30 58
Total 147 303 579
Table 2. Accidental details from 2002 to 2017
year
Fatal
Fat al Total
Major Injury
Major Total
t ot al
Minor Injury Minor
Total
t ot al S1 S1 S2 S2 S3 S3 S4 S4 S1 S1 S2 S2 S3 S3 S4 S4 S1 S1 S2 S2 S3 S3 S4 S4
2002 9 3 0 3 15 4 5 1 6 16 12 8 2 15 37
2004 6 3 0 2 11 10 10 1 14 35 10 26 2 12 50
2006 3 1 1 11 16 5 7 0 13 25 11 24 0 10 45
2008 2005 6 9 5 4 2 1 7 6 20 20 9 7 8 17 5 2 10 6 32 32 11 10 10 20 5 2 13 7 39 39 2010 2006 6 10 5 3 2 1 8 7 21 21 9 11 8 11 6 2 11 10 34 34 11 14 10 12 6 1 13 13 40 40 2013 2007 5 6 4 4 3 1 6 7 18 18 11 23 11 3 6 2 13 13 41 41 24 33 21 15 11 7 28 29 84 84 2014 2008 1 1 1 2 0 0 2 1 4 4 7 9 6 10 3 1 8 4 24 24 17 14 15 23 9 2 20 22 61 61 2015 2009 4 6 3 2 1 3 5 2 13 13 9 18 8 7 5 3 10 4 32 32 23 22 21 18 10 5 27 36 81 81 2016 2010 6 8 4 3 1 0 7 7 18 18 9
25 8
6 9 11 0 34 34 24 36 21 18 11 2 28 28 84 84 2017 2013 3 2 2 3 2 1 4 5 11 11 11 10 10 6 6 1 13 13 40 30 16 16 15 16 8 3 19 23 58 58 Total
T ot al 60 28 8 54
147
147 122 90 22 69
303
303 181 26 192
579 579
YEAR ADT AV PCU PER DAY PCU/HR
2013 14533 24656.11 1027.338075
2014 12584 21501.46 895.8942667
2015 12679 21655.23 902.301225
2016 10484 18102.4 754.2667667
[image:5.612.41.578.76.186.2]2017 12700 21689.22 903.7175
Table 4 Traffic Volume Data from PWD
V. ANALYSISOFDATA
[image:5.612.45.579.479.567.2]Accidental rate of all four stretches was studied and frequency of accidents on each stretch was also calculated. From the Table 5 and 6 it is observed that frequency and rate of accident is more for stretch-4 followed by stretch-1,2,3 respectively. Fig. 4.1 shows the annual variation in accidents of total stretches during year 2002-2017. It is observed that percentage accidents are increasing relatively in most of the year. In the year 2013 accident rate was high and low in the year 2002.It may be due to increase in no of vehicles, bad traffic environment, and increase in population. Accident rate was increased from 2014 to 2016 from 89 accidents in 2014 to 136 accidents in 2016.Kashmir Division came under devastating floods in year 2014 and roads got blocked for almost 3 months which subsequently lead to decrease in traffic flow and accident rate thereby got decreased. Due to introduction of Bye Pass (NH 44) on existing NH 1A bottle necks of Khanabal crossing in Anantnag District , Bijbehara T- Intersection and Padgampora T intersection in Pulwama District of Kashmir division got nullified for National Highway Traffic right from Qazigund to Srinagar. These bottle necks were the major problems for the smooth flow of traffic on National Highway 1A which were corrected and good results were achieved in terms of reduction in accident rates from 136 accidents in 2016 to only 99 accidents in 2017.
Table 3 shows annual variation in accidents of the four stretches. It is observed that no of accidents are more for stretch-4 and 1 than stretch -2 and 3. This is because of high traffic volume on stretch 4. Traffic volume decreases on stretch-3 as stretch-2 is connected to Major District Road of Kulgam via Wanpoh & Shopian District via Bijbehara. Stretch-1 has high population density as this is the main town of the Qazigund on NH -44. Accident rate is more due to more no of commercial and non-commercial vehicles on the road, as this is the only National Link connecting Kashmir Division with Rest of India at base point of Kashmir Division when travelling from Jammu to Kashmir.
Fig 2 shows the monthly variation in accidents. Peak accident occurs in summer season i.e. in the month of march, April and may. This is due to distraction related to environment. Problem in these months are glare, fatigue, inconvenient heat.
Name of stretch Length No of accidents in a year
Sum of 10 year Accident rate
Qazigund to Wanpoh (I) 5km 208 41.6
Wanpoh to Bijbehara (II) 5km 186 36.6
Bijbehara to Awantipora (III) (III) 5km 84 25.2
Awantipora to Srinagar (IV) 5km 239 47.8
Table 5 Accident Rate of all 4 stretches
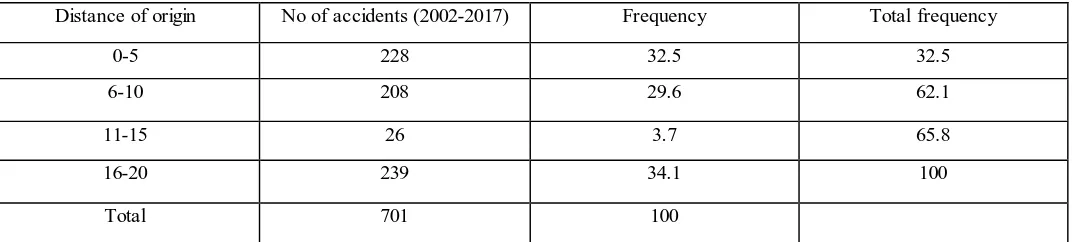
Distance of origin No of accidents (2002-2017) Frequency Total frequency
0-5 228 32.5 32.5
6-10 208 29.6 62.1
11-15 26 3.7 65.8
16-20 239 34.1 100
Total 701 100
[image:5.612.41.577.592.713.2]Fig 3 shows hourly variation in accidents. One can observe more accidents occurs in between 8PM to 9PM. In this hour line truck (Truck Series) start their long journey. Most of the driver do not use speedometer as they drive by approximation. Speed crosses limiting speed as a result accidents occur. Also they drink and drive in the evening hour. In the late night they use marijuana as a result reaction time increases and loss of control occurs. Some drivers make the vehicle over load. In India load capacity is 10 ton or 16.2 ton for goods carriage but they carry more than that results uncontrol and leads to accidents.
Vehicle users related to fatalities during 2002-2017 are shown in pie chart in percent. The results indicate that 59 percent of fatalities are due to truck drivers followed by 26 percent by unknown driver, 7 percent by motor cycles, 5 percent by car and jeep,
[image:6.612.51.565.195.400.2] [image:6.612.37.578.488.711.2]3 percent by bus respectively as shown in fig.4. They consume alcohol and drugs in long driving. As a result reaction time increases and loss of control occurs which leads to fatalities.
Fig 2. Hourly variation of Accidents Fig 3. Vehicles involved in accidents.
VI. BLACKSPOTANALYSIS
The point where accident occurs frequently is known as black spot or accident point. Analysis is required for improving traffic environment. Black spots of all Stretches which have been studied are as under Table 7, Table 8, Table 9, Table 10
Table 7. Black Spot Analysis Of Stretch 1
Accident P oint No.s Problems Safety Enhancement
Wanpoh Harnag Railway Crossing 10
Vegetable and mechanic shops on Shoulder, unsignalised T junction
Clearance of Road Side, Speed Restriction,Providingsignals, signs
Sursuna 14
Railway road crossing at same level, Trees and P oles on Shoulder
Clearance of Road Side, Overpass for road NH -44
Padshahi Bagh 8
Bus stop at corner , Old Trees on the Shoulder and at centre of T -junction
Bus stop shed to be removed, Trees on Shoulder & c e n t r e should be removed.
Sether 15
Median without Sign on the Road, Dumping site on the Shoulder, Trees on the Shoulder
Medians to be Painted, obstacle on the Road Should Be Removed.
Halmullah 10 Unsignalised crossing , Unpainted Median, Trees on Shoulder Median to be Painted, Junction Improvement
Table 8. Black Spot Analysis of Stretch
Accident Point No Problems Safety Enhancement
Lethpora 10 Steep Gradient Speed restriction, Junction Improvement
Barsoo Crossing 15 Trees on Shoulder, Edge drop Road maintenance, Shoulder maintenances
Padgampora Crossing
6 Bad Shoulder Shoulder maintenance
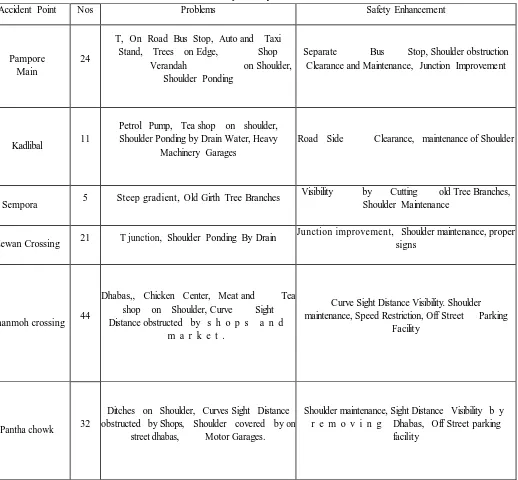
Table 9. Black Spot Analysis of Stretch 3
Accident Point Nos Problems Safety Enhancement
Pampore Main
24
T, On Road Bus Stop, Auto and Taxi
Stand, Trees on Edge, Shop
Verandah on Shoulder,
Shoulder Ponding
Separate Bus Stop, Shoulder obstruction Clearance and Maintenance, Junction Improvement
Kadlibal 11
Petrol Pump, Tea shop on shoulder, Shoulder Ponding by Drain Water, Heavy
Machinery Garages
Road Side Clearance, maintenance of Shoulder
Sempora 5 Steep gradient, Old Girth Tree Branches
Visibility by Cutting old Tree Branches, Shoulder Maintenance
Zewan Crossing 21 T junction, Shoulder Ponding By Drain
Junction improvement, Shoulder maintenance, proper signs
Khanmoh crossing 44
Dhabas,, Chicken Center, Meat and Tea shop on Shoulder, Curve Sight Distance obstructed by s h o p s a n d
m a r k e t .
Curve Sight Distance Visibility. Shoulder maintenance, Speed Restriction, Off Street Parking
Facility
Pantha chowk 32
Ditches on Shoulder, Curves Sight Distance obstructed by Shops, Shoulder covered by on
street dhabas, Motor Garages.
Shoulder maintenance, Sight Distance Visibility b y r e m o v i n g Dhabas, Off Street parking
[image:7.612.56.574.233.713.2]facility
VII. CONCLUSIONSANDRECOMMENDATIONS
From the given study, the following conclusions have been drawn
(1) The available literatures on accident analysis indicate that 77.5 percent of road accidents in India are caused due to driver’s error. (2) Heavy vehicles like truck are involved in maximum no of accident on two-lane roads. It is estimated that fatalities caused by truck is 59 % followed by other (26%) and bike (7%) and jeep (5%) and bus (3%).Road safety awareness should be raised among road user.
(3) Stretch IV has the highest no of accidents which accounts for 47.8% of total accidents. The accident rate can be decreased by road side clearance, proper maintenance of shoulders, lighting, and junction improvement. Speed limit should be brought down by providing humps near accident spots. Sight distance near curves should be obstruction free.
(4) Stretch I have the second highest no of accidents accounts for 41.6% of total accident. The accident rate can be reduced by providing signalized junction, junction improvement, and shoulder Clearance, installation of humps, shifting of poles, removal of trees near the edge of pavement etc.
(5) No of accidents in stretch II accounts for 36.6% of total accidents. The accident rate can be minimized by clearing-off shoulders, reducing speed limit, junction improvement, providing Signals on the median, shifting structures on the shoulder.
(6) Stretch III has minimum no of accidents accounts for 25.2% of total accidents. Speed limit reduction near junction should be reduced to prevent accidents.
IX. ACKNOWLEDGEMENT
This research was supported by DeshBhagat University, Punjab, India. I sincerely thank my guide and advisor Er. Bharamjeet Singh Assistant Professor in Civil Engineering for his guidance, suggestions, and continuous support throughout my Project. I greatly appreciate all the support that he has been given to me, both on this thesis and during the entire period in which I have been working for him.
My profound thanks to Er Pooja, Professor and Head of the Department of the Civil Engineering, DeshBhagat University for her valuable suggestions and help throughout this dissertation work. For the assistance and help she provided as being my co-advisor here at DBU, and also during my thesis work. Finally, my special thanks to all my professors & friends, who rendered valuable help for completion of my Master’s Degree in Technology.
REFERENCES [1]. Global Road Safety Partnership Annual Report (2013)
[2]. Torregrosa et al.,(2012) New geometric design consistency model based on operating speed Profiles for road safety evaluation, Accident Analysis and Prevention Article in press AAP-2915 pp.1-10
[3]. Sivakumar, .Krishnaraj(2012),Road Traffic Accidents (RTAs) Due To Drunken Driving In India, Challenges In Prevention international journal of research in management and Technology,ISSN:2249 9563 VOL. 2, pp.401-406
[4]. Accidental deaths in India (2013), National Crime Records Bureau, Ministry of Home Affairs, Government of India, New Delhi [5]. http://en.wikipedia.org/wiki/Haddon_Matrix
[6]. Bhuyan(2003) Accident Analysis on Two-Lane Road, M-Tech Thesis Indian Institute of Technology Roorkee.
[7]. Hassan and Aty (2012) Exploring the safety implications of young drivers attitudes and perceptions, Accident Analysis and Prevention Vol.43 pp.45-65 [8]. Constantinou et al(2013) Risky and aggressive driving in young adults: Personality Matters, Accident Analysis and Prevention Vol.43 pp.1323-1331 [9]. Chandraratna et al(2006) Crash involvement of drivers with multiple crashes, Accident Analysis and Prevention vol. 38 pp.532–541
[10]. Sagberg and Bjørnskau (2006) Hazard perception and driving experience among novice drivers, Accident Analysis and Prevention vol.38 pp. 407–414 [11]. Derry(2013) The Role of Driving Experience in Hazard and Categorization, Accident Analysis And Prevention Vol.43 pp.1730-1737
[12]. Sivakumar, .Krishnaraj(2012),Road Traffic Accidents (RTAs) Due To Drunken Driving In India, Challenges In Prevention international journal of research in management and Technology, ISSN:2249-9563 Vol. 2, pp.401-406
[13]. Vaez, Lafllame(2005).,Impaired driving and motor vehicle crashes among Swedish youth: An investigation into drivers’ socio demo graphic characteristics Accident Analysis and Prevention Vol.37, pp.605–611
[14]. Anne et al.,(2010), The effects of minimum legal drinking age 21 laws on alcohol-relate driving in the United States Journal of Safety Research Vol.41,pp.173–181
[15]. Peter and Robert (2009) Alcohol consumption measured at road side survey and variation in traffic injury crashes, Accident Analysis and Prevention Vol. 30,No. 4, pp. 409–416.
[16]. Campus et al.,(2013) The effect of the new traffic law on drinking and driving in Sao Paulo, Brazil Accident Analysis and Prevention Vol.50 pp.622-627 [17]. Longo et al(1999)The prevalence of alcohol, cannabinoids, benzodiazepines and stimulants amongst injured drivers and their role in driver culpability,
Accident Analysis and Prevention Vol.32 pp.623– 632
[19]. Holmgren et al.,(2003) Alcohol and drugs in drivers fatally injured in traffic accidents in Sweden during the years 2000-2002 Forensic Science International Vol.151 pp.11-17
[20]. Labat et al.,(2003) Prevalence of psychoactive substances in truck drivers in the Nord-Pas-de-Calais region (France), Forensic Science International Vol.174 pp.90–94
[21]. Rio et al(2001) Alcohol, illicit drugs and medicinal drugs in fatally injured drivers in Spain between 1991and 2000Forensic Science International vol.127 pp.63–70
[22]. Keall et al(2002)The influence of alcohol, age and number of passengers on the night-time risk of driver fatal in juryin New Zealand Accident Analysis and Prevention vol. 36 pp.49–61
[23]. Aarts and Schagen (2006) Driving speed and the risk of road crashes: A review, Accident Analysis and Prevention Vol.38 pp.215-224
[24]. Lee and Mannering (2002) Impact of roadside features on the frequency and severity of run-off-roadway accidents: an empirical, analysis Accident Analysis and Prevention vol.34 pp.149 –161
[25]. Prabhakharan et al.,(2012)Impairment of a speed management strategy in young drivers under high cognitive work load Accident Analysis and Prevention Vol.47 pp.24-29
[26]. Golob and Recker (2003) Journal of Transport Engineering Vol.4 pp-129 65
[27]. Houquani et al.,(2012) Sleep related collisons in United Arab Emirates, Accident Analysis and Prevention Vol.50 pp.1052-1055 [28]. Blower et al.,(1998) Fatalities and Injuries in Truck crashes by Time of day, University of Michigan Transport Research Institute 1998
[29]. Tornros and Boiling(2005)Mobile phone use—Effects of handheld and hands free phones on driving performance Accident Analysis and PreventionVol.37 pp.902–909
[30]. Bendak(2005) Seat belt utilization in Saudi Arabia and its impact on road accident injuries. Accident analysis and prevention Vol.2 pp.367-71
[31]. Jamalludin(2012). The Effective Way to Create Awareness among Express Bus Passenger in Using Seatbelt within West Coast Malaysia American ,International Journal of Contemporary Research Vol. 2 No.9
[32]. Asa et al(1999)The prevalence of non-standard helmet use and head injuries among motorcycle riders Accident Analysis and Prevention vol.31 pp. 229– 233
[33]. Gabel(1999) Use of helmet and injury prevention Accident Analysis and Prevention Vol.21 pp. 245–246
[34]. Joseph(1979) The Effect of the Repeal of Helmet Use Laws on Motorcycle Fatalities Atlantic Economic Journal Vol.2 pp.36-39
[35]. Sreedharan(201)0 Determinants of safety helmet use among motorcyclists in Kerala, India Journal of Injury and Violence Research, Vol. 2, No 1 (2010) [36]. Osueke and Okorie(2012)The Role Of Tire In Car Crash, Its Causes, And Its Prevention Vol.2 Issue 12 Dec 2012
[37]. Oduro(2012) Brake failure of vehicle and accidents.
[38]. Osama et al(2012) Axle load distribution and Overloading at central part of north-south express malasiya Europian Journal of scientific research vol.79 pp 298-309
[39]. yin chuen chan(2008) Over loading problems in trucks master thesis.
[40]. Tamar Ben-Bassat, David Shinar(2013). Effect of shoulder width, guardrail and roadway geometry on driver perception and behavior , Accident Analysis and Prevention vol.43 pp.2142–2152
[41]. Zeeger et al(2012) Safety Effectiveness of Highway design Features Vol.2 pp.4-15
[42]. Bamzai et al(2012) Safety Impacts of Highway Shoulder Attributes in Illinois ISSN: 0197-9191
[43]. Forest et al(2009) Influence of Roadway Surface Discontinuities’ on Road Safety TRB ISSN: 0097- 8515 www.TRB.org
[44]. Somchainuek et al.,(2013) Investigation Roadside Safety on Thai National Highways Indian Journal of Science and Technology vol.6 issue 1 Jinsun and Doohee(2003)Run-off-Roadway Accident Frequency Models By Type of
[45]. Accident Severity Journal of the Eastern Asia Society for Transportation Studies, Vol.5, October, 2003 [46]. Zeeger et al.,(2012) Safety Effectiveness of Highway Design Features Vol.2 pp.4-15
[47]. Chen et al.,(2013) Safety countermeasures and crash reduction in New York City- Experience and lesson Learned Accident Analysis and Prevention Vol.50 pp.312-322 67
[48]. Mohamed et al.,(2013)A study on crashes related to visibility obstruction due to fog and smoke, Accident Analysis and Prevention Vol.43,pp.1730-1737 [49]. Hiselius(2004) Estimating there lat ion ship between accident frequency and homogeneous and In homogeneous traffic flows, Accident Analysis and
Prevention vol. 36 pp. 985–992