©IJRASET: All Rights are Reserved
2248
The Heuristic Methods for Assembly Line
Balancing Problem: A Case of Vietnam Garment
Industry
Ho Quoc Dung
College of Economics, Hue University, Viet Nam
Abstract: The problem of balancing line in garment industry is a big problem and it is difficult to find the optimal solution. Setting up the industrial sewing line by manual method, based on the experience of the line manager takes a long time while the line efficiency could not be highly achieved. This study has adopted three different heuristic methods to build a solution for the sewing line balancing and applied these methods for a typical case of Vietnam garment firm. The results show that applying heuristic methods to balancing industrial sewing line saves time, improves the line efficiency and improves productivity for the whole industrial garment firm.
Keywords: Assembly Line Balancing Problem, Heuristic Method, Ranked Positional Weight, Largest Candidate Rule, Kilbridge and Wester.
I. INTRODUCTION
Vietnam has a long tradition and history from hundreds of years ago in textile and garment sector. Nowadays, Vietnam turned to be an emerging player in the global textile and garment industry. The garment sector has seen speedy and sustainable development over more than a decade. In 2016, Vietnam has ranked after China and Bangladesh to be the third top garment exporters in the world. Presently, the garment industry played a crucial role in national socio-economic development and became the major contributor to the total export earnings of Vietnam, accounting for 16% of the country’s total exports (2017) [1]. This industrial sector also creates a huge job opportunity for the country. With the population of 90 million, 2.5 million people are now working in nearly 6,000 textile and apparel manufacturing companies.
The major market for Vietnam textile and garment products are U.S., Europe, Japan and South Korea [1]. However, under the high pressure of a huge global demand, this industry in Vietnam has been facing the challenges in finding investment and changing equipment and technology to meet the world market requirement as well as to improve its world competiveness. Productivity in the garment industry of Vietnam is still lower than ones of the other players in the same region such as China, Thailand, Philippines and Indonesia [2].
How to improve productivity and the quality of the garment products are the major concerns of the managers and policy makers of this industry. There are many ways for productivity improvement that helps garment factories to boost up current labor productivity. Among those, higher productivity driven by improving assembly line balancing of the garment production is one of the critical approaches.
The typical problem facing with garment assembly line is the situation that while there is a set of workstations through a sub-assembly process is laying idle, bottlenecks and excess capacity happen in the others. The purpose of balancing a line is to reduce operator’s idle time or maximize operator utilization. In a balanced line, work will flow smoothly and no time will be lost in waiting for work. Line balancing is an effective tool for greater efficiency by distributing the task over each work station in proper balance of the resources, thus increasing the productivity.
Many advanced information systems that are equipped with techniques and algorithms for solving line balancing issue have been used in the garment factories in many developed countries. However, in Vietnam, balancing sewing lines is still one of the very new issues.
©IJRASET: All Rights are Reserved
2249
attempt to propose the solution of the assembly line balancing for garment factories in Vietnam by applying the heuristic methods.The next parts of the paper will be structured as follows: Section 2 reviews related literature. Section 3 defines the line balancing problem and related technical terms. Subsequently, the scales and parameters for evaluating the effectiveness of the production line balancing solution will be presented. Section 4 describes the heuristic methods for solving line balancing. Section 5 presents the testing and results. Finally, some discussion will be drawn for future work directions.
II. LITERATURE REVIEW
In the industrial factories, products are produced in line according to the flow of patterns to compile to finished products. A line includes multiple workstations that specialize a given work tasks with the high expertise in labor and machinery. In other words, one to several tasks are grouped into one workstation. The process of deciding how to arrange these workstations in the production line and which tasks are assigned to a specific workstation to ensure that no workstation is overloaded while these others are idle, is so-called assembly balancing line in industrial factories. The main goal is to create the solution for assigning various tasks to workstations so that all workstations have the relatively equal length of time to complete all work contents at that station (i.e. the total length of time spent performing all the work tasks). By maintaining well balanced, the line could maximize uses of man power and machine capacity, as well as minimize the process time, thus increase production efficiency.
Balancing industrial sewing line is one of the specific applications of the line balancing problem. In the world, the garment industry in particular and the manufacturing industry in general have a long history, but it was not until the early 1950s that the balance of production lines began one of the research topics in the field of Industrial Engineering Management. There are many different approaches to line balancing problem which are used to optimize the allocation of resources and improve the efficiency of the production line. One of the typical studies in this area is that of Anthony A. Mastor. In his studies, Mastor [3] classifies the balancing problem into two types. The first type is designed for the production lines with a given specific cycle time, the solution aims to minimizes the number of workstations in the line. The second type is the form of the existing production lines with a fixed number of workstations. The goal of line balancing is to build up the plan for production line so that the process output is as high as possible, or in short, the cycle time of the line is minimal.
In general, the line balancing problem is a big and complex problem requiring suitable models and algorithms. There are many different techniques to solve this problem that have been studied in this field. These solutions can be divided into four main groups as follows [4]: The first group is composed of optimum seeking methods include branch and bound technique, dynamic programming, linear and integer programing [5]. The second group of solutions is the heuristic method, including constructive procedure, genetic algorithms, Tabu search, simulated annealing and ant colony optimization. The third is the group of machine learning solutions that includes the theory of constraints, knowledge-based approach and expert systems. The fourth group is the solutions using simulation models.
©IJRASET: All Rights are Reserved
2250
In summary, there are many methods to solve the line balancing problem for the production line, but most of these approachesprovide asymptotically optimal solutions and each of them comes up with a distinct solution about the layout design and arrangement for the production line. No less important is that no solution is considered as the best one for all various cases of line balancing problems.
III. ASSEMBLY LINE BALANCING
A. Problem Definition
An assembly line is a manufacturing system in which components are consecutively assembled by a set of tasks to produce an unfinished product. The unfinished product is then transferred from one workstation to its successive workstation along a line until they reach to the end of the line to complete a final product. Each and every station is assigned with a finite set of different tasks that link together by the precedence relationship among them. In other words, some tasks can only be started after other tasks have been finished. For each task, it is performed in a certain time called as the task time. For a given workstation, the sum of the task time of all tasks performed at this station should not exceed the maximum amount of time a product is allowed to spend at each station. That is called the cycle time. Under two constraints of precedence relations and cycle time restrictions, how to equalize the amount of tasks at each workstation such that each workstation has the same work load/time for processing a unit is known as the assembly line balancing problem. If each workstation on the assembly line takes the same amount of time to perform the work elements that have been assigned, then products will move smoothly from workstation to workstation with no need for a product to wait or a worker to be idle. By this way, balancing a line can help reduce operator’s idle time or maximize operator utilization, thus increasing the productivity of the whole manufacturing system.
B. Technical Terms
To reach to a completed product, the work is divided into series of elementary tasks with short duration so-called task. If V is a set of tasks to finish a single product, then V is represented as V = {1, …, n}, whereas i is the index of task and i = 1, 2, …, n, and i is the total number of tasks to produce a completed product. To perform a given task i, it requires a period of time ti. It is so-called a standard processing time of task i.
A production line includes a set of workstations located along the production line or raw material processing line that are numbered
as 1, 2, …,m. Each workstation will be allocated to perform one single task or a set of tasks. If Sk is a set of tasks assigned to
workstation k, hence =∑∈ is the total length of time for that workstation to perform all the assigned tasks, so-called in
short as workstation time In the garment production, the process is continuously carried out in the sewing line and the work results of this workstation will be transferred to the workstation. However, the transition between tasks will depend on the constraints between them. This constraint is the requirements of precedence order among these tasks. For example, in the sewing line of T-shirt products, there are the task such as: sewing the collar, sewing the shirt body, sewing the sleeves. These tasks must be performed separately before moving to the task of assembly of the collar and sleeve to the body of the shirt. Balancing in sewing line is to assign a given set of tasks to an ordered set of work stations and ensures that the precedence constraints of tasks are satisfied while some general objectives such as line performance measure, machine/labor utilization or production cost are optimized.
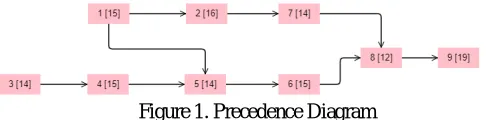
[image:3.595.180.423.629.689.2]The order constraint of task to produce a complete product, along with the time taken to perform each task are represented by a diagram so-called precedence diagram. The precedence diagram is a type of network representation that consist of nodes and edges. For representing the tasks of a given production line, two decisions need to be made: What constitutes a node and what forms a link? On the precedence diagram, each node represents a task, indexed by the task code along with its processing time in parentheses. The links navigate between two given nodes to show the order relationship between them.
Figure 1. Precedence Diagram
©IJRASET: All Rights are Reserved
2251
= { , }, i.e. workstation 1 will be responsible for task 1 and task 3; = { , }, i.e. workstation 2 will perform task 2 and task 4, = { , }, i.e. workstation 3 will perform tasks 5 and 6, = { , }, i.e. workstation 4 will perform tasks 7 and 8, and = { }, that is, workstation 5 will perform task 9. With this “task to workstation” allocation, the cycle time will be = which is also the time taken at workstation 2 to complete all of its tasks. This is the longest time length among the workstation times along the production line. Therefore, we can count the free time of the workstations 1, 2, 3, 4, 5 are: 2, 0, 2, 5, 12 correspondingly. In summary, there are many different plans to layout the workstations along the production line. As the results, the efficiency, the amount of wasted time, as well as productivity of these alternative arrangements will also vary. Therefore, the next part of the study will present the well-known parameters to assess the effectiveness of a specific line balancing solution.
C. Scales to Evaluate the Balance of the Production Line
In order to assess the balance of production lines, one draws up scales to evaluate the balance of different algorithms. This study uses four scales in Scholl's study [19], [20], [21] to measure the balance of the line as following:
1) Line Efficiency: Line efficiency ( ) is an indicator of the effective use of time in the assembly line. is expressed as the ratio of time at work stations to the product of the cycle time and workstation number . Therefore, is mathematically
represented as follows:
=∑
.
where:
is the number of work stations of the production line is the cycle time
is the total time of performing the steps at the station
2) Balance Delay: Balance delay ( ) is the amount of idle time on production assembly line caused by the uneven division of work among workstations [22]. Therefore, is mathematically represented as follows:
= . − ∑
.
where:
is the number of work stations of the production line is the cycle time
is the total time of performing the steps at the station
3) Smoothness Index: Smoothness index (SI) is used to measure the distribution of working time between the working hours in the assembly line. At the same time, it is also an important indicator to reflect the working time of each station. The smaller the smoothness index number, the smaller the working time fluctuation between the workstations of the assembly line, hence, the better the balance of the assembly line. Its formula is as follows:
= ( − )
where:
is the number of work stations of the production line is the cycle time
is the total time of performing the steps at the station
4) Production Rate: With the assumption that the number of working hours of the production is 8 hours per day, production rate ( ) is the total working time a day by second divided to the cycle time and the number of workstations, as follows:
= ∗ ∗
∗ where:
©IJRASET: All Rights are Reserved
2252
IV. HEURISTIC METHODS
A heuristic method is a procedure to discover a fairly feasible solution, yet not necessarily an optimal solution, for the specific line balancing problem. There is no guarantee about the quality of the solution obtained, but a well-designed heuristic method usually can provide a solution that is at least nearly optimal (or with the conclusion that no such better solutions exist). The heuristic method also should be sufficiently efficient to deal with very large line balancing problems. This is an iterative algorithm, where each iteration searching for a new solution that might be better than the one found previously. After a given time running the iterative algorithm, the final solution it finds out is can be seen as the best one. In this research, we use three heuristic approaches, namely Largest Candidate Rule (LCR), Kilbridge and Wester’s method (K&W), Ranked Positional Weight method (RPW). These are heuristic procedures which selects the tasks to assign to each workstation according to their processing time and their relationship order in the precedence diagram.
A. The Largest Candidate Rule (LCR)
This is the method that aim to achieve the line balance by distributing the total workload on the assembly line as evenly as possible, despite the reality in which it is impossible to obtain a perfect line balance among the workstations. It is then the role of line balance efficiency which is related to the differences in minimum rational processing time and the precedence constraints between the tasks. The LCR accounts for work tasks to be arranged in a descending order of the task time to allocate it to workstation, so that each workstation time Tek should not exceed the cycle time c.
B. Kilbridge and Wester (K&W)
Kilbridge and Wester method is a heuristic procedure that selects work task to assign to workstations according to their positions in the precedence diagram. This method known for its reliability in overcoming the difficulties facing in LCR method where a given task could be selected based on it processing time. Yet it fails to comply with the order relationship among the tasks in the precedence diagram [4].
C. Ranked Positional Weight (RPW)
RPW was introduced by Helgeson and Birnie in 1961 [5]. It is a combination of LCR and K&W methods. The RPW takes account of both the processing time of the task and its position in the precedence diagram. Therefore, the tasks are assigned to workstations based on their RPW weight.
D. Steps of Algorithm Procedure
1) Step 1: Set up the precedence diagram for the assembly line
2) Step 2: Compute the weight for each task
3) Step 3: Iterative running
a) Step 3.1. The task that satisfies the assignment condition will be stacked in the queue
b) Step 3.2. Re-arrange tasks based on their weight a. in descending order of the task time (for LCR case)
b. in ascending order of a given task’s positions in the precedence diagram and in a descending order of its task time (for K&W case)
c. in descending order of RPW weight (RPW case)
c) Step 3.3. The tasks in the queue will be respectively assigned to workstations. For each allocation of task, it is necessary to check the constraint that the workstation time should not exceed the cycle time. If the workstation time exceeds the cycle time, the allocation will be for the next task. If all the tasks fail to comply with this constraint, the allocation will be for the next workstation.
d) Step 3.4. Repeat step 3.1
4) Step4. Loop until the final task in the precedence diagram.
V. EMPIRICAL TESTING
A. Data Description
©IJRASET: All Rights are Reserved
2253
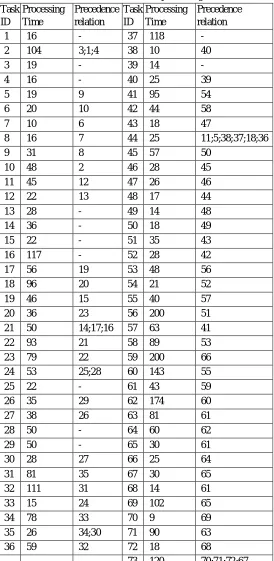
Table 1. List of tasks and its processing timeTask ID
Processing Time
Precedence relation
Task ID
Processing Time
Precedence relation
1 16 - 37 118 -
2 104 3;1;4 38 10 40
3 19 - 39 14 -
4 16 - 40 25 39
5 19 9 41 95 54
6 20 10 42 44 58
7 10 6 43 18 47
8 16 7 44 25 11;5;38;37;18;36
9 31 8 45 57 50
10 48 2 46 28 45
11 45 12 47 26 46
12 22 13 48 17 44
13 28 - 49 14 48
14 36 - 50 18 49
15 22 - 51 35 43
16 117 - 52 28 42
17 56 19 53 48 56
18 96 20 54 21 52
19 46 15 55 40 57
20 36 23 56 200 51
21 50 14;17;16 57 63 41
22 93 21 58 89 53
23 79 22 59 200 66
24 53 25;28 60 143 55
25 22 - 61 43 59
26 35 29 62 174 60
27 38 26 63 81 61
28 50 - 64 60 62
29 50 - 65 30 61
30 28 27 66 25 64
31 81 35 67 30 65
32 111 31 68 14 61
33 15 24 69 102 65
34 78 33 70 9 69
35 26 34;30 71 90 63
36 59 32 72 18 68
73 120 70;71;72;67
©IJRASET: All Rights are Reserved
2254
Figure 2. The precedence diagramsB. Results and Discussions
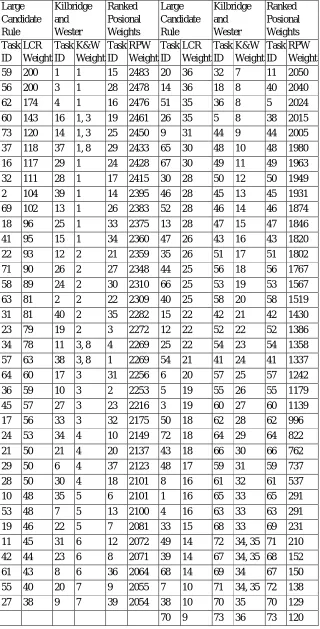
For Large Candidate Rule, the weight allocated for each node (i.e. task) is its processing time, sorting by descending order.
For Kilbridge and Wester, the weight allocated for each node (i.e. task) is the combination of task’s positions in the precedence diagram, sorting by ascending order and, task’s processing time sorting by descending order.
For Ranked Positional Weight method, the weight allocated for each node (i.e. task) is the total time to go through this node to the final node of the precedence diagram. The node is sorted by descending order of node’s RPW weight.
The results of weight calculations based on these three methods are listed in the Table 2.
©IJRASET: All Rights are Reserved
2255
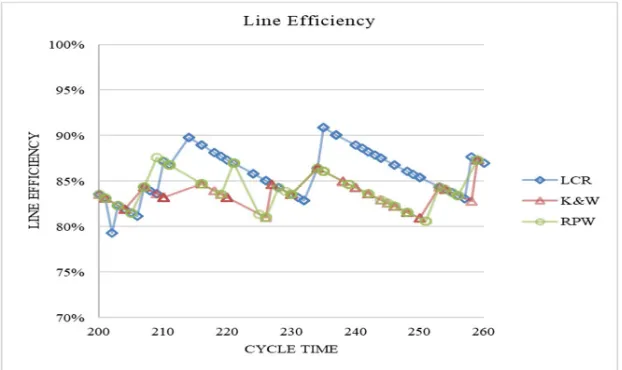
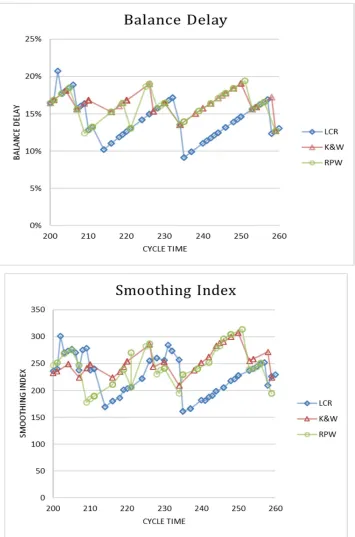
Figure 3. Comparision among heuristic methods on three scales LE, BD and SIHowever, when we consider about the number of workstations in the assembly line and the number of products that can be finished per day by the line (table 3), we can see that if the numbers of workstations are 19, 22, 23, the maximum number of products will be 123, 139 and 144 respectively for all the three heuristic methods. In case of 21 workstations, RPW provides the best assignment solution for the production line of 138 products per day. In case of 17 or 18 workstations, LCR can achieve the highest number of finished products per day of 112 and 123 respectively.
©IJRASET: All Rights are Reserved
2256
Table 3. Number of products based on
Large Candidate Rule Kilbridge and Wester Ranked Posional Weights Large Candidate Rule Kilbridge and Wester Ranked Posional Weights Task ID LCR Weight Task ID K&W Weight Task ID RPW Weight Task ID LCR Weight Task ID K&W Weight Task ID RPW Weight 59 200 1 1 15 2483 20 36 32 7 11 2050
56 200 3 1 28 2478 14 36 18 8 40 2040
62 174 4 1 16 2476 51 35 36 8 5 2024
60 143 16 1, 3 19 2461 26 35 5 8 38 2015
73 120 14 1, 3 25 2450 9 31 44 9 44 2005
37 118 37 1, 8 29 2433 65 30 48 10 48 1980
16 117 29 1 24 2428 67 30 49 11 49 1963
32 111 28 1 17 2415 30 28 50 12 50 1949
2 104 39 1 14 2395 46 28 45 13 45 1931
69 102 13 1 26 2383 52 28 46 14 46 1874
18 96 25 1 33 2375 13 28 47 15 47 1846
41 95 15 1 34 2360 47 26 43 16 43 1820
22 93 12 2 21 2359 35 26 51 17 51 1802
71 90 26 2 27 2348 44 25 56 18 56 1767
58 89 24 2 30 2310 66 25 53 19 53 1567
63 81 2 2 22 2309 40 25 58 20 58 1519
31 81 40 2 35 2282 15 22 42 21 42 1430
23 79 19 2 3 2272 12 22 52 22 52 1386
34 78 11 3, 8 4 2269 25 22 54 23 54 1358
57 63 38 3, 8 1 2269 54 21 41 24 41 1337
64 60 17 3 31 2256 6 20 57 25 57 1242
36 59 10 3 2 2253 5 19 55 26 55 1179
45 57 27 3 23 2216 3 19 60 27 60 1139
17 56 33 3 32 2175 50 18 62 28 62 996
24 53 34 4 10 2149 72 18 64 29 64 822
21 50 21 4 20 2137 43 18 66 30 66 762
29 50 6 4 37 2123 48 17 59 31 59 737
28 50 30 4 18 2101 8 16 61 32 61 537
10 48 35 5 6 2101 1 16 65 33 65 291
53 48 7 5 13 2100 4 16 63 33 63 291
19 46 22 5 7 2081 33 15 68 33 69 231
11 45 31 6 12 2072 49 14 72 34, 35 71 210
42 44 23 6 8 2071 39 14 67 34, 35 68 152
61 43 8 6 36 2064 68 14 69 34 67 150
55 40 20 7 9 2055 7 10 71 34, 35 72 138
27 38 9 7 39 2054 38 10 70 35 70 129
©IJRASET: All Rights are Reserved
2257
number of workstationsMaximum number of products finished per day
Number of
Workstations LCR K&W RPW
17 112 111 111
18 123 113 114
19 123 123 123
20 135 126 130
21 137 133 138
22 139 139 139
23 144 144 144
24 143 - -
REFERENCES
[1] L. H. Thuan, “Vietnamese Textile and Apparel Industry Report - 2017,” 2017.
[2] N. T. L. Huong, “Vietnamese Textile and Apparel Industry in the Context of FTA: The Labour and Social Impacts,” 2017.
[3] A. A. Mastor, “An Experimental Investigation and Comparative Evaluation of Production Line Balancing Techniques,” Manage. Sci., vol. 16, no. 11, pp. 728–
746, 1970.
[4] W. Grzecha, ASSEMBLY LINE – THEORY AND PRACTICE Edited by Waldemar Grzechca. 2011.
[5] E. H. Bowman, “Assembly-Line Balancing by Linear Programming,” Oper. Res., 2008.
[6] J. H. Patterson and J. J. Albracht, “Technical Note—Assembly-Line Balancing: Zero-One Programming with Fibonacci Search,” Oper. Res., 2008.
[7] M. Held, R. M. Karp, and R. Shareshian, “Assembly-Line Balancing—Dynamic Programming with Precedence Constraints,” Oper. Res., 2008.
[8] J. Bautista and J. Pereira, “A dynamic programming based heuristic for the assembly line balancing problem,” Eur. J. Oper. Res., 2009.
[9] G. Suresh, V. V. Vinod, and S. Sahu, “A genetic algorithm for assembly line balancing,” Prod. Plan. Control, 1996.
[10] G. Suresh and S. Sahu, “Stochastic assembly line balancing using simulated annealing,” Int. J. Prod. Res., 1994.
[11] W. P. Helgeson and D. P. Birnie, “Assembly Line Balancing Using the Ranked Positional Weight Technique.,” Journal of Industrial Engineering, 1961.
[12] M. Kilbridge and L. Wester, “A heuristic method of assembly line balancing,” J. Ind. Eng., vol. 12, no. 4, 1961.
[13] J. Bautista and J. Pereira, “Ant algorithms for a time and space constrained assembly line balancing problem,” Eur. J. Oper. Res., 2007.
[14] E. M. Goldratt and J. Cox, The Goal: A Process of Ongoing Improvement. 2004.
[15] B. Malakooti and A. Kumar, “A knowledge-based system for solving multi-objective assembly line balancing problems,” Int. J. Prod. Res., vol. 34, no. 9, 1996.
[16] K. H. Oh, “Expert Line Balancing System (ELBS),” Comput. Ind. Eng., 2003.
[17] J. Driscoll and A. A. Abel Shafi, “A simulation approach to evaluating assembly line balancing solutions,” Int. J. Prod. Res., 1985.
[18] P. Cortés, L. Onieva, and J. Guadix, “Optimising and simulating the assembly line balancing problem in a motorcycle manufacturing company: A case study,”
Int. J. Prod. Res., 2010.
[19] A. Scholl and C. Becker, “State-of-the-art exact and heuristic solution procedures for simple assembly line balancing,” in European Journal of Operational Research, 2006.
[20] A. Scholl, Balancing and Sequencing of Assembly Lines. 2012.
[21] N. Boysen, M. Fliedner, A. Scholl, D. W. Fakultät, D. F. Jena, and F. Jena, “A classification of assembly line balancing problems A classification of assembly
line balancing problems,” 2006.