Identification of Influential Node in a Complex
Network using WSM (Weighted Sum Model)
Faizaan Ahmad1, Ranjit Biswas2
2
Professor, School of Engineering Sciences &Technology, Jamia Hamdard, New Delhi-110062
1
Department of Computer Science and Engineering, Jamia Hamdard, NewDelhi-110062
Abstract: Identification of influential nodes is a significant issue in the structural analysis of complex network. To address this issue, different centrality measures have been proposed such as betweenness centrality, closeness centrality, degree centrality, but all of them suffered from some drawbacks. This research proposes a new method to identify influential nodes based on Weighted Sum Method (WSM). Weighted Sum Method is one of the widely used and simplest multi-criteria decision making method. In this paper, different centrality measures are considered as the multi-attribute of complex network, so as to take advantage of each centrality measure. The multi-attribute of complex network are aggregated using WSM to compute the importance of each node in the network. The efficacy and feasibility of the proposed method is established by conducting experiments on four real-world networks and an informative network.
Keywords: WSM, BC, CC, DC, PGP, MADM
I. INTRODUCTION
Complex network theory has received significant attention from researchers due to their widespread application, which ranges from the viral marketing of products to the outbreak of disease and from the diffusion of influence to the spread of ideas [1,13, 21]. There are various functions of complex networks such as transfer of ideas, information, diseases, influences and trust. Determination of influential nodes leads to maximum information spread in the underlying network. Hence, identification of influential spreaders is one of the major concern in complex network that can be applied in diverse fields such as in creation of new marketing strategy, conduct study on public opinion, rumour dynamics and vaccination strategies [12, 15, 16, 22].
In recent years, many approaches based on node centrality such as betweenness centrality (BC) [26], closeness centrality (CC) [27], page rank (PR), leader rank and degree centrality (DC) have been proposed, each having its own limitation and advantage. Although, DC was computationally less complex, but took into account local information of the topology. This problem was overcome by BC and CC that considered global information of the topology to identify important nodes, but due to their high computational complexity they were not applicable to large-scale networks. Another drawback of CC was their inefficiency to be applied to disconnected components. The performance of PR was good for scale-free networks, but failed for random networks. Later, spectral centrality measures were proposed such as, Leader rank (LR), Eigen vector centrality (EC) and semi-local centrality (SLC). EC had advantage over DC, CC and BC since it was applicable for signed and valued graphs while the latter was applicable for simple graphs, but it failed for asymmetric graphs. LR and PR were effective for directed networks but were not applicable for undirected networks. In other words, there is an urgent need to develop an efficient and reasonable ranking algorithm that can identify influential nodes in complex network.
II. LITERATURE SURVEY
Influence maximization (IM) problem was proved as NP-Hard problem by Kemp et al. [20] presented greedy approximate algorithms that considered IC (Independent Cascade), Weighted Independent Cascade and LT (Linear Threshold) as influence models and the optimal solution obtained had (1-1/e) computational complexity. Later a lot of research was conducted by the research community and they presented different algorithms to identify influential nodes with maximum influence spread.
A greedy algorithm named “Cost Efficient Lazy Forward Scheme” (CELF) was proposed by Leskovec et al. [24] and it showed an improved speed up by 700 times over the greedy algorithm.
Later presented CELF++ algorithm which was an improvement over CELF. In CELF++ algorithm, the performance of CELF was optimized by exploiting sub modularity and it was 35-50% fast in terms of execution time than CELF. Another work was presented by Chen et al. [8], where they proposed Mixed Greedy and Greedy algorithms that were improvement over the greedy algorithm from a different perspective.
A bound linear approach was proposed by Liu et al. [19] to solve influence maximization problem and influence computation. Different meta-heuristic algorithms such as cuckoo search algorithm, particle swarm optimization algorithm, simulated annealing algorithm, and genetic algorithm have been employed to cope with the problem of IM.
Another area that is being explored in the IM domain is to identify influential nodes w.r.t more than one criteria. This research area of IM was first explored by in 2013, where they proposed a novel approach that used TOPSIS, a multi-criteria approach to select salient nodes in the underlying network.
The task of identifying influential nodes was given due importance by Zhang et al. [25]. Eight criteria were taken into consideration by them to find the key node in the network.
The eight criteria were hierarchy, constraint, efficiency, effective size, closeness centrality, betweenness centrality, eigenvector centrality, and degree centrality. The weight of the criteria was computed using AHP method and TOPSIS method was applied to obtain the rank list of nodes based on the importance of nodes. An improved TOPSIS method was proposed by D et al. [18] that considered multiple criteria for the identification of influential nodes in the network. The shortcoming of the approach was the way of computation of weights for criteria. This limitation was overcome by where he proposed a dynamic way of calculating the weight of the criteria.
III. PROPOSED FRAMEWORK
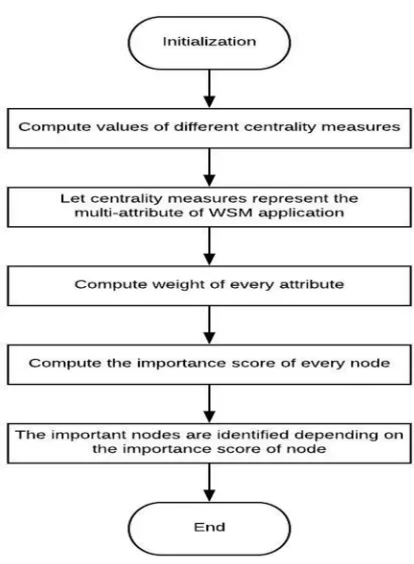
The proposed W-WSM consists of the following steps and is presented in Figure 1:
A. Compute the values for 3 different criteria, that are considered here as 3 different centrality measures (cm). The measures here are Betweenness Centrality (BC), Closeness Centrality (CC), and Degree Centrality (DC)[5]. Construct a decision matrix D(Oxy) or D(Ox3) with x rows representing alternatives and y (here y =3) columns representing criteria.
D (Oxy) =
⎣ ⎢ ⎢ ⎢ ⎡
. . .
. . .
⎦ ⎥ ⎥ ⎥ ⎤
×
B. Matrix D(Oxy) is normalized and matrix R(rpq) is constructed such that
rpq =∑ ; p = 1, 2..x; q = 1, 2,3
Figure 1: Flowchart for WSM
D. The total importance of the p-th node is computed using eq. 2:
=∑ , p = 1, 2, 3,..x; q = 1, 2,3 (2)
E. A rank list of nodes is constructed according to the importance score of the node
Explanation using example
Figure 2: A toy network consisting of 6 nodes and 7 edges
1) Compute the values of three di erent centrality measures DC, CC, and BC. A decision matrix D(Oxy) or D(Ox3) is constructed with x rows representing nodes and y columns representing di erent centrality measures.
D(Oxy) =
⎢ ⎢ ⎢ ⎢
⎡4 0.166 0.551 0.100 0
2 0.111 0.05 2 0.125 0.10 3 0.142 0.2⎥⎥
2) Matrix D is normalized and matrix R is obtained
r11 = = 0.285
And matrix R(rpq) is obtained as below:
R =
⎣ ⎢ ⎢ ⎢ ⎢
⎡0.285 0.216 0.6110.071 0.129 0 0.142 0.144 0.055 0.142 0.162 0.111 0.214 0.185 0.222
0.142 0.162 0 ⎦
⎥ ⎥ ⎥ ⎥ ⎤
3) The weights are determined according to Step 3 where(BC =3 , CC = 2, DC = 1)
4) The importance of the Hep−th (here p = 1 i.e. importance of 1st node) node is computed using Eq.(2)
5) M = ∑ = 2.55
6) A rank list is constructed based on the importance score of the node computed in the previous step:
Node Score Rank
1 2.55 1
2 0.329 5
3 0.595 6
4 0.799 4
5 1.25 3
[image:4.612.225.389.269.441.2]6 1.25 2
Table 1: A rank list of nodes according to their importance score
The rank list is obtained according to node importance score using Eq. (6) and is shown in Table 1. According to the proposed method, node 1 is the most important node, since it is the central node and acts as a connecting node between two sub-networks (2) and (3, 4, 5, 6). Thus, it can be said that W-WSM is able to rank nodes correctly according to their spreading ability.
IV. RESULTS AND DISCUSSION
A. Dataset
The performance of the proposed approach is validated using four real networks:
1) Yeast [9]: The dataset is an un-weighted network representing protein and yeast interactions.
2) PGP [9]: The dataset represents an encrypted communication network. Pretty Good Privacy algorithms are used to maintain privacy among users; iii) HEP-th: This dataset is also known as “High Energy Physics” and represents an un-weighted citation network. The can be downloaded from: www.casos.cs.cmu.edu/computational_tools/datasets/external/hep-th/index11.php.
Network a b Nd PLavg Degavg Betmax
USAir 332 2126 6 2.563 12.807 5286.21
PGP 10680 48632 24 7.485 9.107 14959584.71
Yeast 2361 14364 16 4.647 6.084 36248.02
HEP-th 8361 31502 17 5.61 3.768 25686.02
B. Yeast
[image:5.612.213.400.142.422.2]The list of top-15 nodes computed by BC, CC, DC and the proposed method is presented in table. As can be seen in the given table that BC and the WSM computes the same set of top-13 nodes. Hence, we compute Kendall’s tau to compute the correlation between ranking lists.
Table 3. Rank lists of top-15 nodes generated by proposed WSM, BC, CC, and DC in Yeast network
Ranking WSM BC CC DC
1 1441 156 842 465
2 886 1441 672 289
3 656 886 1131 199
4 156 656 1332 1441
5 199 199 2081 886
6 648 638 98 156
7 289 289 612 478
8 497 497 832 109
9 2008 2008 902 541
10 109 109 899 141
11 478 181 1121 497
12 239 478 1212 2008
13 181 239 1261 498
14 280 280 1298 54
[image:5.612.171.424.452.708.2]C. PGP
Table presents the top-15 nodes rank lists computed by WSM, CC, BC and DC. As can be seen from the table that WSM and BC compute the same set of top-15 nodes.
Ranking WSM BC CC DC
1 62 62 62 23
2 127 128 125 124
3 489 499 488 162
4 239 239 233 58
5 28 192 193 347
6 192 28 29 1389
7 698 698 699 1390
8 289 289 288 1391
9 23 117 118 192
10 191 191 190 57
11 117 141 140 621
12 141 23 231 1392
13 36 36 361 1393
14 219 219 27 1394
15 27 27 291 1395
Table 5. Rank lists of top-15 nodes generated by proposed WSM, BC,CC, and DC in PGP network
Fig.4 Kendall Tau coefficient of WSM and BC in PGP network
D. Correlation Analysis
A node is considered to be important if it has large spreading ability. One of the widely used method for computing rank correlation is Kendall's Tau coefficient that measures the correlation between two variables.
Let us assume that there exists two ranklists, first is node spreading ability list obtained from SIR model and second is ranking list generated by ranking method. A large value of correlation coefficient between the two ranklists would signify that the performance of ranking method is good.
In the proposed research, Kendall's Tau coefficient is used to analyze the correlation between the proposed D-WSM and WT. Let us consider that there are n nodes in the network, then Kendall's Tau coefficient Tk is defined
as:-k =( )−( )
( −1)/2
1) Vi < Vj and Wi < Wj, 2) Vi > Vj and Wi > Wj
Similarly, pairs (Vi,Wi) and (Vj,Wj) are said to be discordant if their ranks occur in reverse order. That is, if 1) Vi < Vj and Wi > Wj
2) Vi > Vj and Wi < Wj
If pairs (Vi = Vj) or (Wi = Wj), then such pairs are neither classified as discordant or concordant and are neglected. A large value of Tau indicates that the ranking method has generated more accurate ranking lists.
If Tk = 1, this would be an ideal case, where the ranking lists generated by real spreading process and ranking method are exactly same. For large value of infection spreading probability β, the infection (information) would spread to almost all over the network. In the proposed research, the value of β of SIR model is varied from 0.01 to 0.1.
From fig.3, we can see that he performance of WT is better than D-WSM, when the value of $\beta$ is between 0.03 to 0.05 in Yeast network, but for other cases, the scenario is reverse.
In fig.4, it is observed that D-WSM outperforms WT for every value of β in PGP network. Apart from this, a large value of Kendall's Tau (0.9) is achieved when β = 0.09.
E. Complexity Analysis
A real complex network comprises of many nodes. Hence, a highly reasonable and efficient ranking method is required to determine node importance. This section deals with the determination of computing complexity of the proposed approach, given that the underlying network consists of m nodes and n edges and a avg represents average degree of the network.
F. The Proposed Approach Comprises Of Three Phases
In the first phase, a multi-attribute matrix is constructed by computing values of CC, BC, and DC. The computational complexity of CC using Floyd's algorithm is O (n^3). DC is computed in time O (n). The time complexity for computing BC using Brand's method is O (m * n) – O (m^2 aavg). Euclidean standardization is used to normalize the matrix and it takes time O (n). The second phase concentrates on determining the computational complexity of the weights of attributes using SIR. SIR model is used to compute node spreading ability F, that takes O (m * n) ⩽ O (m^3). The third phase observes ranking and evaluation of the nodes present in the network using Weighted Sum Method (WSM). The complexity of computing WSM is O (m). Finally, according to the above analysis, it is concluded that the computational complexity of the proposed D-WSM is O (m^3).
V. CONCLUSION
Identification of influential nodes is a significant task for solving influence maximization problem. This paper uses Weighted Sum Method, a multi-criteria decision approach to identify a set of influential nodes in the network. The main contribution of the paper is that it utilized three centrality measures as the multi-attributes of nodes to solve IM problem. To analyze the performance of WSM, SIR model is used to simulate the diffusion of influential nodes in the underlying network. Influential nodes identified by WSM had fast influence spreading capability. From the application perspective, it is a good approach to detect influential nodes using multiple centrality measures.
REFERENCES
[1] Albert, R., and Barabási, A. L. (2002). Statistical mechanics of complex networks. Reviews of modern physics, 74(1), 47.
[2] Arquam, M., Singh, A., Sharma, R. (2018, December). Modelling and Analysis of Delayed SIR Model on Complex Network. In International Workshop on Complex Networks and their Applications (pp. 418-430). Springer, Cham.
[3] Bhatt, S. Y., Abulaish, M. (2017). A Unified Framework for Community Structure Analysis in Dynamic Social Networks. In Hybrid Intelligence for Social Networks (pp. 77-97). Springer, Cham.
[4] Bian , T., Hu, J., and Deng, Y. (2017). Identifying influential nodes in complex networks based on AHP. Physica A: Statistical Mechanics and its Applications, 479, 422-436.
[5] Brahimi, L., Bellatreche, L., and Ouhammou, Y. (2017). Coupling multi-criteria decision making and ontologies for recommending dbms. In 22nd International Conference on Management of Data, COMAD (pp. 08-10).
[6] Cao, T., Wu, X., Wang, S., and Hu, X. (2010, March). OASNET: an optimal allocation approach to influence maximization in modular social networks. In Proceedings of the 2010 ACM Symposium on Applied Computing (pp. 1088-1094). ACM.
its applications, 391(4), 1777-1787.
[10] Domingos, P., and Richardson, M. (2001, August). Mining the network value of customers. In Proceedings of the seventh ACM SIGKDD international conference on Knowledge discovery and data mining (pp. 57-66). ACM.
[11] Du, Y., Gao, C., Hu, Y., Mahadevan, S., and Deng, Y. (2014). A new method of identifying influential nodes in complex networks based on TOPSIS. Physica A: Statistical Mechanics and its Applications, 399, 57-69.
[12] Gao, C., Lan, X., Zhang, X., and Deng, Y. (2013). A bio-inspired methodology of identifying influential nodes in complex networks. PloS one, 8(6), e66732.
[13] Goel, R., Singh, A., Ghanbarnejad, F. (2019). Modeling Competitive Marketing Strategies in Social Networks. Physica A: Statistical Mechanics and its Applications, 518, 50-70.
[14] Goyal, A., Lu, W., and Lakshmanan, L. V. (2011, March). Celf++: optimizing the greedy algorithm for influence maximization in social networks. In Proceedings of the 20th international conference companion on World Wide Web (pp. 47-48). ACM.
[15] Gupta, N., Singh, A., Cherifi, H. (2016). Centrality measures for networks with community structure. Physica A: Statistical Mechanics and its Applications, 452, 46-59.
[16] Gupta, N., Singh, A., Cherifi, H. (2015, January). Community-based immunization strategies for epidemic control. In Communication Systems and Networks (COMSNETS), 2015 7th International Conference on (pp. 1-6).
[17] Hespanha, J. P. (2004). An efficient matlab algorithm for graph partitioning. Santa Barbara, CA, USA: University of California.
[18] Hu, J., Du, Y., Mo, H., Wei, D., and Deng, Y. (2016). A modified weighted TOPSIS to identify influential nodes in complex networks. Physica A: Statistical Mechanics and its Applications, 444, 73-85.
[19] Jaquet, V., and Pechal, M. (2009). Lecture with Computer Exercises: Modelling and Simulating Social Systems with MATLAB.
[20] Kempe, D., Kleinberg, J., and Tardos, É. (2003, August). Maximizing the spread of influence through a social network. In Proceedings of the ninth ACM SIGKDD international conference on Knowledge discovery and data mining (pp. 137-146). ACM.
[21] Kim, D. H., Noh, J. D., and Jeong, H. (2004). Scale-free trees: The skeletons of complex networks. Physical Review E, 70(4), 046126.
[22] Kumar, P., Verma, P., Singh, A. (2018). A Study of Epidemic Spreading and Rumor Spreading over Complex Networks. In Towards Extensible and Adaptable Methods in Computing (pp. 131-143). Springer, Singapore.
[23] Lancichinetti, A., Fortunato, S., and Radicchi, F. (2008). Benchmark graphs for testing community detection algorithms. Physical review E, 78(4), 046110. [24] Leskovec, J., Krause, A., Guestrin, C., Faloutsos, C., VanBriesen, J., and Glance, N. (2007, August). Cost- effective outbreak detection in networks. In
Proceedings of the 13th ACM SIGKDD international conference on Knowledge discovery and data mining (pp. 420-429). ACM.
[25] Zhang, H., Wei, D., Hu, Y., Lan, X., and Deng, Y. (2016). Modeling the self-similarity in complex networks based on Coulomb’s law. Communications in Nonlinear Science and Numerical Simulation, 35, 97-104.
[26] Linton C. Freeman. (Mar., 1977).A Set of Measures of Centrality Based on Betweenness Vol. 40, No. 1, pp. 35-41.