[
7o 6 ]
SOME FACTORS AFFECTING THE OXYGEN
CONSUMPTION OF ASELLUS
BY R. W. EDWARDS AND M. A. LEARNER Water Pollution Research Laboratory, Stevenage
(Received 3 May i960)
INTRODUCTION
Asellus aquaticus is often abundant in polluted streams (Allan, Herbert & Alabaster, 1958) and under certain conditions its oxygen consumption may be of significance in studies of oxygen balance. In an earlier paper (Edwards, 1958), the need for comparative studies, using different respirometer systems, was stressed. The experiments described in the present paper were carried out using both a Warburg constant-volume respirometer* and an apparatus in which the fall in dissolved-oxygen concentration of water passing through a respirometer was measured, using a polarographic technique.
Most of these experiments have been confined to a study of the effect of body size, temperature, and oxygen concentration on the oxygen consumption of A. aquaticus. Some observations have also been made on the diurnal rhythm of A. aquaticus and the effect of oxygen concentration on the oxygen consumption of A. meridianus, a species which has not been recorded in organically polluted streams.
An extension of this study is not possible at the present time and the authors apologize for the incomplete nature of certain aspects of the work.
MATERIALS AND METHODS
All experiments were conducted between December and March except where the time of year is specifically mentioned.
A. aquaticus was collected from three locations:
(i) Maple Lodge Sewage Effluent Channel, Rickmansworth, Hertfordshire (G.R. SU 039910). The average dissolved-oxygen concentration at the collection site for the year 1953-54 was about 40% of the saturation value and during the winter months was below 30% (Allan et al. 1958).
(ii) River Hiz, Henlow, Bedfordshire (G.R. TL 190378). Animals were collected from an area 4-5 miles below Hitchin Sewage Works. Oxygen records are not available for this site but data have been collected for an area near the effluent discharge (Gameson & Griffith, 1959) and here the average dissolved-oxygen concentration was about 50 % during the winter of 1957-58.
(iii) River Ivel, Stotfold, Hertfordshire (G.R. TL 223373). Collections were made in this unpolluted and spring-fed chalk-stream about 3 miles from its source. In November 1958 a polarographic dissolved-oxygen recording machine was placed at the collection site and the average dissolved-oxygen concentration was between 70 and 80 % for the winter period and did not fall below 60 % (Depart-ment of Scientific and Industrial Research, i960, Fig. 41).
A. meridianus was collected from a pond in Baggrave Park, Leicestershire (G.R. SK 696086).
Animals were kept in the laboratory at 200 C. (± 2° C.) in aerated water for at least 24 hr. after collection and were allowed to feed, except in certain Warburg experiments described later where animals were starved for 24 hr. before oxygen-consumption measurements were made. Animals used in experiments at 10° C. were acclimatized to that temperature for 24 hr. Respirometers were fitted with hoods to exclude light. The wet and dry weights of groups of animals were determined, but there was no change in the proportion of dry matter in these groups (about 20%) with an increase in size. The effect of moulting on the wet weight:dry weight ratio in individual specimens was not studied.
Warburg respirometer
The techniques used were similar to those described in an earlier paper (Edwards, 1958). A. aquaticus from the Sewage Effluent Channel was used exclusively and experiments were conducted between December 1956 and March 1957 except for those on diurnal rhythms, which were conducted in July 1957.
Polarographic respirometer
Polarographic techniques have been employed to measure oxygen concentrations in respirometer studies for many years (Berg, 1953). Some workers have described techniques which measure the dissolved-oxygen concentration continuously (Mann, 1958; Bielawski, 1959). The apparatus used in the present study measures the concentration of dissolved oxygen in the water before and after it has passed through the respirometer tube and records these concentrations on a strip chart.
General description.' A general diagram of the apparatus is shown in Fig. 1. Water passes from the 20 1. reservoir A, through a constant-level device B, to a 10 1. reservoir C, where it is maintained at a constant temperature and the content of oxygen is controlled by saturation with a predetermined mixture of air and nitrogen. From the reservoir C water passes either (a) by direct route, D, to a two-way tap G which controls the flow through the apparatus; or (b) by route E, through the respirometer U-tube F, to tap G. Both routes may be closed near the reservoir C by screw clips. From the tap G, water passes through the electrode chamber J, to a flowmeter K, and then to waste. When water is passing through the direct route from the reservoir, water may also pass through the respirometer route by opening tap H. The water flow in this route is controlled by tap H and measured at the flowmeter, /. By including an alternative route in the respirometer line the dissolved-oxygen concentration in the direct line (and hence reservoir C)
708 R. W. EDWARDS AND M. A. LEARNER
can be recorded and at the same time a similar flow of water can be maintained through the respirometer route so that animals may be kept under controlled oxygen and flow conditions throughout the experiment.
The proportions of air and nitrogen in the gas mixture are controlled by the needle valves Q. Pressure-reducing valves P maintain a gas supply at constant pressure to the needle valves, and flow meters R measure the gas flows. The two gas streams are mixed in the chamber S before passing through a diffuser T in the reservoir. Provision is made for drawing off water samples from the reservoir for the analysis of oxygen concentration by the Winkler method by a siphon tube V.
Height of mercury
Apparatus containing mercury
Fig. i. General diagram of polarographic respirometer. Items drawn in dotted lines are attached to the outside of the constant-temperature bath.
Polarographic analysis of dissolved-oxygen concentrations. A wide-bore dropping-mercury electrode was used, similar to that described by Briggs, Dyke & Knowles (1958) with a mercury pool reference electrode. The mercury drop rate was con-trolled by the height of the mercury reservoir L above the electrode tip (24 cm.) and two lengths of capillary tubing, 60 cm. of 0-2 mm. bore (M) and about 40 cm. of O'8mm. bore (N).* The dropping-mercury electrode was kept at 1-65 V.
negative with respect to the mercury pool. The system operates on the second oxygen plateau (Kolthoff & Lingane, 1952). In initial experiments slow current drifts were caused by the deposition of calcium carbonate on the tip of the dropping-mercury electrode. Addition of 3 p.p.m. (as P) of sodium hexa-meta-phosphate to the water prevented this and high stability, lasting several days, was achieved. The water used in the experiments was unchlorinated tap water with a total hardness of about 290 p.p.m. (as CaCO3). Fig. za shows a typical calibration curve for the
apparatus; unlike those of Berg (1953), Mann (1958), and others, this is not quite linear. Fig. zb shows polarograms of the second oxygen plateau from which this calibration curve was constructed. The dissolved-oxygen concentrations were calculated from the saturation values of Truesdale, Downing & Lowden (1955) and the partial pressure of gases in the gas mixture, and were checked by Winkler analysis of bottle samples from the reservoir C. Unless different potential differences had been applied at different dissolved-oxygen concentrations, a truly linear rela-tion between current and oxygen concentrarela-tion could not have been achieved. The electrode system was not temperature-compensated and all experiments were conducted at 200 C. ( ± o - i ° C ) . Unlike the systems of Bielawski (1959)
40
30
S
n u
(a)
x Chart reading • Mlcroammeter
reading
2 4 6 8 Dissolved oxygen (p.p.m.)
1-2 1-4 1-6 1-8 Applied potential (V.)
[image:4.451.65.385.312.452.2]2-0
Fig. 2. Calibration graph and polarograms of polarographic respirometer.
and Mann (1958), the current readings were independent of flow between 60 and 170 ml./hr. The position of the dropping-mercury electrode and the design of the electrode chamber are important in determining the dependency of current readings on flow rates. All experiments were conducted at flows of 100-130 ml./hr.
710 R. W. EDWARDS AND M. A. LEARNER
Procedure. Animals were placed in the respirometer and water was passed through both direct and respirometer routes at a predetermined rate, the dissolved-oxygen concentration of water in the direct route passing through the electrode chamber being recorded. Tap H was then closed and tap G revolved, allowing water from the respirometer route to pass through the electrode chamber. The dissolved-oxygen concentration in water leaving the respirometer was recorded for at least i hr. and the flow measured. Finally, the stability of the dissolved-oxygen con-centration in the reservoir was checked by returning to the direct route and record-ing the readrecord-ing. This routine was repeated at different dissolved-oxygen levels (see Fig. 4). After the gas mixture had been changed it took about 1 hr. before stable readings were achieved.
RESULTS
Warburg experiments
Fig. 5 shows the logarithmic relation between oxygen consumption per unit weight and wet weight of A. aquaticus at 10 and 200 C. Larger animals were separated into males and females* and certain experiments were conducted with animals which had been starved for 24 hr. Results of analysis of covariance suggest that there is no significant difference in the oxygen consumption between the two sexes or between fed and starved animals (i.e. between centres of gravity of groups shown
Fig. 3. Electrical-circuit diagram of polarographic respirometer.
A1 Ammeter, F.S.D. 3 A.
A 2 Microammeter, F.S.D. 5 11A., resistance approximately 3000 Si. B 12 V. accumulator.
C i 5000 11F. electrolytic condenser. 6 V. working. D.M.E. Wide-bore dropping-mercury electrode.
Hg pool Reference electrode (mercury pool in polarographic cell).
M Microswitch operated by a cam which is driven by a synchronous clock motor. Contacts close for several seconds every 3 min. (Synclock motors from Everett Edgcumbe & Co. Ltd., Colindale Works, London, N.W. 9).
P.P. 12 V. power pack—could be replaced by a standard battery charger capable of delivering about 3 A. at 12 V.
fii ofl, 18 W.
Rz 50 Si, 3 W. (wire-wound). R3 190 fi, J W .
R4 2500 Si, 3 W. (wire-wound).
RC Recorder solenoids for printing and moving chart (chart solenoid operates on release). They are part of REC.
REC Cambridge Model B 'thread recorder' modified by manufacturer to give solenoid-operated print and chart-movement. F.S.D. 5 fiA., resistance approximately 2000 Si. (Cambridge Instrument Co. Ltd.)
RECT Full-wave rectifier, Sentercel type B84-1-1 W. (Standard Telephone and Cables Ltd., Edinburgh Way, Harlow, Essex.).
51 Double-pole on-off toggle switch. 5 2 Double-pole change-over toggle switch. 5 3 Double-pole change-over toggle switch.
T Heavy-duty filament transformer with all secondaries connected in series and capable of delivering 3 A. at 18 V. (Radiospares, 4, Maple Street, London, W. 1).
V Voltmeter, F.S.D. 3 V.
in Fig. 5). Although the relation between size and oxygen consumption is similar for fed and starved animals (P = o-6 at 10° C. and P = 0-9 at 200 C ) , it may be different for the two sexes (P = 0-05 at 10 and 200 C ) . Regression analyses on grouped data gave coefficients of —0-32 ( + 0-03) at io° C. and 0-28 (±0-02) at 20° C. The oxygen consumption per unit weight is proportional to these powers of the wet weight.
A. aquaticus consumes oxygen about 1-5 times as fast at 20° C. as at 10° C. over the size range studied and results suggest that the Q10 value is not dependent upon
size, the difference in regression coefficients being insignificant (P = 0-3).
[image:6.451.108.345.211.617.2]p.p
712 R. W. E D W A R D S A N D M . A. L E A R N E R
The oxygen consumptions of several groups of A. aquaticus were determined at four times the normal amplitude of shaking of the respirometer flasks. The difference between groups was not significant (P > 0-5).
Lang & Ruzickova-Langova (1951) reported a diurnal rhythm in the oxygen consumption of A. aquaticus, throughout the year, the lowest oxygen consumption being recorded around noon. It is not clear whether the animals were exposed to constant or variable illumination, however, and experimental observations were continued for only 9 hr., generally between 9 a.m. and 6 p.m. Fig. 6 summarizes observations made in the present study. At six-hourly intervals groups of males were placed in the dark in respirometer flasks and their oxygen consumptions were measured for 24 hr. The interpretation of these data is difficult, but it seems that there is an initial decline in oxygen consumption during a period of acclimati-zation, and that there is a daily rhythm of small amplitude even under constant environmental conditions, with a minimum oxygen consumption around noon. A more general decline has been reported by Fox & Simmonds (1933). They found that the oxygen consumption on the second day of measurement in a Barcroft respirometer was 93 % of that on the first day. The high initial rate observed in Groups II, III and IV (see Fig. 6) was not observed in Group I. This is probably due to the coincidence in Group I of the acclimatization period (with its high oxygen con-sumption) with a period of minimal daily oxygen consumption. The experiments discussed earlier in the paper correspond to Group I animals in that observations started at 9 a.m. and no systematic fluctuation was observed.
Polarographic experiments
Initial experiments showed that no systematic changes occurred in the oxygen consumption of A. aquaticus for at least 12 hr. in this apparatus under constant conditions. The coefficients of variability between hourly averages over this period were about 7 %. In view of the similarity of the oxygen consumption of males and females described above, sexes were not separated for these experiments; the larger size groups were exclusively male, however. Such a grouping may be criticized on two counts: first, the oxygen consumption of males and females may be differently affected by size, and secondly, the level of oxygen consumption may be different when sexes are grouped. Fig. 7 shows the logarithmic relation between oxygen consumption per unit weight and wet weight of A. aquaticus in air-saturated water at 200 C , data from three areas having been grouped. The oxygen consump-tion per unit weight is proporconsump-tional to -0-22 (±0-07) power of the wet weight. The effect of size on the oxygen consumption is not significantly different from that calculated earlier for the Warburg respirometer (P ~ 0-3); the level of oxygen consumption determined in the polarographic respirometer is, however, signifi-cantly higher (P < o-ooi).
The oxygen consumption is expressed as a percentage of that determined at the beginning of the day in air-saturated water. Values above 100 % were sometimes obtained when animals were returned to air-saturated water at the end of a day's observation.
„,..- D
0 _, <
.' «•••"•••.•..•„.,'•'•••..•.•
0 .
D V
[image:8.451.54.399.146.314.2]—10
Fig. 4. Typical recorder chart showing oxygen consumption of A. meridianus at 20° C. at three oxygen concentrations (recordings were made every 3 min.). Flows at these oxygen levels were not identical and therefore the oxygen consumption is not directly proportional to the fall in oxygen concentration as it passes through the respirometer. Direct route = D. Respirometer route = R.
a.
I i
u
600 400 200 100 80 60 _ — -_- 0 4 (a
A . A
0-8
I 1 1
•
o »
1
a
ca I • 8 Fed Unfed
0 0 ^ < 1 i • 0 •»
• °
1 % m a Unsexed A 0-6 a.I i
3 ? 200 100 80 60( b ) .
— 2 4 • ^ I 6 10 •
0 m
8 20 _V 40 O 1
4 6 10 20 Wet weight (mg.)
40
[image:8.451.78.376.385.593.2]R. W. E D W A R D S A N D M . A. L E A R N E R
A close inspection of charts (Fig. 4) reveals differences in the variability of the dissolved-oxygen concentration of the effluent from the respirometer at different oxygen levels. At high dissolved-oxygen concentrations the concentration in the effluent is variable and would be even more so were it not for mixing in the tubing and electrode chamber. At low oxygen concentrations the effluent concentration is
200
100
200
V
0 0.2 0 a. 200
100
X
o
100
IV (5)
III (S)
I (4)
I (6)
J II I I I I I
300
200
100
0 ~
300 -£
200 S
100
i
300
200
100
200
100 a. e
09.00 15.00 21.00 03.00 09.00 15.00 21.00 12.00 18.00 24.00 06.00 12.00 18.00 24.00
[image:9.451.94.362.157.457.2]Time (G.M.T.)
Fig. 6. Oxygen consumption of A. aquaticus at 2O° C. over 24 hr. Figures in parentheses indicate the number of groups for which the average oxygen consumption has been taken.
A. aquaticus ° River Hiz
Q River Ivel Sewage effluent
channel A. meridianus x
4 6 8 10
Wet weight (mg.) 20 40
[image:9.451.83.369.501.609.2]relatively constant. It seems likely that the greater variability in oxygen consump-tion is due to periods of locomotory activity. In the confined space of the respiro-meter, movement by one animal tends to disturb others and promote a more general activity, resulting in a period of high oxygen consumption. Variations in the oxygen consumption of trout observed by Job (1955) were shown to be caused by irregular swimming activity. At low oxygen concentrations locomotion is reduced and pleopod movement becomes more regular. The effect of dissolved oxygen concentration on pleopod movement has been studied by Fox & Johnson (1934).
120
•c-100
„ S 80
00 0)
I f
6 0
S I * M c «
[image:10.451.70.385.196.382.2]0 Q. 0
| - 5 120 1*5 100 1 S 80
A. aquaticus,
R. Ivel
X «
O-S
A. aquaticus,
sewage effluent channel
1 2 0 r
100
80
60
40
20 I 10 0
120
100
80
60
40
20
A. aquaticus, R. Hiz
10
A. meridianus,
Leicestershire pond
8 10
Dissolved oxygen concentration (p.p.m.) 10
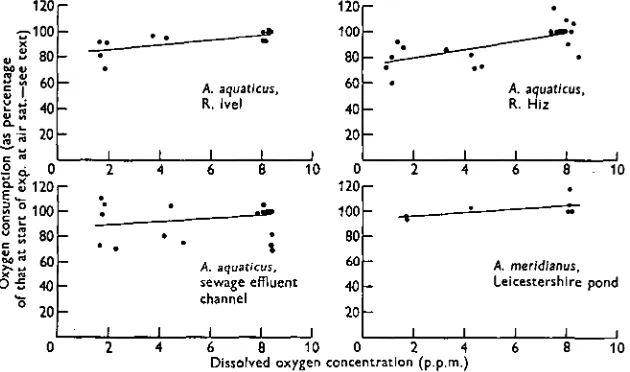
Fig. 8. Oxygen consumption of A. aqnaticus and A. meridianus from different habitats at different dissolved-oxygen concentrations.
DISCUSSION
Fig. 9 shows data on the oxygen consumption of Asellus species collected from various sources. Fox & Simmonds (1933) reported differences in the oxygen con-sumption of anaesthetized A. aquaticus from a fast- and a slow-flowing stream. All the streams from which animals were collected for the present study were slow-flowing, with velocities generally less than 1 ft./sec. Other habitat differences, for example, dissolved-oxygen levels and degree of pollution, did not influence oxygen consumption.
Sprague (in preparation) showed that A. intermedius respires at similar rates at 10 and 200 C. in a Warburg respirometer after acclimatization to these temperatures for one week. In the present study, A. aquaticus respires 1-5 times as fast at 20 as at io° C. after temperature acclimatization for only 1 day.
716 R. W. EDWARDS AND M. A. LEARNER
Allee (1929) measured the oxygen consumption of A. communis males in bottles, analysing oxygen concentration by the Winkler method. His data have been grouped and plotted in Fig. 9. A. communis clearly reaches a much greater size than the other species discussed, but assuming that its oxygen consumption/size relationship is comparable, its oxygen consumption is very similar.
600 500 .2 2" 400
!tl
30°
1 S200
' 1 0 0
• 8 0
60
20°P(£)
20°W(E) 23° W(W) ^ ° ^ W ^" 'n t e r f n e <"u s ^ 20° P(£) A. mend/anus
10° B(F) Swift
"M0°W(S) A. intermediut
10°6(F)Slow
I I I I I08
0-2 0-4 0 6 1 2 4 6 8 1 0 Wet weight (mg.)
12°X(A) A. communis #
J I I I I |__ 60 80100 200
20 40
Fig. 9. Log oxygen consumption per unit weight plotted against log wet weight for species of Asellus, collected from various sources (Allee, 1929, (A); Fox and Simmonds, 1933, (F); Sprague, in preparation, (S); Will, 1952, (W) and present authors (is1)). The respirometers referred to in the figure are Warburg, W; Barcroft, B; Polarographic, P; and Bottle, X (see text). Data refer to A. aquaticus wherever species are not given.
The differences between the oxygen consumption as measured in the polaro-graphic and Warburg respirometers are probably associated with intensities of activity under rather different experimental conditions. Although sexes were not separated in the polarographic respirometer experiments it seems unlikely that the grouping could account for this difference, which extends over the whole size range; in both series the larger size-groups were exclusively male. Animals moved freely in both respirometers and neither gives a measure of the 'basal metabolic rate'. A comparative analysis of activity in these respirometers has not been attempted in the present study.
The oxygen consumptions of A. meridianus and A. aquaticus are very similar at 200 C. and both species behave similarly in low oxygen concentrations. It would be rash to assume, from these experiments, that the distribution of these species is not influenced by the oxygen conditions of their habitats. The effect of oxygen concentration on activity, growth, reproduction, etc., would need to be studied before any ecological generalization could be made concerning the influence of oxygen concentration on distribution.
pattern have been described more fully for Chironomous plumosus (Walshe, 1950), where the proportion of time spent in feeding decreases and that spent in respiratory irrigation increases below 3 p.p.m. Similar changes in ventilation activity have also been described for Phryganea grandis (Van Dam, 1938). The assumption that an ' independent' type of oxygen consumption is favourable to an organism (Berg & Ockelmann, 1959) or implies maintenance of full metabolic function is invalid wherever such changes in activity pattern take place that the 'scope for activity' (Fry, 1947) decreases. Animals with such a behaviour pattern can survive only relatively short periods of exposure to low oxygen concentrations unless they can also withstand longer periods of starvation. In the case of A. aquaticus, Warburg measurements suggest that the oxygen consumption was not reduced after starva-tion for 24 hr. Sprague (in preparastarva-tion) has shown that A. intermedius can withstand oxygen concentrations as low as 0-3 p.p.m. for about 7 days at 200 C. when no food is available.
SUMMARY
1. The oxygen-consumption rates of Asellus aquaticus (males and females) have been measured at 10 and 200 C. using a constant-volume respirometer, and the effect of starvation for 24 hr. investigated. The oxygen consumption is approxi-mately proportional to the 0*7 power of the wet weight. The rate of oxygen con-sumption at 200 C. is greater than at io° C. by a factor of 1-5.
2. The oxygen-consumption rates of A. aquaticus and A. meridianus have been measured at 200 C. in a flowing-water respirometer employing a polarographic technique for the measurement of dissolved-oxygen concentrations. The oxygen consumptions of A. aquaticus and A. meridianus are similar and decrease by 15-20% when the dissolved-oxygen concentration falls from 8-3 to 1-5 p.p.m.
3. The oxygen consumption of A. aquaticus is between 35 and 75 % higher in the polarographic respirometer than in the constant-volume respirometer.
We wish to thank Prof. H. P. Moon (Leicester University) for his interest and help in supplying A. meridianus and Dr J. B. Sprague (Fisheries Research Board of Canada) for his unpublished data on the oxygen consumption of A. intermedius. Mr G. Knowles, Mr R. Briggs and Mr W. H. Mason provided much help and advice in the construction of the polarographic respirometer.
This paper is published by permission of the Department of Scientific and Industrial Research.
REFERENCES
ALLEE, W. C. (1929). Studies in animal aggregations: natural aggregations of the isopod Asellus
aquaticus. Ecology, 10, 14-36.
ALLAN, I. R. H., HERBERT, D. W. M. & ALABASTER, J. S. (1958). A field and laboratory investigation
of fish in a sewage effluent. Fish. Invest., Lond., Ser. I, 6, no. 2, 76 pp.
BERG, K. (1953). The problem of respiratory acclimatization. Hydrobiologia, 5, 331-50.
BERG, K. & OCKELMANN, K. W. (1959). The respiration of freshwater snails. J. Exp. Biol. 36, 690-708.
7i 8 R. W. EDWARDS AND M. A. LEARNER
BRIGGS, R., DYKE, G. V. & KNOWLES, G. (1958). Use of the wide-bore dropping-mercury electrode
for long-period recording of concentration of dissolved oxygen. Analyst, 83, 304-11.
DEPARTMENT OF SCIENTIFIC AND INDUSTRIAL RESBARCH (i960). Water Pollution Research 1959.
London: H.M. Stationery Office.
EDWARDS, R. W. (1958). The relation of oxygen consumption to body size and to temperature in the larvae of Chironomus riparius Meigen. J. Exp. Biol. 35, 383-95.
Fox, H. M. & JOHNSON, M. L. (1934). The control of respiratory movements in Crustacea by oxygen and carbon dioxide. J. Exp. Biol. xx, 1-10.
Fox, H. M. & SIMMONDS, B. G. (1933). Metabolic rates of aquatic arthropods from different habitats.
J. Exp. Biol. io, 67-74.
FRY, F. E. J. (1947). Effects of the environment on animal activity. Univ. Toronto Biol. Series no. 55; Publ. Ont. Fish. Res. Lab. no. 68, 1-62.
GAMESON, A. L. H. & GRIFFITH, S. D. (1959). Six months' oxygen records for a polluted stream.
Wat. Waste Treatm.J. 7, 198-201.
JOB, S. V. (1955). The oxygen consumption of Salvelinus fontinalis. Univ. Toronto Biol. Series no. 61; Publ. Ont. Fish. Res. Lab. no. 73, 1-39.
KOLTHOFF, I. M. & LINGANE, J. J. (1952). Polarography, vol. 2, 2nd ed., 553 pp. New York: Interscience.
LANG, J. & RUZICKOVA-LANGOVA, M. (1951). Periodicity in oxygen consumption oiAsellus aquaticus.
Mim. Soc. zool. Tchicosl. 15, 89-98.
MANN, K. H. (1958). Seasonal variation in the respiratory acclimatization of the leech Erpobdella
testacea (Sav.). J. Exp. Biol. 35, 314-23. SPRAGUE, J. B. (In preparation.)
TRUESDALE, G. A., DOWNING, A. L. & LOWDEN, G. F. (1955). The solubility of oxygen in pure water and sea water. J. Appl. Chem. 5, 53-62.
VAN DAM, L. (1938). On the utilization of oxygen and regulation of breathing in some aquatic animals. Drukkerij Volharding, Groningen, 143 pp.
WALSHE, B. M. (1950). The function of haemoglobin in Chironomus plumosus under natural conditions.
J. Exp. Biol. 27,