Open-Source Hardware Is a Low-Cost Alternative for
Scientific Instrumentation and Research
Daniel K. Fisher1, Peter J. Gould2
1USDA Agricultural Research Service, Stoneville, USA 2US Forest Service, Pacific Northwest Research Station, Olympia, USA
Email: daniel.fisher@ars.usda.gov, pgould@fs.fed.us
Received January 29, 2012; revised February 28, 2012; accepted March 9, 2012
ABSTRACT
Scientific research requires the collection of data in order to study, monitor, analyze, describe, or understand a particular process or event. Data collection efforts are often a compromise: manual measurements can be time-consuming and labor-intensive, resulting in data being collected at a low frequency, while automating the data-collection process can reduce labor requirements and increase the frequency of measurements, but at the cost of added expense of electronic data-collecting instrumentation. Rapid advances in electronic technologies have resulted in a variety of new and inex-pensive sensing, monitoring, and control capabilities which offer opportunities for implementation in agricultural and natural-resource research applications. An Open Source Hardware project called Arduino consists of a programmable microcontroller development platform, expansion capability through add-on boards, and a programming development environment for creating custom microcontroller software. All circuit-board and electronic component specifications, as well as the programming software, are open-source and freely available for anyone to use or modify. Inexpensive sen-sors and the Arduino development platform were used to develop several inexpensive, automated sensing and datalog-ging systems for use in agricultural and natural-resources related research projects. Systems were developed and im-plemented to monitor soil-moisture status of field crops for irrigation scheduling and crop-water use studies, to measure daily evaporation-pan water levels for quantifying evaporative demand, and to monitor environmental parameters under forested conditions. These studies demonstrate the usefulness of automated measurements, and offer guidance for other researchers in developing inexpensive sensing and monitoring systems to further their research.
Keywords: Open-Source Hardware; Arduino; Microcontrollers; Sensors; Datalogger
1. Introduction
Scientific research requires the collection of data in order to study, monitor, analyze, describe, or understand a par-ticular process or event. Data collection efforts are often a compromise, however, between the amount and type of measurements needed and the resources available to col- lect them. Manual measurements can be time-consuming and labor-intensive, resulting in data being collected at a low frequency, with long time intervals between mea- surements. If outdoor field research is involved, collec-tion intervals can be irregular when labor is unavailable, on weekends or when other duties take priority for exam- ple, or when inclement weather does not permit visits to the field. Automating the data-collection process can re- duce labor requirements and greatly increase the frequen- cy and regularity of measurements, but at the cost of added expense of electronic data-collecting instrumentation.
A vast number of electronic solutions are available for automated sensing, monitoring, and collecting informa- tion, but several problems exist which can limit their
periment, multiple sites and replicated treatments may be needed to satisfy observational and statistical require-ments, which can quickly become cost-prohibitive.
Rapid advances in electronic technologies have re-sulted in a variety of new and inexpensive sensing, moni- toring, and control capabilities. These rapidly evolving technologies provide researchers and practitioners with access to low-cost, solid-state sensors and programmable microcontroller-based circuits. Microcontrollers can be thought of as small, low-power, low-cost computers pac- kaged within a single chip. The microcontroller runs a program that is created and uploaded by the user to oper-ate different components within a circuit. The user can modify the program and change the function of the cir-cuit without changing the circir-cuit physically. Many types of sensors and auxiliary components, such as memory chips, clocks, and communications devices, are available which interface directly with microcontrollers, simplify-ing circuit designs and puttsimplify-ing electronic design within reach of people with limited electronics background and knowledge. A number of microcontroller-based devices have been described in which the specific requirements of a research project dictated the development of cus-tomized monitoring systems with unique capabilities [1-5].
A further advancement in microcontroller-based sens-ing and monitorsens-ing relates not specifically to the design and development of the electronics and physical compo-nents, but to the idea of making the designs and devel-opment efforts freely available to all in order to facilitate and expand the adoption of the technologies. The rapid rise of the internet and accessibility of computer re-sources led to the concept of Open Source Software as a means to provide free and transparent access to computer code so that individuals could review, modify, improve, and distribute computer software (Open Source Initiative, http://www.opensource.org). In recent years, a similar effort was undertaken to enable the free and open sharing of hardware designs and projects so that, by sharing and collaborating with others who have similar interests and needs, innovation could occur more quickly, improve-ments could be suggested and incorporated, and more users could access the final product.
One such Open Source Hardware project resulted in the creation of a microcontroller-based development plat-form called Arduino [6]. The Arduino hardware consists of a programmable microcontroller mounted on a circuit board which provides convenient access to the micro-controller input/output pins and connectivity to a per-sonal computer for programming and user interaction. The circuit board has a standardized size and physical configuration so that any Arduino-compatible boards can be interchanged. Standardized add-on boards (called shields) plug into the Arduino circuit board, and are used
to expand the capabilities of the main board. The micro-controller is programmed via the Arduino Integrated Development Environment (IDE), in which the user cre-ates the program instructions to operate the troller and then downloads the program to the microcon-troller. As an open-source hardware project, all circuit- board and electronic component specifications, as well as the IDE software, are freely available for anyone to use or modify. As a result, private manufacturers all around the world produce and offer inexpensive, standardized Arduino-compatible hardware with an extensive supply of features and capabilities. Researchers have begun to develop and implement devices based on the Arduino platform for a variety of applications [7-12], with ease of use, low cost, and standardized components and pro-gramming language cited as reasons for choosing the Arduino platform.
The objective of this paper is to introduce researchers and practitioners to potential applications of the open- source Arduino platform for implementation in research and monitoring applications. Specifically, we 1) describe the Arduino microcontroller development platform, 2) discuss examples of sensing and auxiliary circuit com-ponents available, and 3) demonstrate several datalog- ging devices developed for use in agricultural and natu- ral-resources research.
2. Components
2.1. Arduino Microcontroller Development Platform
have a USB-serial converter chip and use a standard USB-USB cable, while other boards, to simplify design and lower cost, do not incorporate the USB-serial chip. A special cable, which contains the USB-serial chip and creates a virtual serial port, must be used.
The Arduino board is designed to allow expansion through the connection of auxiliary boards or shields. The shields connect via mating pins which are arranged in the same physical configuration as the Arduino board, and simply plug onto the headers on the top of the Ar- duino board. The shields are then controlled by the Ar- duino microcontroller and program, which access the shields’ pins through the Arduino pins. Programming libraries allow users to quickly integrate new devices and sensors into projects without needing to write extensive new program routines.
2.2. Software
The software environment for programming and inter-acting with the Arduino board is available for download and installation for several computer operating systems (GNU/Linux, Mac OS X, and Windows). Using the IDE, the user writes programs in a language based on C++. The IDE then compiles and error-checks the program, and downloads the compiled routine to the microcontrol-ler. A terminal window is available for outputting text and data from the Arduino board to the computer monitor and for interacting with the microcontroller.
As an open-source project, the Arduino benefits from the collective efforts and expertise of developers from around the world. Programming libraries, which contain routines to simplify programming and incorporate ad- vanced features, sample code, and complete programs are available to download, use, and modify as needed. The IDE, libraries, and sample code can be accessed via the Arduino project website [6].
2.3. Communications
The Arduino development platform provides several me- thods of communicating with external components, sen-sors, and computers. In addition to built-in A/D conver- ters and timers for measuring analog voltage signals, several standardized communications protocols are avail- able for interfacing digital components and sensors.
The Inter-Integrated Circuit, also called I2C or I2C, protocol developed by Philips Semiconductor, is a two- wire serial transfer protocol designed for communica- tions between integrated-circuit chips and microcontrol- lers. Two IO pins on the Arduino’s ATmega328 micro-controller are designated for I2C communication. Each I2C device has its own unique identification number and address, allowing multiple devices to be connected to the same I2C pins. The microcontroller initiates
communica-tion with a device by first sending the address of the de-vice and then reading data from or writing data to the device. Identification numbers are unique to each type of component (memory chip, clock, temperature sensor, etc.) while addresses are either preset by the manufacturer or specified by the user through different hardware con-figurations.
The Dallas 1-Wire protocol, developed by Dallas Se- miconductor, uses a single IO pin for communication and, optionally, to power the external 1-Wire device. Like I2C, multiple devices can be connected to a single 1-Wire pin, and are called by the microcontroller using the device’s unique address.
The Serial Peripheral Interface, or SPI, is a four-wire system developed by Motorola and provides a serial data link that operates in full duplex mode. SPI devices com-municate in master/slave mode using three IO pins, with the master device, the microcontroller, initiating commu-nications with the slave, a sensor or other device. The microcontroller uses an additional IO pin for each device to select and communicate with a particular device.
RS-232 is the standard serial communication protocol that was widely used to communicate between personal computers and peripherals before the advent of the uni-versal serial bus (USB). RS-232 uses two communication lines (Rx to receive, Tx to transmit), and is the protocol used by the Arduino’ microcontroller to interface with a computer for programming. Since few modern computers contain an RS-232 port, a virtual serial port must be cre-ated. While some Arduino boards have a USB-to-serial converter chip on-board, many boards do not in order to reduce cost and power consumption. A special USB- serial cable which contains the converter chip, such as the FTDI Cable (www.makerspace.com), interfaces to the computer’s USB hub and creates a virtual serial port.
2.4. Sensors
A large number of sensors are available to monitor and measure many types of environmental parameters or physical processes. The rapid advances and usage of programmable microcontrollers have brought an increase in the availability and ease of use of sensing devices de- signed to interface with microcontrollers. The sensors operate at low voltages, and output signals compatible with microcontrollers, including analog voltages, varying frequencies, and a selection of digital communications protocols.
While the number of parameters sensed, and the num-ber of sensors available, is vast, a few examples are pre-sented and discussed in the following subsections.
2.4.1. Temperature
mul-titude of disciplines is temperature. A variety of tem-perature sensors is available using several different mea- surement technologies. While thermistors, which are sen- sors whose electrical resistance changes in response to temperature, are still in use, alternate electronic sensors are available which are designed to interface easily with microcontrollers and computers.
Analog temperature sensors, such as the LM35 (Na-tional Semiconductor, Santa Clara, CA USA) and TMP36 (Analog Devices, Inc, Norwood, MA USA), are designed to output a voltage signal proportional to tem- perature. The microcontroller supplies an excitation vol- tage to the sensor, and then measures the sensor’s out- put voltage with an on-board A/D converter. The micro- controller program calculates temperature using a cali-bration developed by the sensor manufacturer. The LM35 sensor, for example, provides a linear response with a calibration of 10 mV/C: temperature (˚C), is there- fore calculated by dividing the output voltage, in mV, by 10. Analog sensors are usually very inexpensive and easy to work with, requiring only a simple voltage measure-ment and calibration equation to determine temperature. The microcontroller must have an A/D converter, and a stable reference voltage, which some may not have, re-quiring the addition of external components and cir- cuitry.
Digital temperature sensors are designed to provide a calibrated and voltage-converted output which can be read directly as a temperature value. These sensors do not require a voltage measurement to be made, allowing the use of microcontrollers which do not have A/D con- verters. Digital sensors interface with the microcontroller through one of several communications protocols, such as I2C, 1-Wire, and SPI, with transfer of information accomplished via the microcontroller program. Digital sensors often have the feature of a unique identification number, allowing multiple sensors to be connected to the same IO pins on the microcontroller, thus not using addi-tional pins. In contrast, since each analog sensor would require its own A/D input pin, multiple analog sensors could quickly fill available A/D converter pins.
For making non-contact temperature measurements, infrared thermometer (IRT) sensors are available which are inexpensive and easy to interface. The MLX90614 (Melexis SA, Ieper, Belgium) series of IRTs communi-cate with the microcontroller via the I2C protocol. Ex-perience using these sensors to monitor crop canopy temperature [5] has shown them to work well in a harsh agricultural environment, operate for extended periods under battery power, and provide accurate temperature measurements.
2.4.2. Soil-Water Status
In many agricultural, natural-resource, and water-mana-
gement disciplines, water availability and moisture status are of great importance. The amount of water available in the soil profile for extraction by growing plants can be measured with a water-content sensor. A water potential sensor provides a measure of how tightly the water is held to the soil particles and how much energy must be expended to extract the water by the plant roots. This can be related to the availability of water to the plant.
Many of the currently available water-content sensors rely on a measure of the capacitance of the soil-water environment. Dielectric properties of the soil-water sys- tem vary weakly with soil properties, such as mineral composition, bulk density, and organic-matter content, but are strongly influenced by water content [13]. Water- content sensors, such as the EC-5 and EC-20 (Decagon Devices, Pullman, WA USA), and VG400 (Vegetronix, Bluffdale, UT USA), consist of a capacitive-sensing element and on-board electronic circuitry. When powered by the microcontroller, the sensors return a voltage signal proportional to the water content in the soil. Measuring the voltage with the microcontroller’s A/D converter and applying a calibration equation in the microcontroller program results in a water-content value, expressed in units of volume of water/volume of soil. Sensor manu- facturers may provide calibration equations for limited soil types and other porous media, such as potting soil or greenhouse media, but the user often must develop a calibration, or at least verify the manufacturer's, under his specific soil conditions to obtain accurate water-con- tent measurements.
Water-potential sensors are usually designed to act as variable resistors, in which the electrical resistance of the sensor varies in response to its water content. The sensor is composed of a porous matrix, and water can move into and out of the matrix in response to the matric potential of the soil. As the water content in the porous matrix changes with matric potential, the electrical resistance also changes. A calibration equation then converts resis-tance to matric or water potential, expressed in units of kiloPascals (kPa).
a calibration equation.
2.4.3. Distance/Height
Distance measurements are common in robotic and in- dustrial/manufacturing environments to determine dis- tance from a moving vehicle for obstacle avoidance, de- tect presence or absence of material, and ensure proper placement of a component. In research applications, dis- tance measurements can be used to determine properties such as plant height and canopy width, depth of water in canals, and fluid levels in tanks.
Distance measurements are commonly made using two sensing technologies, ultrasonic and infrared. Ultrasonic sensors often consist of two transducers, one which emits a pulse of high-frequency sound waves, and a second one to detect the sound after reflecting off a nearby surface. Distance is determined by measuring the length of time between sending the pulse and receiving the reflection, or echo, and converting this to a distance based on the speed of sound. Ultrasonic sensors, such as the SRF series (Devantech Ltd., Norfolk, UK) and the PING (Parallax Inc., Rocklin, CA USA) interface with a microcontroller via one or two digital IO pins. The microcontroller is programmed to initiate a pulse, then starts an internal timer and counts the number of microseconds until an echo signal is detected, and calculates the distance based on this time interval. Sensors are available with varying fields of view to enable sensing over wider or narrower regions.
Infrared sensors operate by emitting a beam of light and detecting the reflected beam, after hitting an obstacle, with a light sensor. The reflected beam returns at a slight angle from the emitted beam, and the angle of the two beams is dependent on the distance of the obstacle from the sensor. The reflected beam strikes the light sensor at some point, and is read by an on-board microcontroller which is programmed to output an analog voltage in proportion to distance. The analog voltage is input to the Arduino microcontroller’s A/D converter and converted to distance with a calibration equation supplied by the manufacturer. Infrared sensors such as the GP2 series (Sharp Electronics Corporation, Mahwah, NJ USA) offer a variety of operating ranges.
2.4.4. Pressure
Maintaining proper pressure and measuring the existing pressure are important in many processes and environ-ments. Atmospheric air pressure is an important meteoro- logical parameter, for example, and liquid pressure can be used to determine fluid depth based on hydrostatic pressure relationships.
Many pressure sensing devices are available and range from simple sensing elements to amplified, calibrated, and temperature-compensated sensors. Sensing
configu-rations typically consist of piezoresistive elements and a silicon diaphragm arranged in a Wheatstone-bridge cir- cuit. A change in pressure causes the diaphragm to flex and changes the resistance values of the piezoresistive elements. Since changes are very small, the change in electrical output of the Wheatstone bridge is also small, requiring accurate voltage-measuring circuitry. Ampli-fying the output signal allows the signal to be measured with an A/D converter on the Arduino. Temperature changes can also affect the piezoresistive elements, re-sulting in the need for temperature compensation under conditions of large temperature swings. A range of pres-sure sensors, including the non-temperature-compensated 24PC, temperature-compensated 26PC, and fully com-pensated and amplified 40PC series (Honeywell Sensing and Control, Golden Valley, MN USA) can be interfaced and read with the Arduino’s microcontroller.
2.4.5. Resolution of Analog Sensor Measurements
Analog sensors output a voltage signal which is con-verted into a numerical value by an A/D converter. The A/D converter is characterized by a known, reference voltage, which determines the range of acceptable vol- tage signals, and the number of digital values, or bits, into which the voltage range is divided. The Arduino’s microcontroller contains a 10-bit A/D converter, meaning that the voltage range is divided into 210, or 1024, divi-sions. To measure a sensor’s voltage signal, the A/D converter compares the voltage level to the reference voltage, and returns a proportional digital value in the range of 0 to 1023.
The A/D converter characteristics determine the lution and accuracy of voltage measurements. The reso-lution, or smallest change in voltage that the A/D con-verter can detect, is dependent on the A/D concon-verter’s number of bits and the reference voltage. The Arduino’s microcontroller has a built-in 1.1 V reference, which provides the A/D converter with a resolution of 1.1 V/ 1024 bits, or 0.00107 V/bit. The microcontroller’s 5-V power supply voltage can also be used as a reference, resulting in an A/D conversion resolution of 0.00488 V/bit.
Resolution can be increased or decreased by changing the number of A/D conversion bits. External A/D con- verter chips are available which have higher-bit resolu- tions and can be easily interfaced with the Arduino. The MCP3424 (Microchip Technology Inc., Chandler, AZ USA) is an A/D converter chip which can read four input voltage signals with 18-bit (262,144 divisions) resolution. With a 5-V reference voltage, this would provide an A/D resolution of 0.0000191 V/bit. The MCP3424 communi-cates with the microcontroller using I2C.
sensor that outputs a voltage signal between 0 and 5 V over a temperature range of 0 to 65 C. The signal, there-fore, changes by 65 C/5 V, or 13 C/V. Using the micro-controller’s built-in 10-bit A/D converter and a 5-V re- ference, with a resolution of 0.00488 V/bit, the resolution of temperature measurements would be 13 C/V*0.00488 V/bit, or 0.06 C/bit, which would be acceptable for most applications.
The resolution of a signal from a non-amplified pres-sure sensor, with an output of 0 to 10 mV over a range of 0 to 100 kPa, would have a measurement resolution of 100 kPa/0.01 V*0.00488 V/bit, or 48.8 kPa/bit. This would be unacceptable, providing only three ments (0, 48.8, and 97.6 kPa) over the entire measure-ment range. Using the MCP3424 external A/D converter, with 18-bit resolution, would greatly improve voltage- measurement capability and provide a pressure-mea- surement resolution of 0.038 kPa/bit.
2.5. Time-Keeping
In many data-collection efforts, proper timing of meas-urements and date- and time-stamping of sensor data are required. The microcontroller on the Arduino board has a very accurate 16 MHz oscillator and the ability to meas-ure time increments with microsecond accuracy, but is not designed to provide real time (hours, minutes) and date information. If electrical power to the microcontrol-ler is lost, the oscillator and microcontrolmicrocontrol-ler program cease to function, and any timing information is also lost.
External real-time clock (RTC) chips are used to pro-vide time-keeping functions, with dedicated built-in or added backup batteries to retain accurate time informa-tion. RTCs such as the DS1307 and DS1337 (Maxim Integrated Products, Inc., Sunnyvale, CA USA) interface with the microcontroller using the I2C protocol, while others, such as the MCP795 (Microchip Technology Inc., Chandler, AZ USA) communicate via SPI. Simple rou-tines in the microcontroller program access the RTCs to set or read time and date information, which can then be used to trigger sensor measurements at regular time in-tervals or record timing information of events.
2.6. Data Storage
Data collection often involves long-term, automated sto- rage of sensor measurements. While the Arduino’s mi- crocontroller has extensive memory available for pro- gram storage, non-volatile data-storage capability is lim-ited. On-board memory consists of 1 kb (1000 bytes), so a maximum of 1000 data values could be stored and re-tained if battery power were interrupted. To expand the storage capacity, external storage must be added.
External memory chips are available with varying amounts of non-volatile memory. The 24LC family of
memory chips (Microchip Technology Inc., Chandler, AZ USA), for example, are available in capacities from 16 bytes to 65,356 KB. These chips communicate via the I2C protocol and have individual identification numbers so that multiple chips could be connected to increase storage amounts considerably.
For permanent or large-capacity storage, add-on boards are available which provide data storage to stan-dard SD memory cards (Adafruit Industries, New York, NY USA) or microSD memory cards (Sparkfun Elec-tronics, Boulder, CO USA). Memory cards are com-monly available with storage capacities from 1 gigabyte (GB) to several GB, are inexpensive, and can be easily interfaced with the Arduino hardware. Since the memory cards can be read with a computer, data can be trans- ferred quickly and easily between datalogger and com- puter. Software libraries have been written to provide all memory card reading, writing, and data-access functions, enabling rapid incorporation of memory-card storage into a datalogging project.
3. Sensing Applications
To illustrate how the Arduino platform can be used to develop and implement an inexpensive, automated data collection and monitoring program, several examples are presented. These examples include a brief description of the circuitry and details of the project implementation. Microcontroller programs are not included but are freely available by contacting the authors.
3.1. Soil-Moisture Monitoring Datalogger
Monitoring moisture status of the soil profile is useful in scheduling irrigations and monitoring the movement or availability of water in the soil profile. Sensors are in-stalled in the soil profile at various depths within a crop’s root zone and are monitored periodically. A datalogger was designed to record measurements from three soil- moisture sensors at one-hour intervals, and store the mea- surements, along with the date and time, to a microSD memory card.
3.1.1. Hardware
Corp., Santa Clara, CA USA) and capacitors were added to convert the unregulated battery voltage to a stable 5-V source to power the microcontroller. A trace on the printed circuit board, which powered the board from the USB connection, was then cut so that the only power source was the AA battery pack. The modified Diavolino microcontroller board is shown in Figure 1.
The microSD shield (Sparkfun Electronics, Boulder, CO USA) consists of a microSD-card holder, with on-board voltage-level shifter to supply the proper volt-age levels for reading from and writing to a microSD card, and a prototyping area to incorporate additional circuitry into the shield. The microSD shield was de-signed to be powered from the microcontroller board’s power supply, thus the microSD card and voltage-level shifter would always be powered and continuously drawing current. The shield was modified for bat-tery-powered operation by rerouting the power supply for the microSD card and voltage-level shifter to one of the microcontroller’s digital pins so that the components could be turned on and off as needed. A microSD card (Samsung) with a 2 gigabyte storage capacity was then inserted into the microSD card holder.
A circuit was designed and added to the microSD shield’s prototyping area to measure the output from three soil-moisture sensors. A DS1337 real-time clock/ calendar chip provides date and time information for the microcontroller to make sensor readings at regular time intervals and to date- and time-stamp sensor data stored to the microSD card. A 32.768 kHz crystal oscillator provides an accurate timing signal for the DS1337, and a 3.3-V lithium coin cell battery powers the clock chip. The DS1337 interfaces with the microcontroller via the I2C protocol.
The soil-moisture sensors consist of three Watermark 200SS matric-potential sensors whose electrical resis-tance varies with moisture content. A circuit was de-signed in which each sensor, which acts as a variable
analog-to-digital converter pins
digital input/output pins
microcontroller
voltage regulator
computer serial interface
[image:7.595.307.532.328.474.2]external battery connection
Figure 1. Modified Diavolino Arduino-compatible micro-controller board.
resistor, forms one leg of a half bridge, or voltage divider. The half bridge is connected to two digital pins on the microcontroller, and each voltage-divider output is con-nected to an A/D pin. A photograph of the completed circuit, mounted on the microSD shield, is shown in
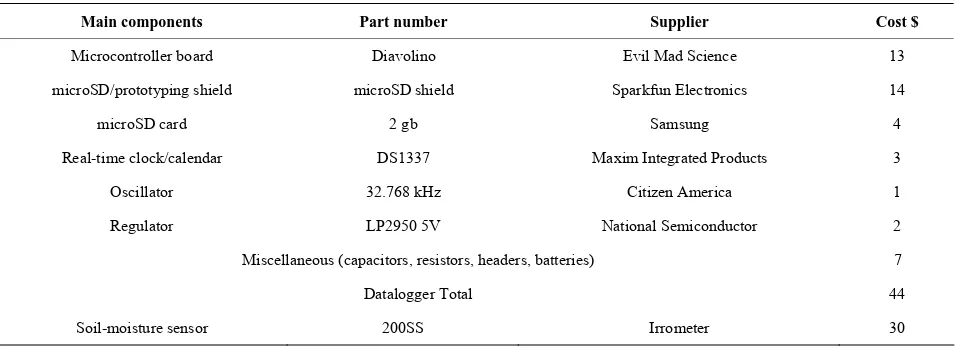
Figure 2, and a schematic of the circuit is shown in Fig- ure 3. A list of materials, with sources and approximate
cost (small-quantity retail price, in the United States, US dollars, 2011), is provided in Table 1.
3.1.2. Software
Using the Arduino IDE installed on a personal computer, a microcontroller program, called a sketch on the Ar- duino platform, was written to read the real-time clock, make soil-moisture sensor measurements, and store the time and sensor data to a microSD card. Communication between the computer and microcontroller board requires an RS-232 serial connection, which was accomplished via an FTDI USB-serial cable, which interfaces to the
clock battery
analog-to-digital converter pins
half bridge circuit
real-time clock
rerouted power supply connection
microSD card
[image:7.595.309.534.517.718.2]Figure 2. Modified microSD shield with circuit components installed.
[image:7.595.67.276.558.707.2]Table 1. List of materials for soil-moisture sensor datalogger.
Main components Part number Supplier Cost $
Microcontroller board Diavolino Evil Mad Science 13
m d m d S
Real- dar DS1337 Maxim I roducts
32.768 kHz
Na or
Miscellaneous (cap ors, headers, batteries)
Soil-moisture sensor Irrometer
icroSD/prototyping shiel icroSD shiel parkfun Electronics 14
microSD card 2 gb Samsung 4
time clock/calen ntegrated P 3
Oscillator Citizen America 1
Regulator LP2950 5V tional Semiconduct 2
acitors, resist 7
Datalogger Total 44
200SS 30
omputer’s USB hub and creates a virtual serial port. e
Watermark 200SS sensor [14-16], and several calibration
ed d to monitor soil-moisture status in experi-c
To enable long-term, battery-powered operation of th datalogger, the microcontroller was programmed to spend most of its time in a low-power, sleep mode. Peri- odically, the microcontroller would wake up and read the current time from the real-time clock. If it was time to take a measurement, the microcontroller would power the measurement circuit, otherwise it would go back to sleep. At one-hour intervals, the measurement circuit on the microSD shield was enabled, and the soil-moisture sensors were read and data stored to the microSD card.
To properly read a Watermark 200SS sensor, an alter-nating current source is recommended in order to avoid polarizing the sensor with a prolonged direct-current ex- citation, which can influence sensor measurements and degrade the sensor over time. The microcontroller can only supply a direct-current excitation, however, so a pseudo-alternating current source was created by rapidly switching the polarity of the direct-current voltage sent to power the sensor, and the sensors were then read under each polarity. Digital pin 6 was first set high (a voltage level of 5 V) and pin 5 was set low (a voltage level of 0 V) so that current flowed through the half bridge in one direction (see Figure 3). The output voltage, Vout, be-
tween the 10 kohm resister, R, and the Watermark sensor, Rwm, was measured with an A/D converter, and the sensor resistance was calculated using the voltage-di- vider relationship, Vout = R/(Rwm + R)*5 V. The polar-ity of the half bridge was then switched by setting pin 5 high and pin 6 low, so that current flowed in the opposite direction, and output voltage was again measured and sensor resistance calculated. This was repeated five times, and an average resistance was calculated.
To arrive at the sensor’s final output, namely the ma- tric-potential of the soil, in kPa, a calibration equation is required to convert sensor resistance to matric potential. Much work has been done calibrating and verifying the
equations have been proposed. The equation of Shock et
al. [16] was chosen, written as SWP = (4.093 + 3.213
Rwm)/(1 − 0.009733*Rwm − 0.01205*Tsoil), where
SWP is the soil-water potential (kPa), Rwm is the sensor resistance (ohms), and Tsoil is the soil temperature (˚C). While sensor performance has been shown to vary slightly with temperature, and a temperature-correction factor is included in the calibration equation, soil perature was not measured and, instead, a constant tem-perature of 25 ˚C was used. To improve accuracy of sen-sor readings, a soil-temperature sensen-sor could be added to the datalogger circuit and actual temperature measure-ments input to the calibration equation.
Following sensor measurements, power was sent to the microSD card circuit, and the data were stored to the microSD card. Data were stored as ASCII text, separated by spaces, in a plain text file, and consisted of six values; a datalogger board identification number, date (month/ day/year), time of day (hour), sensor #1 reading (kPa), sensor #2 reading (kPa), and sensor #3 reading (kPa). The microcontroller then turned all power off to the mi- croSD shield and returned to low-power, sleep mode.
3.1.3. Data
Thirty soil-moisture sensor dataloggers were construct and deploye
datalogger was turned on, and collected sensor data at one-hour intervals throughout the entire growing season. Periodically, each site was visited to download data from the microSD card to a portable tablet computer. The text data files were then returned to the office, uploaded to a desktop computer, and input to a spreadsheet for analysis and viewing. Typical data, from one site over a seven- week period following planting in 2011, are shown in
Figure 4.
Soil-water potential values near 0 indicate very moist soil conditions, with soil-water levels decreasing as the w
plications; anals, for ater-potential values become more negative. Hourly data from the three sensors were input to a spreadsheet, and the average of the three sensor readings was calcu-lated. The average values were used to determine when an irrigation was needed. When the average values reached a threshold value of −50 kPa, an irrigation was scheduled. In Figure 4, soil-water levels decreased early
in the season as the growing crop extracted water until rainfall occurred on 6/21, rewetting the soil. As soil wa- ter was used by the crop, the levels dropped until reach-ing −50 kPa, and two irrigations were required. Evident in the data are differences in water use with depth in the soil profile. Early in the season, changes in water poten-tial were slower at 30 cm than at 15 cm, and much slower at 60 cm, suggesting more active roots in the shallower depths. As the season progressed, water-use rates in-creased at the 30-cm depth, and later at the 60-cm depth, suggesting increases in root activity and water extraction.
3.2. Ultrasonic Water-Level Datalogger
Fluid levels are measured in a variety of ap fuel tanks, water reservoirs, and irrigation c
example. Evaporation pans are used to estimate the evaporative demands of the atmosphere in order to de-termine crop water use and soil evaporation rates for in-put in water-balance and evapotranspiration studies, and to assist in irrigation scheduling. A datalogger was de-
-100 -90 -80 -70 -60 -50 -40 -30 -20 -10
0 100
veloped to automate the measurement of the depth of water in an evaporation pan usi
6/1 6/11 6/21 7/1 7/11 7/21
Date (mon/day)
S
o
il
W
a
te
r Po
te
n
tia
l
(
k
Pa
)
0 10 20 30 40 50 60 70 80 90
R
a
in
fa
ll,
i
rri
g
a
ti
o
n
(i
n
)
rainfall 15 cm 30 cm 60 cm average
[image:9.595.61.285.561.706.2]irrigate irrigate
Figure 4. Data collected with the soil-moisture datalogger for a seven-week period in 2011.
ardware
er-level datalogger circuit is based on
rogram for the ultrasonic water- ng an ultrasonic distance sensor.
3.2.1. H
The ultrasonic wat
that of the soil-moisture datalogger, and incorporates many of the same circuit components. The same Ardino- compatible microcontroller board was used, and was modified in the same manner to supply a stable power source and enable battery-powered operation. The same microSD/prototyping shield and real-time clock compo-nents were also used. A schematic of the ultrasonic water level datalogger is shown in Figure 5.
An ultrasonic distance sensor, model SRF-04 (Devan-tech Ltd., Norfolk, UK), interfaces with the microcon-troller via three digital pins; power, trigger, and echo pulse. The sensor consists of two ultrasonic transducers, one to send an ultrasonic pulse and one to receive the pulse’s echo. To make a measurement, power is supplied to the sensor, and a measurement is initiated by sending a brief signal to the trigger pin, which causes an ultrasonic pulse to be sent. The microcontroller then begins moni-toring the echo pulse pin, and measures the length of time it takes to receive an echo signal.
A temperature sensor was added to measure the air temperature of the environment. The LM35 analog tem-perature sensor outputs an analog-voltage signal in pro-portion to its temperature. The signal is input to one of the microcontroller’s A/D converters, and a calibration equation supplied by the manufacturer is used to convert the voltage signal to temperature.
3.2.2. Software
The microcontroller p
level datalogger used many of the same routines written for the soil-moisture datalogger. The microcontroller
wakes periodically from a low-power sleep mode to read the real-time clock and determine if it is time to take measurements. If so, measurements are taken and re- corded, otherwise, the microcontroller goes back to sleep.
At each measurement interval, the microcontroller turns on the temperature sensor and makes an air tem-perature measurement. The ultrasonic sensor is then powered, a trigger signal is sent, and the time for an echo signal to return is measured. The time for the echo to return is then used to calculate the distance, based on the speed of sound, between the sensor and the surface upon which the ultrasonic pulse impacted. The speed of sound, however, is strongly dependent on the air temperature, and slightly affected by humidity [17], and can be cor-rected to improve the accuracy of distance measurement u
re
uler into the evaporation pan an
ith one
ul-trasonic sensor datalogger are shown in 6. Data
mperature, raw depth (before correcting the
around 6:00, as the sun rose and air temperature
in-d by
s sing the relationship v = 331 m/s + 0.6 m/s/C*T, where v is the speed of sound (m/s) and T is the air temperature (˚C). To make a distance measurement, the air tempera-ture measurement is first used to correct the speed of sound value. The speed of sound and the time taken to
turn the pulse echo are then used to calculate the dis- tance from the sensor to the reflecting surface. This dis- tance is then subtracted from the distance of the sensor to the bottom of the evaporation pan, measured previously when installing the ultrasonic sensor, to determine the depth of water in the pan.
Following air temperature and water level measure-ments, the data, microcontroller board identification number, and date and time are written to the microSD card. The microcontroller then turns off power to the circuit and returns to low-power, sleep mode.
3.2.3. Data
Two ultrasonic water-level dataloggers were constructed and installed in summer 2011 and operated for a three- month period. The sensors were installed on an evapora-tion pan approximately 300 mm above the bottom of the pan. Sensor measurements were recorded at one-hour intervals, and the data were periodically downloaded from the microSD card during periodic site visits. During site visits, manual measurements of the water level were made by inserting a steel r
d reading the depth of water. The depth of water in the pan varied between 70 and 195 mm, decreasing as water evaporated in response to the environmental demand and increasing due to rainfall and periodic manual refilling.
Data collected during a four-day period w
Figure
include air te
speed of sound for temperature) and temperature-cor- rected depth, and manual measurements of the water lev-els. Large increases in apparent depth of water can be seen in the raw sensor readings each morning beginning
creased rapidly. The raw depths also continued to appear to decrease after sunset, when evaporation would be ex- pected to cease. Correcting the speed of sound for air temperature mostly eliminates these errors, resulting in expected changes in water level, decreasing during day- light hours and minimal changes during nighttime. An increase in depth can be seen in response to a manual addition of water to the pan.
Accuracy of ultrasonic measurements was determine comparing water levels measured with the ultrasonic sensors to those measured manually. Manual depth measurements were made 18 times, at varying times throughout the three-month period and at varying times of day. Manually measured water levels ranged from 75 to 158 mm. Comparison of measurements from the two ultrasonic sensors is shown in Figure 7, and indicates a
very good agreement with the manual measurements, with a standard error of measurements of approximately 2 mm.
3.3. Environmental Datalogger
An Arduino-based datalogger can also be built using a
70 75 80 85 90 95
0 6 12 18 0 6 12 18 0 6 12 18 0 6 12 18 0
W a te r l e v e l ( mm) 0 5 10 15 20 25 30 35 A ir t em p er at ur e (C ) 100 40
depth (raw) depth (corrected) manual depth air temperature
one ultrasonic wa- eriod.
[image:10.595.311.535.366.518.2]Time of day (hr)
Figure 6. Hourly data collected with ter-level datalogger during a four-day p
y = 1.01x + 0.06 r2 = 0.995
SE = 2.2 mm
y = 0.97x + 4.73 r2 = 0.996 SE = 1.8 mm
60 80 100 120 140 160
60 80 100 120 140 160
Water level - ultrasonic sensor (mm)
Wa te r l e v e l m a n ua l m e as ur em en t ( m m ) sensor #1 sensor #2
1 : 1
Figure 7. Comparison of manual versus automated meas urements for two ultrasonic water-level dataloggers.
[image:10.595.312.535.561.707.2]-custom printed circuit board (PCB) rather than starting with a commercially available board. A datalogger was esigned and fabricated to collect environmental data in a forested setting. The datalogger was de signed to ac- commodate a variety of sensor types, but was primarily intended to measure soil moisture and air temperature. Rather than developing a system around a commercially available Arduino board, a custom PCB was created which contained the Arduino microcontroller and other components.
3.3.1. Custom Circuit-Board Design
Creating a new PCB requires some additional skills but is a viable approach for many users. The main advantages of creating a custom PCB include the selection of spe
r projects include a real-time clock/ r more light-emit-
n circuit components ar
(www.seeedstudio.com/propagate). Dataloggers were assembled by soldering circuit components to the h each datalogger requiring
approxi-ol to transfer measurements to the microcon- tro
y
d- cific components for the particular project, the creation of a board with a custom layout or size/configuration, and the reduction, in some cases, in total cost.
The minimum components needed to create an Ar- duino board include the ATmega328 microcontroller, a resonator (self-contained oscillator circuit), a reset button, a voltage regulator, connectors for a battery pack, com-puter interface, and a few resistors and capacitors. AT-mega328 microcontroller chips are available prepro-grammed with the Arduino-system’s bootloader, ena-bling the use of the Arduino IDE to create and upload programs to the microcontroller. Additional components for most datalogge
calendar, a memory device, and one o
ting diodes (LEDs) to indicate the operational status of the datalogger. All of these components are readily avai- lable as through-hole components which can be soldered to the PCB with a soldering iron.
The process of creating a custom circuit board begins with circuit and PCB design. Several software packages are available, some in freely available, open-source ver-sions, to design the electrical schematic and then lay out the circuit on a PCB. A graphical user interface simpli-fies design, and the software creates a set of files in for-mats standardized for PCB manufacturing, which can then be transmitted to a PCB manufacturer. The manu-facturer produces the bare PCB, and the final board is constructed by soldering the components to the PCB by hand.
3.3.2. Hardware
A board was designed using the freely available De- sign-Spark PCB software (www.designspark.com/pcb). The circuit was designed using a graphical schematic view, in which connections betwee
e created but the actual size, shape, and layout of the components are unimportant. This schematic is then transferred to a printed circuit board layout, where the software suggests the physical layout and connecting
traces of the components. The user is able to modify the layout as desired, to create a PCB that is easy to assem-ble, or which fits certain dimensional or other con-straints.
The resulting board design, with dimensions of ap-proximately 60 × 90 mm, was then electronically trans-mitted for fabrication using SeeedStudio’s Fusion PCB service
custom PCB, wit
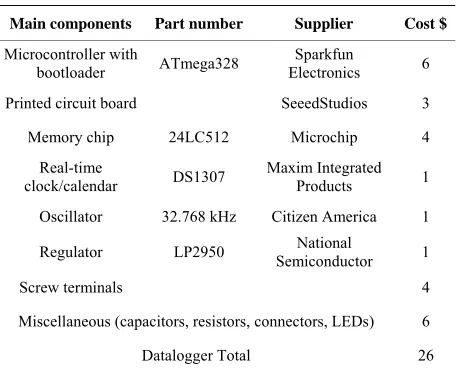
[image:11.595.310.540.549.735.2]mately 20 minutes to complete. A list, with approximate cost of components, excluding sensors, is provided in
Table 2. The original design layout is shown in Figure 8(a), with resulting bare printed circuit board and
fin-ished datalogger board shown in Figures 8(b) and 8(c),
respectively.
Dataloggers were deployed in the field along with air-temperature and soil-moisture sensors. Air tempera-ture was measured using a DS18B20 12-bit digital tem-perature sensor (Maxim Integrated Products, Inc., Sunny- vale, CA USA). The sensor uses the 1-Wire communica- tion protoc
ller, and contains an internal 18-bit A/D converter which provides temperature measurements with a resolu- tion of 0.06 C. Soil-moisture measurements were made using an EC-20 capacitive sensor. The microcontroller provided an excitation voltage to power the sensor via a digital IO pin, and measured the analog output voltage with a built-in A/D converter.
A battery pack consisting of 5 AA alkaline batteries enabled long-term remote operation by ensuring ade-quate voltage as the batteries discharged.
4. Summar
Advances in electronic technologies, microcontrollers, and sensors offer researchers a variety of new and inex-
Table 2. List of materials for environmental datalogger.
Main components Part number Supplier Cost $
Microcontroller with
bootloader ATmega328
Sparkfun Electronics 6
Printed circuit board SeeedStudios 3
Memory chip 24LC512 Microchip 4
Real-time
clock/calendar DS1307
Maxim Integrated
Products 1
Oscillator 32.768 kHz Citizen America 1
Regulator LP2950 SemicondNational uctor 1
Screw terminals 4
s, resistors, connectors, LEDs) 6 Miscellaneous (capacitor
clock battery
voltage regulator real-time clock
memory chip
screw terminals microcontroller (a)
(b)
[image:12.595.135.463.82.520.2](c)
Figure 8. Arduino-based datalogger fabricated on a custom printed circuit board: top, (a) circuit-board layout; middle; (b) bare circuit board; bottom; (c) completed board with components installed.
pensive sensing, monitoring, and control capabilities The concept of open-source hardware, in which hardware designs, software programs, and development efforts are made freely available to all, help facilitate and expand the adoption of these capabilities. The open-source hard- ware Arduino development platform has great potential for implementation in scientific research applications,
the United States Department of Agriculture, and does not imply approval of the product to the exclusion of others that may be available.
REFERENCES
tions,” Applied Engineering in Agriculture, Vol. 20, No. 1, 2004, pp. 119-128.
-Cost Microcontroller Circuit,” Applied
and can empower researchers with flexible, inexpensive ools for expanding their data-collection, automation, and
[1] F. H. Moody, J. B. Wilkerson, W . Hart and N. D. Sewell, “A Digital Event Recorder for Mapping Field Opera
. E
t
control capabilities.
5. Disclaimer
Mention of a trade name, proprietary product, or specific equipment does not constitute a guarantee or warranty by
[2] K. A. Noordin, C. C. Onn and M. F. Ismail, “A Low-Cost Microcontroller-Based Weather Monitoring System,” CMU Journal, Vol. 5, No. 1, 2006, pp. 33-39.
Engineering in Agriculture, Vol. 23, No. 4, 2007, pp
.05.009
. 493-500.
[4] G. Vellidis, M. Tucker, C. Perry, C. Kvien and C. Bed-narz, “A Real-Time Wireless Smart Sensor Array for Scheduling Irrigation,” Computers and Electronics in Ag-riculture, Vol. 61, No. 1, 2008, pp. 44-50.
doi:10.1016/j.compag.2007
[5] D. K. Fisher and H. Kebede, “A Low-Cost
Microcontrol-ler-Based Sys perature and
Wa-ter Status,” C ics in Agriculture
tem to Monitor Crop Tem
omputers and Electron ,
Vol. 74, No. 1, 2010, pp. 168-173. doi:10.1016/j.compag.2010.07.006
[6] Arduino, “An Open-Source Electronics Prototyping Plat-form,” 2012. http://www.arduino.cc
ies and
Applica-, Vol. 7Applica-, No. 2Applica-, 2008Applica-, pp. 12-15.
[7] D. Bri, H. Coll, M. Garcia and J. Lloret, “A Multisensor Proposal for Wireless Sensor Networks,” 2nd Interna-tional Conference on Sensor Technolog
tions, Cap Esterel, 25-31 August 2008, pp. 270-275. [8] L. Buechley and M. Eisenberg, “The LilyPad Arduino:
Toward Wearable Engineering for Everyone,” Pervasive Computing
doi:10.1109/MPRV.2008.38
[9] J. Zhang, S. K. Ong and A. Y. C. Nee, “Design and De-velopment of a Navigation Assistance System for Visu-ally Impaired Individuals,” Proceedings of th
national Convention on Rehabilita
e 3rd Inte tion Engineering &
ensors, Sensor Net-, BrisbaneNet-, 7-10 De-
r-Assistive Technology, Singapore, 22-26 April 2009. [10] N. W. Bergmann, M. Wallace and E. Calia, “Low Cost
Prototyping System for Sensor Networks,” 6th Interna-tional Conference on Intelligent S
works and Information Processing
cember 2010, pp. 19-24.
doi:10.1109/ISSNIP.2010.5706802
[11] D. Gordon, M. Beigl and M. A. Neumann, “Dinam: A Wireless Sensor Network Concept and Platform for Rapid Development,” 7th International Conference on Net-worked Sensing Systems (INSS), Kassel, 15-18 June 2010, pp. 57-60. doi:10.1109/INSS.2010.5573290
[12] J. Sarik and I. Kymissis, “Lab Kits Using the Arduino Prototyping Platform,” Frontiers in Education Confer-ence, Washington DC, 27-30 October 2010, pp. 1-5. [13] A. M. Thomas, “In situ Measurement of Moistur
and Similar Substances by ‘Fringe’ C
e in Soil apacitance,” Journal of Scientific Instrumentation, Vol. 43, No. 1, 1966, pp. 21-27. doi:10.1088/0950-7671/43/1/306
[14] S. J. Thomson and C. F. Armstrong, “Calibration of the Watermark Model 200 Soil Moisture Sensor,” Applied Engineering in Agriculture, Vol. 3, No. 2, 1987, pp. 186-
age-189.
[15] E. P. Eldredge, C. C. Shock and T. D. Stieber, “Calibra-tion of Granular Matrix Sensors for Irriga“Calibra-tion Man ment,” Agronomy Journal, Vol. 85, No. 6, 1993, pp. 1228-1232.doi:10.2134/agronj1993.00021962008500060 025x
[16] C. C. Shock, J. M. Barnum and M. Seddigh, “Calibration
. Bohn, “Environmental Effects on the Speed of of Watermark Soil Moisture Sensors for Irrigation Man-agement,” Proceedings of the International Irrigation Show, San Diego, 1-3 November 1998, pp. 139-146. [17] D. A