ISSN Online: 2156-8561 ISSN Print: 2156-8553
DOI: 10.4236/as.2018.98070 Aug. 27, 2018 1007 Agricultural Sciences
Competitiveness and Profitability of
Intercropping Sunflower with Peanut under
Different Irrigation Water Levels and
Potassium Fertilizer Rates
Samiha A. Ouda
1*, Yaser A. A. Hefny
2, Tamer I. Abdel-Wahab
2, Sherif I. Abdel-Wahab
21Water Requirements and Field Irrigation Research Department, Soils, Water and Environment Research Institute, Agricultural
Research Center, Giza, Egypt
2Crop Intensification Research Department, Field Crops Research Institute, Agricultural Research Center, Giza, Egypt
Abstract
A two-year study was carried out at Ismailia Agricultural Research Station, Egypt during 2016 and 2017 summer seasons to evaluate competitive effects of intercropping sunflower and peanut under different drip irrigation water amounts and K fertilizer rates for increasing farmer profitability. Three irri-gation amounts (70%, 100% and 120% ETo), three K fertilizer levels (57, 86 and 114 K2O kg/ha) and four intercropping patterns of sunflower and peanut
(different spatial arrangements) were implemented. The experimental design was strip split plot with three replications. The results showed that there were no significant differences between 100% and 120% ETo on most of yield traits of the intercrops. The highest K fertilizer level had the highest values of most yield traits of the intercrops. The highest values of peanut and sunflower traits were obtained from intercropping sunflower with peanut, where peanut seeds were sown on both sides of all the raised beds, sunflower seeds were sown on one row above the raised beds and the following bed was left without intercropping (P1). Thus, to attain the highest yield of intercrops and water equivalent ratio (WER), the lowest competitive pressure and the highest farmer profitability, 120% ETo, 114 K2O kg/ha and P1 intercropping pattern
should be implemented. This research found that the result of competitive-ness was consistent with the result of profitability.
Keywords
Drip Irrigation, K Fertilizer, Intercropping Sunflower with Peanut, WER, Competitive Relationships, Profitability
How to cite this paper: Ouda, S.A., Hefny, Y.A.A., Abdel-Wahab, T.I. and Abdel-Wa- hab, S.I. (2018) Competitiveness and Prof-itability of Intercropping Sunflower with Peanut under Different Irrigation Water Levels and Potassium Fertilizer Rates. Agricultural Sciences, 9, 1007-1031. https://doi.org/10.4236/as.2018.98070
Received: July 9, 2018 Accepted: August 24, 2018 Published: August 27, 2018
Copyright © 2018 by authors and Scientific Research Publishing Inc. This work is licensed under the Creative Commons Attribution International License (CC BY 4.0).
http://creativecommons.org/licenses/by/4.0/
DOI: 10.4236/as.2018.98070 1008 Agricultural Sciences
1. Introduction
In general, nutrients, water and light are the three main classes of resources that limit plant growth and are considered to be resources for which individual plants compete. The effects of competition are widespread and easily observed in different intercropping patterns. The complexity of resource competition is de-rived not only from the variability of resource limitation in space and time and among species, but also from the complexity of the resources themselves. Nutri-ents, water and light each differ in their properties, which generates unique ways that plants compete for these resources [1].
In Egypt, drip irrigation management could be an important factor to mini-mize the inter-specific competition between oil crops for basic growth resources under sandy soil conditions. Drip irrigation markedly increased yield and shortened the growing season over sprinkler or furrow irrigation and offered the best method of supplying uniform soil moisture in the root zone throughout the growing season [2]. Moreover, the application of modern irrigation techniques such as drip irrigation is one of the measures utilized for competent use of water
[3]. Thus, the majority of the research has focused on inter-specific competition between oil seed crops using drip irrigation management under sandy soil con-ditions, especially Abdel Wahab et al. [4] reported that new reclaimed areas are mostly sandy soils and usually deficient in organic matter and poor in plant nu-trients. However, the amount and timing of irrigation are two important aspects which determine the efficient use of applied water and maximizing crop yields
[5]. No doubt that limited supply of water necessitates a shift in the production objectives from attainment of potential yield per unit of land to potential yield per unit of water [6].
However, increased intensity of cropping and introduction of high yielding varieties have resulted in considerable drain of potassium (K) and crops are be-coming responsive to K fertilization [7]. It has long been recognized that inter-cropping can give yield advantages over sole inter-cropping. Intercrop productivity depends on the genetic constitution of component crops, growth environment (atmospheric and soil) and agronomic manipulation of micro-environment [8]. Intercropping sunflower (Helianthus annuus L.) in peanut (Arachis hypogaea
L.) cultivated area can increase oil seed production per unit area and time [9]. Accordingly, K application not only increased sunflower yield [10] but also is the second most absorbed nutrient by the peanut crop [11]. K plays an important role in development, nutrition and production [12], especially Almeida et al.
[13] expected that the peanut respond expressively to application of K fertilizer in soils with low K contents.
DOI: 10.4236/as.2018.98070 1009 Agricultural Sciences
of the recommended plant density resulted in the highest peanut yield [15]. Little research has been done on the use of surface drip irrigation with in-creasing K fertilization to increase sunflower and peanut yields unit area−1, and
low information is available to transfer this technology for Egyptian farmers under sandy soil conditions. Thus, the objective of this investigation was to evaluate competitive effects of intercropping sunflower and peanut under dif-ferent drip irrigation water amounts and K fertilizer rates for increasing farmer profitability.
2. Materials and Methods
A two-year study was carried out at Ismailia Agricultural Research Station, Agricultural Research Centre, Ismailia governorate (Lat. 30˚35'30''N, Long. 32˚14'50''E, 10 m above the sea level), Egypt during 2016 and 2017 summer sea-sons. The objective of this investigation was to evaluate competitive effects of intercropping sunflower and peanut under different drip irrigation water amounts and K fertilizer rates for increasing farmer profitability. The treatments were the combinations of three irrigation water levels (70%, 100% and 120% ETo), three K fertilizer rates (K1 = 57, K2 = 86 and K3 = 114 K2O kg/ha) and
four sunflower and peanut intercropping patterns in a strip split plot design with three replications. The studied intercropping patterns are as follows:
− P1 = Peanut seeds were sown on both sides of all the raised beds (1.2 m width) with 20 cm planting spacing (two plants together). Sunflower seeds were sown on one row above the one of the raised beds, with 20 cm planting spacing (one plant) and the following bed was left without intercropping sunflower seeds.
− P2 = Peanut seeds were sown on both sides of all the raised beds (1.2 m width) with 20 cm planting spacing (two plants together). Sunflower seeds were sown on one row above the one of the raised beds, with 40 cm planting spacing (two plants together) on all the raised beds.
− P3 = Peanut seeds were sown on one row on the side of all the ridges (0.6 m width) with 20 cm planting spacing (two plants together). Sunflower seeds were sown on the other side of the ridge, with 20 cm planting spacing (one plant) and the following three ridges were left without intercropping sun-flower seeds.
− P4 = Peanut seeds were sown on one row on the side of all the ridges (0.6 m width) with 20 cm planting spacing (two plants together). Sunflower seeds were sown on the other side of the ridge, with 40 cm planting spacing (one plant) and the following ridge was left without intercropping sunflower seeds.
− P5 = Sole peanut was sown with 100% of its recommended planting density on ridges (0.6 m width) with 20 cm planting spacing (two plants together). − P6 = Sole sunflower was sown with 100% of its recommended planting
DOI: 10.4236/as.2018.98070 1010 Agricultural Sciences
The yield and its components for each crop were only used to estimate com-parative relationships and did not include in the statistical analysis. The studied sunflower and peanut intercropping patterns were planted with 166,600 and 20,825 plants per hectare, represented 100% and 25% of peanut and sunflower recommended planting densities.
Irrigation water treatments were randomly assigned to the horizontal plots, K fertilizer levels were allocated in vertical plots and intercropping patterns were distributed in sub plots. Plot area was 21.6 m2. Each sub plot consisted of 12
ridges, 3.0 m long and 0.6 m wide or 6 raised beds 3.0 m long and 1.2 m wide. The soil of the experimental area is sandy texture with an average bulk density of 1.67 g/cm3 and is alkaline in reaction with pH value of 8.20. Average soil
elec-trical conductivity in the saturated paste extract, over 0 - 60 cm depth, was about 0.33 dS/m. The electrical conductivity of irrigation water was 0.50 dS/m and pH value was 7.55. Chemical and physical soil analyses were conducted by the stan-dard methods described by Tan (1996). The analysis revealed that available NPK was 10.4, 16.9 and 64.4 ppm in the experimental site.
Wheat was the preceding winter crop in both seasons. Calcium super phos-phate (15.5% P2O5) at rate of 476 kg/ha was applied during soil preparation in
the two summer seasons. Peanut cultivar Ismailia1 semi-erect and sunflower cultivar Sakha 53 were used and sown on May 26th and May 30th at 2016 and
2017 summer seasons, respectively. In the two seasons, peanut seeds were in-oculated by Bradyrhizobium before seeding it.
Nitrogen fertilizer was added for sole peanut at a rate of 83.3 kg N/ha as am-monium nitrate (33.5% N). Furthermore, nitrogen fertilizer was added for sole sunflower at a rate of 142.8 kg N/ha as ammonium nitrate (33.5% N). With re-spect to sunflower intercropped with peanut, nitrogen fertilizer was added at a rate of 120.9 kg N/ha as ammonium nitrate (33.5% N). Calcium sulfate at the rate of 1190 kg/ha was applied for peanut after 35 days from peanut sowing. Recommended cultural practices for growing each crop were implemented as provided by the Egyptian Ministry of Agriculture.
2.1. The Studied Traits
2.1.1. Peanut Studied Traits
At harvest, the following traits were measured on ten bordered plants from each sub plot: numbers of pods and seeds per plant (g) and seed yield per plant (g). Pod yield of peanut per hectare (ton/ha) was recorded on the basis of experi-mental plot area by harvesting all plants of each sub plot.
2.1.2. Sunflower Studied Traits
DOI: 10.4236/as.2018.98070 1011 Agricultural Sciences
2.1.3. Water Relation Measurements
Irrigation water was applied every three days using the drip lateral lines con-nected to the sub-main line. Each lateral line is 20 m long and spaced at 0.7 m on the sub-main and is equipped with build-in emitters of 2 L/h discharge rate spaced at 0.3 m on the lateral lines. A differential pressure tank was connected to the drip irrigation system to inject fertilizer via irrigation water. Evapotranspira-tion values (ETo) were calculated using BISm model [16]. The amounts of ap-plied irrigation water were calculated according to the equation given by Ver-meiren and Jopling [17] as follows:
(
)
ETo I AIW
Ea 1 LR × =
−
where: AIW = depth of applied irrigation water (mm), ETo = reference evapotranspiration (mm/day). I = irrigation intervals (days), Ea = irrigation ap-plication efficiency of drip system (Ea = 90% in the first seasons and 93% in the second season). LR = leaching requirements (10%).
Crop water use was estimated by the method of soil moisture depletion ac-cording to Majumdar [18] as follows:
i 4 i 1
2 1
WCU Bd d
100
θ
θ
− =
−
=
∑
× ×where: WCU = water consumptive use or actual evapotranspiration, ETa (mm), I = number of soil layer, θ2 = soil moisture content after irrigation (%, by mass),
θ1 = soil moisture contents just before irrigation (%, by mass), Bd = soil bulk density (g/cm3), d = depth of soil layer (mm).
Water equivalent ratio was calculated to quantify the amount of water that would be needed in single crops to achieve the same yield as produced with one unit of water in intercrop as stated by [19]:
int,A mono,A int,B mono,B
A B
int mono,A int mono,B
Y Y Y Y
WER WER WER
WU WU WU WU
= + = +
[4]
where: WUint, WUmono,A and WUmono,B = water use efficiency of whole
intercrop-ping system, A and B in monocultures, respectively, Yint, Ymono,A and Yint,B = yield
of whole intercropping system, A and B in monocultures, respectively. If the WER > 1, it suggests that the water utilization of intercropping is higher than that of monoculture. If WER < 1, it shows that water utilization of intercropping is lower than that of monoculture.
2.1.4. Competitive Relationships 1) Land Equivalent Coefficient (LEC)
LEC is a measure of interaction concerned with the strength of relationship
[20]. It is calculated as follows:
a b
LEC L L= ×
where: La = relative yield of crop a (peanut) and Lb = relative yield of crop b
DOI: 10.4236/as.2018.98070 1012 Agricultural Sciences
2) System Productivity Index (SPI) SPI was calculated as [21]:
(
A B)
b aSPI= S L ×L +S
where: SA and LB are the yield of peanut and sunflower in sole cropping, Sa and
Lb are the yield of peanut and sunflower in intercropping.
3) Relative Crowding Coefficient (RCC)
RCC, which estimates the relative dominance of one species over the other in the intercropping system [22], was calculated as follows:
a b
K K K= ×
(
)
a ab ba aa ab ab
K =Y ×Z Y −Y ×Z ;
(
)
b ba ab bb ba ba
K =Y ×Z Y −Y ×Z
where: Yaa = Pure stand yield of crop a (peanut); Ybb = Pure stand yield of crop b
(sunflower); Yab = Intercrop yield of crop a (peanut); Yba = Intercrop yield of
crop b (sunflower); Zab = The respective proportion of crop a in the
intercrop-ping system (peanut); Zba = The respective proportion of crop b in the
inter-cropping system (sunflower). 4) Aggressivity (Agg)
Agg, which represents a simple measure of how much the relative yield in-crease in one crop is greater than the other in an intercropping system [23], was calculated as follows:
(
)
(
)
ab ab aa ab ba bb ba
A =Y Y ×Z − Y Y ×Z ;
(
)
(
)
ba ba bb ba ab aa ab
A =Y Y ×Z − Y Y ×Z 5) Competitive Ratio (CR)
CR is an index which gives a more desirable competitive ability for the crops
[24]. CR gives a better measurement of competitive ability of the crops and also is more advantageous. The CR is calculated according to the following formula:
(
)(
)
a a b ba ab
CR = LER LER Z Z ,
(
)(
)
b b a ab ba
CR = LER LER Z Z
where: where LERa = (Yab/Yaa), LERb = (Yba/Ybb). If CRa < 1, there is negative
benefit and the crop can be grown in association. If CRa > 1, there is negative
benefit. The reverse is true for CRb.
6) Actual Yield Loss (AYL)
The partial actual yield losses, AYLpeanut or AYLsunflower represent the relative
decrease of yield per sowing proportion in intercropping of peanut and sun-flower compared to corresponding yields in sole crops [25]. AYL is calculated according as follows:
(
) (
)
(
) (
)
a b
a ab ab aa aa
b ba ba bb bb
AYL AYL AYL ,
AYL Y Z Y Z 1,
AYL Y Z Y Z 1.
= +
= −
DOI: 10.4236/as.2018.98070 1013 Agricultural Sciences
Positive AYL indicates an intercropping advantage; negative AYL indicates disadvantage in intercropping system.
2.1.5. Intercropping Economic Advantage 1) Monetary Advantage Index (MAI)
MAI suggests that the economic assessment should be in terms of the value of land saved; this could probably be most assessed on the basis of the rentable value of this land. MAI was calculated according to the formula, suggested by
[23]. MAI = [Value of combined intercrops × (LER – 1)]/LER. MAI value indi-cates the profit of the cropping system.
2) Intercropping Advantage (IA)
IA contributing in the intercropping advantage of system [26], IA was calcu-lated as:
a a a
IA =AYL P ,×
b b b
IA =AYL P ,×
where: Pa = price of peanut (454 US$ per ton) and Pb = price of sunflower (188
US$ per ton). The prices of peanut and sunflower were recorded from Bulletin of Statistical Cost Production and Net Return [27].
3) Income Equivalent Ratio (IER)
IER is similar in concept to LER, except that yield is measured in terms of net income, rather than plant product productivity. Because income is a function of both yield and crop price, even if the agronomic response is consistent, IER for intercrops may vary in different years as crop prices fluctuate. IER can be deter-mined for systems involving more than two crops by summing the intercrop to sole crop yield (or net income) ratios of each crop included in the intercropping system. To calculate the IER obtained from intercropping a hectare of land were used. It was calculated by the formula developed by Ghaffarzadeh [28]:
(
ab aa) (
ba bb)
IER= I I + I Iwhere: Iaa = Gross income in component a (peanut) in pure stand, Ibb = Gross
income in component b (sunflower) in pure stand, Iab = Gross income in
com-ponent a (peanut) in mixed stand, Iba = Gross income in component b
(sun-flower) in mixed stand.
2.2. Statistical Analysis
Analysis of variance of the obtained results of each season was performed. The homogeneity test was conducted of error mean squares and accordingly, the combined analysis of the two experimental seasons was carried out. The meas-ured variables were analyzed by ANOVA. Mean comparisons were performed using the least significant differences (L.S.D) test with a significance level of 5%
DOI: 10.4236/as.2018.98070 1014 Agricultural Sciences
3. Results and Discussion
3.1. Yield and Its Attributes
3.1.1. Irrigation Water Levels 1) Peanut Traits
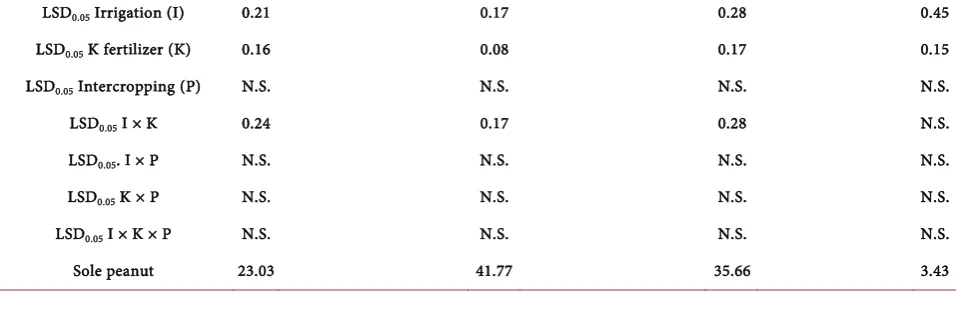
Data in Table 1 show that numbers of pods and seeds plant−1, seed yield
plant−1 and pods yield ha−1 were affected significantly by irrigation water applied
[image:8.595.60.539.572.730.2]levels in the combined data across the two seasons. Irrigation water 120% ETo
Table 1. Effect of irrigation water levels, K fertilizer and intercropping patterns on peanut traits averaged on the two seasons.
Treat Pods plant
−1 (no.) Seeds plant−1 (no.) Seed yield plant−1 (g) Pods yield ha−1 (t) P1 P2 P3 P4 Mean P1 P2 P3 P4 Mean P1 P2 P3 P4 Mean P1 P2 P3 P4 Mean
I1K1 14.53 14.58 14.42 14.41 14.49 35.86 35.81 35.79 35.84 35.83 26.81 26.84 26.80 26.85 26.82 2.52 2.41 2.43 2.38 2.43
I1K2 16.91 16.84 16.98 16.90 16.91 36.12 36.18 36.11 36.18 36.15 28.64 28.61 28.56 28.57 28.59 2.63 2.51 2.55 2.45 2.53
I1K3 18.01 18.62 17.98 17.95 18.14 36.64 36.45 36.60 36.52 36.55 30.39 30.15 30.19 30.40 30.28 2.70 2.61 2.64 2.53 2.62
Mean 16.49 16.68 16.46 16.42 16.51 36.21 36.15 36.17 36.18 36.17 28.61 28.53 28.51 28.61 28.57 2.62 2.51 2.54 2.45 2.53
I2K1 18.73 18.68 18.75 18.64 18.70 39.63 39.63 39.69 39.64 39.64 29.27 29.26 29.22 29.21 29.24 3.19 3.09 3.08 3.07 3.10
I2K2 20.41 20.38 20.43 20.39 20.40 40.84 40.85 40.86 40.70 40.81 32.14 32.16 32.19 32.13 32.15 3.29 3.15 3.19 3.13 3.19
I2K3 21.85 21.77 21.45 21.35 21.61 41.16 41.30 41.37 41.38 41.30 33.82 33.71 33.53 33.62 33.67 3.35 3.22 3.28 3.16 3.25
Mean 20.33 20.28 20.21 20.13 20.24 40.54 40.59 40.64 40.57 40.58 31.74 31.71 31.64 31.65 31.68 3.27 3.15 3.18 3.12 3.18
I3K1 18.23 18.20 18.16 18.24 18.20 39.87 39.63 39.73 39.61 39.71 30.25 30.32 30.20 30.21 30.24 3.22 3.09 3.09 3.04 3.11
I3K2 20.33 20.69 20.40 20.43 20.46 40.95 40.90 40.27 40.50 40.65 32.38 32.21 32.26 32.30 32.29 3.30 3.17 3.26 3.13 3.21
I3K3 21.37 21.32 21.68 21.41 21.45 41.43 41.41 41.31 41.81 41.49 33.44 33.27 33.19 33.23 33.28 3.34 3.22 3.29 3.19 3.26
Mean 19.98 20.07 20.08 20.02 20.04 40.75 40.65 40.44 40.64 40.62 32.02 31.93 31.88 31.91 31.94 3.28 3.16 3.21 3.12 3.19
Ave K1 17.16 17.15 17.11 17.10 17.13 38.45 38.36 38.40 38.36 38.39 28.78 28.81 28.74 28.76 28.77 2.97 2.86 2.86 2.83 2.88
Ave K2 19.22 19.30 19.27 19.24 19.26 39.30 39.31 39.08 39.13 39.20 31.05 30.99 31.00 31.00 31.01 3.07 2.94 3.00 2.90 2.98
Ave K3 20.41 20.57 20.37 20.24 20.40 39.74 39.72 39.76 39.90 39.78 32.55 32.37 32.30 32.42 32.41 3.13 3.01 3.07 2.96 3.04
Ave P 18.93 19.01 18.92 18.86 18.93 39.16 39.13 39.08 39.13 39.13 30.79 30.72 30.68 30.72 30.73 3.06 2.94 2.98 2.89 2.97
LSD0.05 Irrigation (I) 0.21 0.17 0.28 0.45 LSD0.05 K fertilizer (K) 0.16 0.08 0.17 0.15 LSD0.05 Intercropping (P) N.S. N.S. N.S. N.S.
LSD0.05 I × K 0.24 0.17 0.28 N.S.
LSD0.05. I × P N.S. N.S. N.S. N.S.
LSD0.05 K × P N.S. N.S. N.S. N.S.
LSD0.05 I × K × P N.S. N.S. N.S. N.S.
DOI: 10.4236/as.2018.98070 1015 Agricultural Sciences
increased significantly numbers of pods and seeds plant−1, seed yield plant−1, pod
yield ha−1 in comparison with those with applications of 70% and 100% ETo the
combined data across the two seasons. With respect to irrigation water level 70% Eto, numbers of pods and seeds plant−1, seed yield plant−1 and pods yield ha−1
were decreased significantly by 17.61%, 10.95%, 10.55% and 20.68%, respec-tively, in comparison with those with application of 120% ETo in the combined data across the two seasons (Table 1). These results may be due to the lowest ir-rigation water level closed stomata and thereby reduced activity of photosyn-thetic enzymes and photosynthesis process. Similar results were obtained by Rao
et al. [30] who concluded that severe water stress from emergence to maturity resulted in lowering pod yields. It is important to mention that there were no significant differences between two irrigation water levels; 100% and 120% ETo for all the studied peanut traits.
Excessive water can cause excessive vegetative growth and a greater leaf area index, but restrict root growth and development [31].
2) Sunflower Traits
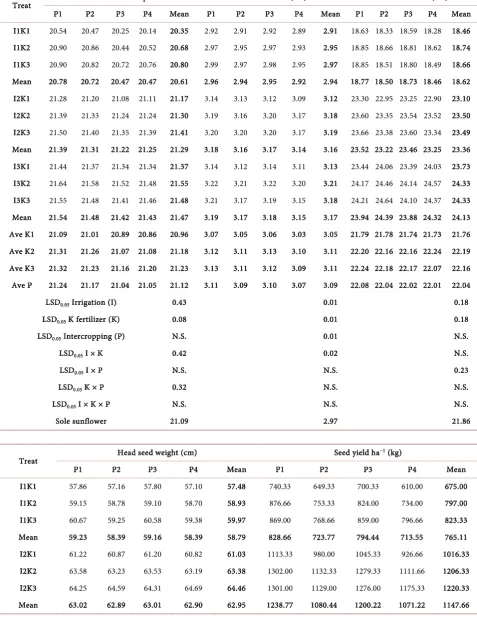
Data in Table 2 show that number of leaves plant−1, stem and head diameters,
head seed weight and seed yield ha−1 were affected significantly by irrigation
wa-ter applied levels in the combined data across the two seasons. Increasing irriga-tion water level from 70% to 120% caused significant increments in number of leaves plant−1, stem and head diameters, head seed weight and seed yield ha−1in
the combined data across the two seasons.
With respect to irrigation water level 70% ETo, number of leaves plant−1, stem
and head diameters, head seed weight and seed yield ha−1 were decreased
sig-nificantly by 4.00%, 7.25%, 22.83%, 8.79% and 34.86%, respectively, in compari-son with those of application 120% ETo in the combined data across the two seasons (Table 2). These results may be due to the lowest irrigation water level diminished plant water contents of sunflower, then leaf water potential, biomass, cell enlargement and growth with closing stomata due to mainly turgor loss [32] [33]. Consequently, the lowest irrigation water level resulted in lessening leaf growth and decreasing relative dry matter portioning into the root and shoot/root ratio [34] which reflected negatively on head seed weight. Sunflower plants that suffered from water deficit in the root zone have small root system and weak shoot growth and this in turn reduce both the vegetative growth and the yield [35].
There were no significant differences between two irrigation water levels; 100% and 120% Eto for number of leaves plant−1 and seed yield ha−1 in the
DOI: 10.4236/as.2018.98070 1016 Agricultural Sciences
Table 2. Effect of irrigation water levels, K fertilizer and intercropping patterns on sunflower traits averaged on the two seasons.
Treat Number of leaves/plant Stem diameter (cm) Head diameter (cm) P1 P2 P3 P4 Mean P1 P2 P3 P4 Mean P1 P2 P3 P4 Mean I1K1 20.54 20.47 20.25 20.14 20.35 2.92 2.91 2.92 2.89 2.91 18.63 18.33 18.59 18.28 18.46 I1K2 20.90 20.86 20.44 20.52 20.68 2.97 2.95 2.97 2.93 2.95 18.85 18.66 18.81 18.62 18.74 I1K3 20.90 20.82 20.72 20.76 20.80 2.99 2.97 2.98 2.95 2.97 18.85 18.51 18.80 18.49 18.66 Mean 20.78 20.72 20.47 20.47 20.61 2.96 2.94 2.95 2.92 2.94 18.77 18.50 18.73 18.46 18.62 I2K1 21.28 21.20 21.08 21.11 21.17 3.14 3.13 3.12 3.09 3.12 23.30 22.95 23.25 22.90 23.10 I2K2 21.39 21.33 21.24 21.24 21.30 3.19 3.16 3.20 3.17 3.18 23.60 23.35 23.54 23.52 23.50 I2K3 21.50 21.40 21.35 21.39 21.41 3.20 3.20 3.20 3.17 3.19 23.66 23.38 23.60 23.34 23.49 Mean 21.39 21.31 21.22 21.25 21.29 3.18 3.16 3.17 3.14 3.16 23.52 23.22 23.46 23.25 23.36 I3K1 21.44 21.37 21.34 21.34 21.37 3.14 3.12 3.14 3.11 3.13 23.44 24.06 23.39 24.03 23.73 I3K2 21.64 21.58 21.52 21.48 21.55 3.22 3.21 3.22 3.20 3.21 24.17 24.46 24.14 24.57 24.33 I3K3 21.55 21.48 21.41 21.46 21.48 3.21 3.17 3.19 3.15 3.18 24.21 24.64 24.10 24.37 24.33 Mean 21.54 21.48 21.42 21.43 21.47 3.19 3.17 3.18 3.15 3.17 23.94 24.39 23.88 24.32 24.13 Ave K1 21.09 21.01 20.89 20.86 20.96 3.07 3.05 3.06 3.03 3.05 21.79 21.78 21.74 21.73 21.76 Ave K2 21.31 21.26 21.07 21.08 21.18 3.12 3.11 3.13 3.10 3.11 22.20 22.16 22.16 22.24 22.19 Ave K3 21.32 21.23 21.16 21.20 21.23 3.13 3.11 3.12 3.09 3.11 22.24 22.18 22.17 22.07 22.16 Ave P 21.24 21.17 21.04 21.05 21.12 3.11 3.09 3.10 3.07 3.09 22.08 22.04 22.02 22.01 22.04
LSD0.05 Irrigation (I) 0.43 0.01 0.18
LSD0.05 K fertilizer (K) 0.08 0.01 0.18 LSD0.05 Intercropping (P) N.S. 0.01 N.S.
LSD0.05 I × K 0.42 0.02 N.S.
LSD0.05 I × P N.S. N.S. 0.23
LSD0.05 K × P 0.32 N.S. N.S.
LSD0.05 I × K × P N.S. N.S. N.S.
Sole sunflower 21.09 2.97 21.86
Treat Head seed weight (cm) Seed yield ha −1 (kg)
DOI: 10.4236/as.2018.98070 1017 Agricultural Sciences
Continued
I3K1 61.67 61.39 61.60 61.66 61.58 1121.66 997.66 1105.00 949.66 1043.50 I3K2 65.14 65.57 65.50 65.51 65.43 1319.33 1151.00 1309.66 1122.33 1225.58 I3K3 66.50 66.35 66.28 66.37 66.38 1334.66 1176.33 1305.66 1203.00 1254.91 Mean 64.43 64.44 64.46 64.51 64.46 1258.55 1108.33 1240.11 1091.66 1174.66 Ave K1 60.25 59.80 60.20 59.86 60.03 991.77 875.66 950.22 828.77 911.61 Ave K2 62.62 62.52 62.71 62.46 62.58 1166.00 1012.22 1137.66 989.33 1076.30 Ave K3 63.81 63.40 63.72 63.48 63.60 1168.22 1024.66 1146.88 1058.33 1099.52 Ave P 62.23 61.91 62.21 61.93 62.07 1108.66 970.85 1078.25 958.81 1029.14
LSD0.05 Irrigation (I) 0.06 35.18
LSD0.05 K fertilizer (K) 0.11 42.21
LSD0.05 Intercropping (P) 0.14 30.49
LSD0.05 I × K 0.16 N.S.
LSD0.05. I × P 0.20 N.S.
LSD0.05 K × P N.S. N.S.
LSD0.05 I × K × P 0.44 N.S.
Sole sunflower 61.43 3442.66
compared to those with application of 100% ETo in the combined data across the two seasons.
This can be attributed to the high growth parameters and the high metric po-tential and more availability of water in the root zone and these enhanced roots to absorb more water and increased the photosynthesis activity, which conse-quently increased the dry matter accumulation in plant organs. These results are in accordance with those obtained by Osman [37] who indicated that the yield parameters; stem and head diameters increased with increasing available soil moisture of sunflower crop under drip irrigation. Also, Abdel-Mawgoud et al.
[35] noticed that increasing available soil moisture increased stem and head di-ameters and head weight.
3.1.2. K Fertilizer 1) Peanut Traits
Data in Table 1 show that numbers of pods and seeds plant−1, pods weight
plant−1, number of seeds plant−1, seed yield plant−1 and pod yield ha−1 were
af-fected significantly by K fertilizer in the combined data across the two seasons. K3 fertilizer increased numbers of pods and seeds plant−1, seed yield plant−1 and
pod yield ha−1 compared with those that received K1 or K2 fertilizer in the
com-bined data across the two seasons. With respect to K3 fertilizer, numbers of pods and seeds plant−1, seed yield plant−1 and pod yield ha−1 were increased
DOI: 10.4236/as.2018.98070 1018 Agricultural Sciences
application of K2 fertilizer in the combined data across the two seasons (Table 1). These results may be due to K3 fertilizer improved CO2 fixation because of
bet-ter conductivity of stomata which increased carbohydrate production [38]. These results are in similar with those of Gabr [39] who revealed that applying K as soil application increased seed yield.
2) Sunflower Traits
Data in Table 2 show that number of leaves plant−1, stem and head diameters,
head seed weight and seed yield ha−1 were affected significantly by K fertilizer in
the combined data across the two seasons. K3 fertilizer caused significant incre-ments in number of leaves plant−1, stem and head diameters, head seed weight
and seed yield ha−1 in the combined data across the two seasons. With respect to
K3 fertilizer, head seed weight was increased significantly by 1.62% compared to those with application of K2 fertilizer in the combined data across the two sea-sons (Table 2). These results may be due to K3 fertilizer improved CO2 fixation
because of better conductivity of stomata which increased carbohydrate produc-tion [38].
3.1.3. Intercropping Patterns 1) Peanut Traits
Data in Table 1 show that numbers of pods and seeds plant−1, seed yield
plant−1 and pod yield ha−1 were not affected significantly by K fertilizer in the
combined data across the two seasons. These results could be due to all inter-cropping patterns of sunflower had similar effects on peanut during growth and development.
2) Sunflower Traits
Data in Table 2 show that stem diameter, head seed weight and seed yield ha−1
were affected significantly by intercropping patterns in the combined data across the two seasons, meanwhile number of leaves plant−1 and head diameter were
not affected. P1 intercropping pattern had the highest values of stem diameter, head seed weight and seed yield ha−1 compared to the other intercropping
pat-terns in the combined data across the two seasons. It seems that sunflower has a high capacity to achieve full light interception at narrow distance between sun-flower hills. According to Andrade et al. [40], sunflower yield increase in re-sponse to narrow planting pattern is closely related to the improvement in light interception during the critical period for grain set. Proper arrangement of sun-flower plants is important to get advantage of the free available solar radiation in crop production [41]. Similar results were obtained by Khan and Akmal [42]
who showed that planting geometry of 90 × 15.5 cm recorded higher yield than planting geometry 70 × 20 cm.
3.1.4. The interaction between Irrigation Water Levels and K Fertilizer
1) Peanut Traits
sig-DOI: 10.4236/as.2018.98070 1019 Agricultural Sciences
nificantly numbers of pods and seeds plant−1 and seed yield plant−1 in the
com-bined data across the two seasons, meanwhile pod yield ha−1 was not affected
(Table 1). Peanut plants that irrigated with 100% ETo and received K3 fertilizer recorded the highest values of number of pods and seed yield plant−1 compared
with the others. However, the highest number of seeds plant−1 was obtained by
irrigation water level 120% ETo × K3 fertilizer in the combined data across the two seasons. It could be deduced that higher availability of water with K3 fertil-izer enabled peanut plants to increase productivity under intercropping culture. These results are parallel with those obtained by Gireshsingh and Mahindra [43]
who revealed that the highest yield was achieved under drip irrigation at a fer-tilization rate of 360 kg ha−1.
2) Sunflower Traits
The interaction between irrigation water levels and K fertilizer affected sig-nificantly number of leaves plant−1, stem diameter and head seed weight in the
combined data across the two seasons, meanwhile head diameter and seed yield ha−1 were not affected (Table 2). Sunflower plants that irrigated with 100% ETo
and received K3 fertilizer recorded the highest stem diameter compared with the others. However, the highest values of number of leaves plant−1 and head seed
weight were obtained by irrigation water level 120% ETo × K3 fertilizer in the combined data across the two seasons. These data reveal that each of these two factors act dependently on these traits except head diameter and seed yield ha−1.
These results are parallel with those obtained by Taha and Abbass [44] who showed that irrigation each 8 days with K fertilization resulted in the highest values for the above vegetative and yield parameters.
3.1.5. The Interaction between Irrigation Water Levels and Intercropping Patterns
1) Peanut Traits
All the studied peanut traits were not affected significantly by the interaction between irrigation water levels and intercropping patterns in the combined data across the two seasons (Table 1). It seems that the increase in yield attributes of peanut was equally statistical under all the treatments of this interaction. This result may be attributed to shading of adjacent sunflower plants interacted posi-tively with irrigation water levels to furnish better above and under-ground con-ditions for peanut growth by making the surrounding environment with peanut more moister. These data reveal that intercropping patterns responded similarly to irrigation water levels for all the studied peanut traits. These results are in agreement with those obtained by El-Mehy et al. [15] who reported that the in-teraction between irrigation treatments and intercropping patterns had no sig-nificant effect on pod yield ha−1 in both seasons.
2) Sunflower Traits
DOI: 10.4236/as.2018.98070 1020 Agricultural Sciences
across the two seasons, meanwhile number of leaves plant−1, stem diameter and
seed yield ha−1 were not affected (Table 2). Generally, P1 intercropping pattern
hat irrigated with 120% ETo recorded the highest values of head diameter and head seed weight compared with the others. These data reveal that each of these two factors act dependently on head diameter and head seed weight. These re-sults are parallel with those obtained by El-Mehy et al. [15] who demon-strated that head diameter and head weight were influenced significantly by interaction between irrigation treatments and intercropping patterns in both seasons.
3.1.6. The Interaction between K Fertilizer and Intercropping Patterns
1) Peanut Traits
Data in Table 1 show that all the studied peanut traits were not affected sig-nificantly by the interaction between K fertilizer and intercropping patterns in the combined data across the two seasons. It seems that the increase in yield at-tributes of peanut was equally statistical under all the treatments of this interac-tion. This result may be attributed to shading of adjacent sunflower plants inter-acted positively with K fertilizer to furnish better above and under-ground con-ditions for peanut growth. These data reveal that intercropping patterns re-sponded similarly to K fertilizer for all the studied peanut traits.
2) Sunflower Traits
The interaction between K fertilizer and intercropping patterns affected sig-nificantly number of leaves plant−1 in the combined data across the two seasons,
meanwhile stem and head diameters, head seed weight and seed yield ha−1 were
not affected (Table 2). P1 intercropping pattern that received K3 fertilizer re-corded the highest number of leaves plant−1 compared with the others. These
data reveal that each of these two factors act dependently on number of leaves plant−1.
3.1.7. The Interaction among Irrigation Water Levels, K Fertilizer and Intercropping Patterns
1) Peanut Traits
Data in Table 1 show that all the studied peanut traits were not affected sig-nificantly by the interaction between irrigation water levels, K fertilizer and intercropping patterns in the combined data across the two seasons. It seems that the increase in yield attributes of peanut was equally statistical under all the treatments of this interaction. This result may be attributed to shading of adja-cent sunflower plants interacted positively with irrigation water levels and K fer-tilizer to furnish better above and under-ground conditions for peanut growth. These data reveal that intercropping patterns responded similarly to irrigation water levels and K fertilizer for all the studied peanut traits.
2) Sunflower Traits
DOI: 10.4236/as.2018.98070 1021 Agricultural Sciences
patterns affected significantly head seed weight in the combined data across the two seasons, meanwhile number of leaves plant−1, stem and head diameters,
head seed weight and seed yield ha−1 were not affected (Table 2). P1
intercrop-ping pattern that irrigated with 120% ETo and received K3 fertilizer recorded the highest head seed weight compared with the others.
3.2. Water Relations of Peanut and Sunflower Patterns
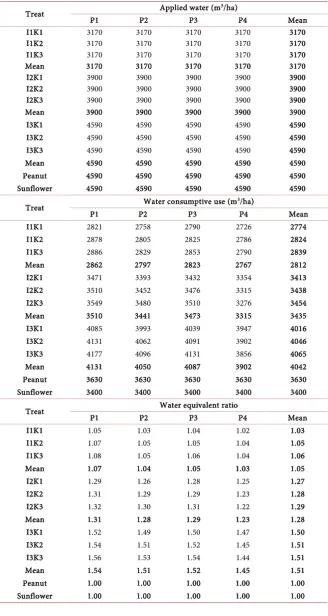
The results in Table 3 indicated that increasing the applied irrigation water from 70% ETo to 120% ETo resulted in an increase in water consumptive use of pea-nut and sunflower intercropping patterns. The table also showed that the values of water equivalent ratio (WER) for all intercropping pattern were higher than 1.
The lowest values of WER were obtained under the application of 70% ETo, K1 fertilizer level and P4 intercropping patterns. The highest value was obtained under the application of 120% ETo, K3 fertilizer level and P1 intercropping pat-tern. Thus, the productivity of the unit of water can be increased by a value be-tween 52% - 56% under 120% ETo, K3 fertilizer level and P1 intercropping pat-tern.
Our results indicated that the highest values of water equivalent ratio were obtained from using 120% ETo, K3 fertilizer level under P1 intercropping pat-tern, followed by 100% ETo, K3 fertilizer under P1 intercropping pattern. Simi-lar results were obtained by El-Mehy et al. (15) who indicated that the highest value of water equivalent ratio was obtained with 120% ETo and 25% of sun-flower planting density intercropped with 100% of peanut planting density, where its spatial arrangements was similar to what was implemented in our ex-periment under P1 intercropping pattern.
3.3. Competitive Relationships
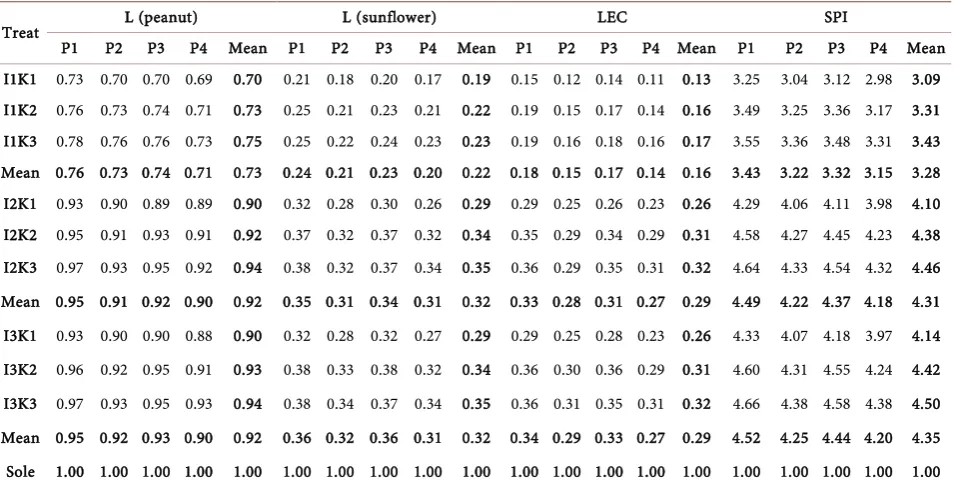
3.3.1. LEC
LEC is a measure of interaction concerned with the strength of relationship. LEC is used for a two-crop mixture the minimum expected productivity coefficient (PC) is 25 percent, that is, a yield advantage is obtained if LEC value was ex-ceeded 0.25. The effects of irrigation water quantities, K fertilizer and intercrop-ping patterns on the LEC of sunflower with peanut were exceeded 0.25 under all treatments except treatments that irrigated with 70% ETo and treatments that irrigated with 100% and 120% ETo for P2 and P4 intercropping patterns (Table 4). LEC ranged from 0.11 for P4 intercropping pattern that irrigated with 70% ETo and received K1 fertilizer to 0.36 for P1 intercropping pattern that irrigated with 100 or 120% ETo and received K3 fertilizer.
3.3.2. SPI
DOI: 10.4236/as.2018.98070 1022 Agricultural Sciences
Table 3. Applied irrigation water, water consumptive use and water equivalent ratio for peanut and sunflower intercropping patterns (P) under irrigation treatments (I) and K fertilizer (K) averaged over the two growing seasons.
Treat P1 P2 Applied water (mP3 3/ha) P4 Mean I1K1 3170 3170 3170 3170 3170 I1K2 3170 3170 3170 3170 3170 I1K3 3170 3170 3170 3170 3170 Mean 3170 3170 3170 3170 3170 I2K1 3900 3900 3900 3900 3900 I2K2 3900 3900 3900 3900 3900 I2K3 3900 3900 3900 3900 3900 Mean 3900 3900 3900 3900 3900 I3K1 4590 4590 4590 4590 4590 I3K2 4590 4590 4590 4590 4590 I3K3 4590 4590 4590 4590 4590 Mean 4590 4590 4590 4590 4590 Peanut 4590 4590 4590 4590 4590 Sunflower 4590 4590 4590 4590 4590
Treat P1 P2 Water consumptive use (mP3 3P4 /ha) Mean I1K1 2821 2758 2790 2726 2774 I1K2 2878 2805 2825 2786 2824 I1K3 2886 2829 2853 2790 2839 Mean 2862 2797 2823 2767 2812 I2K1 3471 3393 3432 3354 3413 I2K2 3510 3452 3476 3315 3438 I2K3 3549 3480 3510 3276 3454 Mean 3510 3441 3473 3315 3435 I3K1 4085 3993 4039 3947 4016 I3K2 4131 4062 4091 3902 4046 I3K3 4177 4096 4131 3856 4065 Mean 4131 4050 4087 3902 4042 Peanut 3630 3630 3630 3630 3630 Sunflower 3400 3400 3400 3400 3400
DOI: 10.4236/as.2018.98070 1023 Agricultural Sciences
Table 4. Relative yields of peanut and sunflower, LEC and SPI under irrigation water levels, K fertilizer and intercropping patterns averaged on the two seasons.
Treat L (peanut) L (sunflower) LEC SPI
P1 P2 P3 P4 Mean P1 P2 P3 P4 Mean P1 P2 P3 P4 Mean P1 P2 P3 P4 Mean I1K1 0.73 0.70 0.70 0.69 0.70 0.21 0.18 0.20 0.17 0.19 0.15 0.12 0.14 0.11 0.13 3.25 3.04 3.12 2.98 3.09 I1K2 0.76 0.73 0.74 0.71 0.73 0.25 0.21 0.23 0.21 0.22 0.19 0.15 0.17 0.14 0.16 3.49 3.25 3.36 3.17 3.31 I1K3 0.78 0.76 0.76 0.73 0.75 0.25 0.22 0.24 0.23 0.23 0.19 0.16 0.18 0.16 0.17 3.55 3.36 3.48 3.31 3.43 Mean 0.76 0.73 0.74 0.71 0.73 0.24 0.21 0.23 0.20 0.22 0.18 0.15 0.17 0.14 0.16 3.43 3.22 3.32 3.15 3.28 I2K1 0.93 0.90 0.89 0.89 0.90 0.32 0.28 0.30 0.26 0.29 0.29 0.25 0.26 0.23 0.26 4.29 4.06 4.11 3.98 4.10 I2K2 0.95 0.91 0.93 0.91 0.92 0.37 0.32 0.37 0.32 0.34 0.35 0.29 0.34 0.29 0.31 4.58 4.27 4.45 4.23 4.38 I2K3 0.97 0.93 0.95 0.92 0.94 0.38 0.32 0.37 0.34 0.35 0.36 0.29 0.35 0.31 0.32 4.64 4.33 4.54 4.32 4.46 Mean 0.95 0.91 0.92 0.90 0.92 0.35 0.31 0.34 0.31 0.32 0.33 0.28 0.31 0.27 0.29 4.49 4.22 4.37 4.18 4.31 I3K1 0.93 0.90 0.90 0.88 0.90 0.32 0.28 0.32 0.27 0.29 0.29 0.25 0.28 0.23 0.26 4.33 4.07 4.18 3.97 4.14 I3K2 0.96 0.92 0.95 0.91 0.93 0.38 0.33 0.38 0.32 0.34 0.36 0.30 0.36 0.29 0.31 4.60 4.31 4.55 4.24 4.42 I3K3 0.97 0.93 0.95 0.93 0.94 0.38 0.34 0.37 0.34 0.35 0.36 0.31 0.35 0.31 0.32 4.66 4.38 4.58 4.38 4.50 Mean 0.95 0.92 0.93 0.90 0.92 0.36 0.32 0.36 0.31 0.32 0.34 0.29 0.33 0.27 0.29 4.52 4.25 4.44 4.20 4.35 Sole 1.00 1.00 1.00 1.00 1.00 1.00 1.00 1.00 1.00 1.00 1.00 1.00 1.00 1.00 1.00 1.00 1.00 1.00 1.00 1.00
highest than the other treatments. This result implies a relatively stable produc-tivity.
3.3.3. RCC
Data presented in Table 5 indicate that RCC had higher than the unit advantage in all treatments except some intercropping patterns that irrigated with 70% ETo in the combined data across the two seasons. The best results for K were achieved by P1 intercropping pattern that irrigated with 100% or 120% Eto and received K3 fertilizer. A yield advantage occurred because the component crops differed in their utilization of growth resources in such a way that when they are grown in association, they are able to complement each other and to work better overall use environmental resources than when they were grown separately. This finding indicates that the inter-specific competition was reduced with increasing K fertilizer between peanut and sunflower and the competitive ability of inter-cropped peanut was improved. The inter-specific competitiveness played an important role in determining the species yields in intercropping system [45].
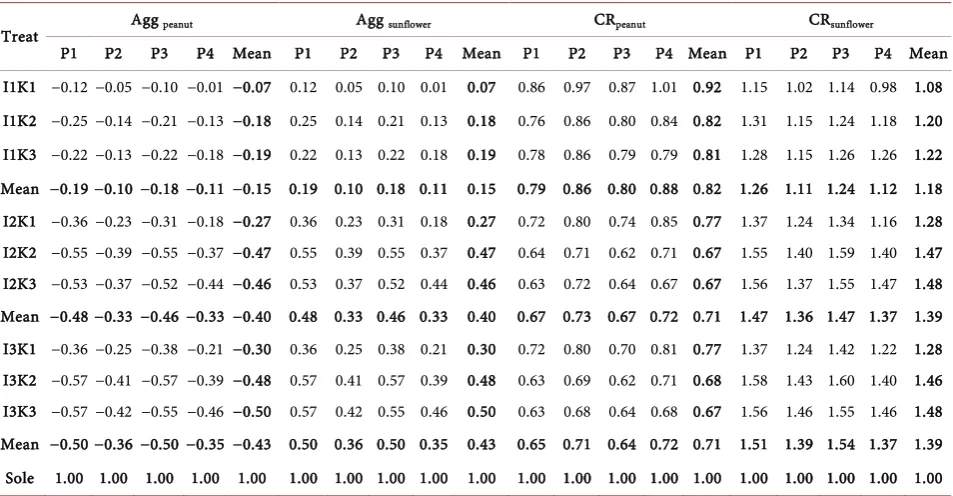
3.3.4. Agg
Data in Table 6 Show that sunflower was the dominant intercrop component in all intercropping patterns in the combined data across the two seasons. The best results for Agg were achieved by P1 intercropping pattern that irrigated with 120% Eto and received K3 fertilizer. Peanut was the dominated component.
DOI: 10.4236/as.2018.98070 1024 Agricultural Sciences
Table 5. RCC under irrigation water levels, K fertilizer and intercropping patterns averaged on the two seasons.
Treat Kpeanut Ksunflower RCC
P1 P2 P3 P4 Mean P1 P2 P3 P4 Mean P1 P2 P3 P4 Mean I1K1 0.69 0.59 0.60 0.56 0.61 1.09 0.92 1.02 0.86 0.97 0.75 0.54 0.62 0.48 0.59 I1K2 0.82 0.68 0.72 0.62 0.71 1.36 1.12 1.25 1.08 1.20 1.12 0.76 0.91 0.67 0.85 I1K3 0.92 0.79 0.83 0.70 0.81 1.35 1.14 1.32 1.20 1.25 1.24 0.91 1.11 0.84 1.01 Mean 0.80 0.68 0.71 0.62 0.70 1.26 1.06 1.19 1.04 1.14 1.02 0.72 0.85 0.65 0.80 I2K1 3.32 2.27 2.20 2.13 2.48 1.91 1.59 1.74 1.47 1.68 6.35 3.61 3.83 3.14 4.14 I2K2 5.87 2.81 3.32 2.60 3.65 2.43 1.96 2.36 1.90 2.16 14.29 5.51 7.86 4.97 7.71 I2K3 10.46 3.83 5.46 2.92 5.67 2.42 1.95 2.35 2.07 2.20 25.43 7.48 12.87 6.06 11.99 Mean 5.10 2.81 3.18 2.51 3.40 2.24 1.82 2.14 1.80 2.00 11.48 5.14 6.80 4.54 6.70 I3K1 3.83 2.27 2.27 1.94 2.58 1.93 1.63 1.89 1.52 1.74 7.41 3.70 4.29 2.96 4.44 I3K2 6.34 3.04 4.79 2.60 4.19 2.48 2.00 2.45 1.93 2.22 15.77 6.12 11.77 5.04 9.00 I3K3 9.27 3.83 5.87 3.32 5.57 2.53 2.07 2.44 2.14 2.30 23.49 7.95 14.35 7.13 12.42 Mean 5.46 2.92 3.64 2.51 3.63 2.30 1.89 2.25 1.85 2.07 12.60 5.55 8.21 4.67 7.39 Peanut 1.00 1.00 1.00 1.00 1.00 1.00 1.00 1.00 1.00 1.00 1.00 1.00 1.00 1.00 1.00 Sunflower 1.00 1.00 1.00 1.00 1.00 1.00 1.00 1.00 1.00 1.00 1.00 1.00 1.00 1.00 1.00
Table 6. Agg and CR under irrigation water levels, K fertilizer and intercropping patterns averaged on the two seasons.
Treat Agg peanut Agg sunflower CRpeanut CRsunflower
P1 P2 P3 P4 Mean P1 P2 P3 P4 Mean P1 P2 P3 P4 Mean P1 P2 P3 P4 Mean I1K1 −0.12 −0.05 −0.10 −0.01 −0.07 0.12 0.05 0.10 0.01 0.07 0.86 0.97 0.87 1.01 0.92 1.15 1.02 1.14 0.98 1.08 I1K2 −0.25 −0.14 −0.21 −0.13 −0.18 0.25 0.14 0.21 0.13 0.18 0.76 0.86 0.80 0.84 0.82 1.31 1.15 1.24 1.18 1.20 I1K3 −0.22 −0.13 −0.22 −0.18 −0.19 0.22 0.13 0.22 0.18 0.19 0.78 0.86 0.79 0.79 0.81 1.28 1.15 1.26 1.26 1.22 Mean −0.19 −0.10 −0.18 −0.11 −0.15 0.19 0.10 0.18 0.11 0.15 0.79 0.86 0.80 0.88 0.82 1.26 1.11 1.24 1.12 1.18 I2K1 −0.36 −0.23 −0.31 −0.18 −0.27 0.36 0.23 0.31 0.18 0.27 0.72 0.80 0.74 0.85 0.77 1.37 1.24 1.34 1.16 1.28 I2K2 −0.55 −0.39 −0.55 −0.37 −0.47 0.55 0.39 0.55 0.37 0.47 0.64 0.71 0.62 0.71 0.67 1.55 1.40 1.59 1.40 1.47 I2K3 −0.53 −0.37 −0.52 −0.44 −0.46 0.53 0.37 0.52 0.44 0.46 0.63 0.72 0.64 0.67 0.67 1.56 1.37 1.55 1.47 1.48 Mean −0.48 −0.33 −0.46 −0.33 −0.40 0.48 0.33 0.46 0.33 0.40 0.67 0.73 0.67 0.72 0.71 1.47 1.36 1.47 1.37 1.39 I3K1 −0.36 −0.25 −0.38 −0.21 −0.30 0.36 0.25 0.38 0.21 0.30 0.72 0.80 0.70 0.81 0.77 1.37 1.24 1.42 1.22 1.28 I3K2 −0.57 −0.41 −0.57 −0.39 −0.48 0.57 0.41 0.57 0.39 0.48 0.63 0.69 0.62 0.71 0.68 1.58 1.43 1.60 1.40 1.46 I3K3 −0.57 −0.42 −0.55 −0.46 −0.50 0.57 0.42 0.55 0.46 0.50 0.63 0.68 0.64 0.68 0.67 1.56 1.46 1.55 1.46 1.48 Mean −0.50 −0.36 −0.50 −0.35 −0.43 0.50 0.36 0.50 0.35 0.43 0.65 0.71 0.64 0.72 0.71 1.51 1.39 1.54 1.37 1.39 Sole 1.00 1.00 1.00 1.00 1.00 1.00 1.00 1.00 1.00 1.00 1.00 1.00 1.00 1.00 1.00 1.00 1.00 1.00 1.00 1.00
[image:18.595.61.538.393.641.2]DOI: 10.4236/as.2018.98070 1025 Agricultural Sciences
3.3.5. CR
The values of CR were presented in Table 6. The intercropped sunflower had a greater CRsunflower compared with intercropped peanut in all treatments except P4
intercropping pattern that irrigated with 70% ETo and received K1 fertilizer. This indicates that the values of CRsunflower were greater than 1.0 in all treatments
except P4 intercropping pattern that irrigated with 70% ETo and received K1 fertilizer, however, the values of CRpeanut were less than 1.0. There were increases
in CRsunflower values with increasing irrigation water and K fertilizer levels and
CRpeanut had the opposite trend. CR value of intercropped peanut was lower than
sunflower, meanwhile CR value of intercropped peanut in P4 intercropping pat-tern that irrigated with 70% ETo and received K1 fertilizer because of the wide spacing of sunflower, this result may be promoted photosynthetic process of peanut and efficient N-use with effective rhizobial associations under sandy soil conditions. Consequently, root system of peanut cv. Ismailia 1 developed and absorbed more moisture and nutrients from sandy soil as elongated roots cover more surface area in the experimental soil and as such fixed substantial quantity of N through nodulation on roots [46].
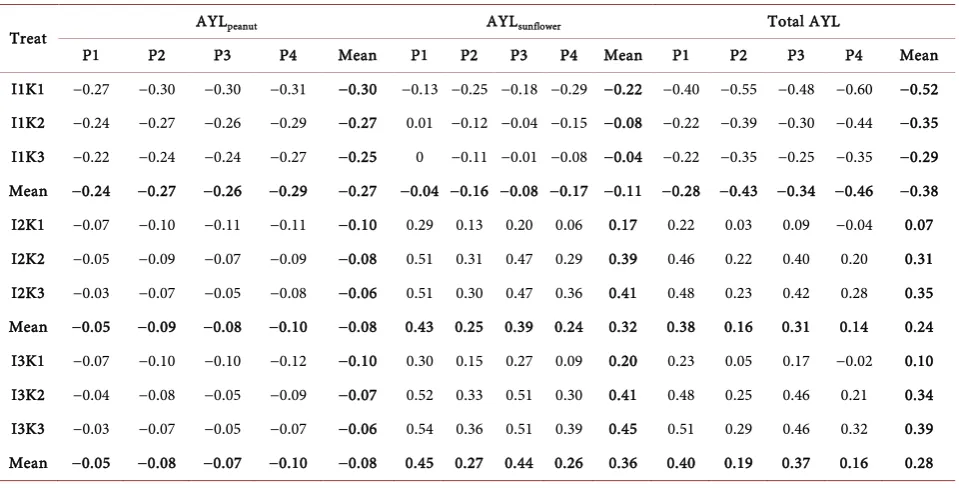
3.3.6. AYL
The values of AYL were presented in Table 7. The value of AYLpeanut was
nega-tive for all treatments as a result of inter-specific competition between both spe-cies for basic growth resources. Oppositely, the value of AYLsunflower was positive
[image:19.595.59.539.478.726.2]in all treatments except intercropping patterns that irrigated with 70% ETo without regarding to K fertilizer, which has shown a yield advantage of inter-cropped sunflower with increasing irrigation water level between peanut and sunflower. The maximum values of AYL were obtained by P1 intercropping
Table 7. AYL under irrigation water levels, K fertilizer and intercropping patterns averaged on the two seasons.
Treat AYLpeanut AYLsunflower Total AYL
DOI: 10.4236/as.2018.98070 1026 Agricultural Sciences
pattern that irrigated with 120% Eto and received K3 fertilizer. The results sug-gest that competitive ability of peanut decreased and sunflower increased.
3.4. Intercropping Economic Advantage
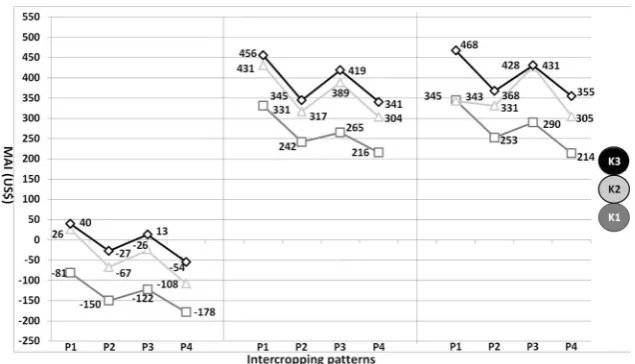
3.4.1. MAI
The economic performance of the intercropping was evaluated to determine if sunflower and peanut combined yields are high enough for the farmers to adopt this system. The averages of MAI values of P1 intercropping pattern that irri-gated with 120% ETo and received K3 fertilizer were higher than the other treatments (Figure 1). There were gradual and consistent increases in MAI val-ues with increasing K fertilizer of all intercropping patterns. P1 intercropping pattern that irrigated with 120% ETo and received K3 fertilizer resulted in high MAI and could be recommended.
3.4.2. IA
The values of IA were presented in Table 8. The values of IApeanut were always
negative, showing that peanut had a disadvantage in intercropping. The values of IAsunflower in all treatments were positive except intercropping patterns that
ir-rigated with 70% ETo had an opposite result. The values of IA were higher in P1 intercropping pattern that received K3 fertilizer and irrigated with 120 % ETo than those of the other treatments. The results indicate that P1 intercropping pattern that received K3 fertilizer and irrigated with 120% ETo had a highest economic advantage compared with the others.
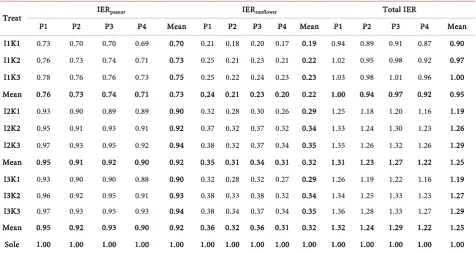
3.4.3. IER
[image:20.595.216.534.502.684.2]The values of IER were presented in Table 9. Within the treatments, the com-bined highest partial IER of peanut (0.97) and sunflower (0.38) were recorded by P1 intercropping pattern that irrigated with 120% Eto and received K3 fertilizer, meanwhile the lowest were recorded by P4 intercropping pattern that irrigated
DOI: 10.4236/as.2018.98070 1027 Agricultural Sciences
Table 8. IA under irrigation water levels, K fertilizer and intercropping patterns averaged on the two seasons.
Treat IApeanut IAsunflower Total IA
P1 P2 P3 P4 Mean P1 P2 P3 P4 Mean P1 P2 P3 P4 Mean I1K1 −122.58 −136.20 −136.20 −140.74 −136.20 −26.23 −48.09 −34.97 −54.65 −41.53 −148.81 −184.29 −171.17 −195.39 −177.73 I1K2 −108.96 −122.58 −118.04 −131.66 −122.58 2.18 −24.04 −8.74 −28.41 −15.30 −106.77 −146.62 −126.78 −160.07 −137.88 I1K3 −99.88 −108.96 −108.96 −122.58 −113.50 0 −21.86 −2.18 −15.30 −8.74 −99.88 −130.82 −111.14 −137.88 −122.24 Mean −110.47 −122.58 −121.06 −131.66 −124.09 −8.01 −31.33 −15.30 −32.79 −21.86 −118.48 −153.91 −136.36 −164.45 −145.95 I2K1 −31.78 −45.40 −49.94 −49.94 −45.40 54.65 26.23 39.34 13.11 32.79 22.87 −19.16 −10.59 −36.82 −12.60 I2K2 −22.70 −40.86 −31.78 −40.86 −36.32 96.18 59.02 89.62 54.65 74.32 73.48 18.16 57.84 13.79 38.00 I2K3 −13.62 −31.78 −22.70 −36.32 −27.24 96.18 56.83 89.62 67.76 78.69 82.56 25.05 66.92 31.44 51.45 Mean −22.70 −39.34 −34.80 −42.37 −36.32 82.34 47.36 72.86 45.17 61.93 59.64 8.01 38.06 2.80 25.61 I3K1 −31.78 −45.40 −45.40 −54.48 −45.40 56.83 28.41 52.46 17.48 39.34 25.05 −16.98 7.06 −36.99 −6.05 I3K2 −18.16 −36.32 −22.70 −40.86 −31.78 98.37 63.39 96.18 56.83 78.69 80.21 27.07 73.48 15.97 46.91 I3K3 −13.62 −31.78 −22.70 −31.78 −27.24 102.74 67.76 96.18 74.32 85.25 89.12 35.98 73.48 42.54 58.01 Mean −21.18 −37.83 −30.26 −42.37 −34.80 85.98 53.19 81.61 49.55 67.76 64.79 15.36 51.34 7.17 32.96
Table 9. IER under irrigation water levels, K fertilizer and intercropping patterns averaged on the two seasons.
Treat IERpeanut IERsunflower Total IER
P1 P2 P3 P4 Mean P1 P2 P3 P4 Mean P1 P2 P3 P4 Mean I1K1 0.73 0.70 0.70 0.69 0.70 0.21 0.18 0.20 0.17 0.19 0.94 0.89 0.91 0.87 0.90 I1K2 0.76 0.73 0.74 0.71 0.73 0.25 0.21 0.23 0.21 0.22 1.02 0.95 0.98 0.92 0.97 I1K3 0.78 0.76 0.76 0.73 0.75 0.25 0.22 0.24 0.23 0.23 1.03 0.98 1.01 0.96 1.00 Mean 0.76 0.73 0.74 0.71 0.73 0.24 0.21 0.23 0.20 0.22 1.00 0.94 0.97 0.92 0.95 I2K1 0.93 0.90 0.89 0.89 0.90 0.32 0.28 0.30 0.26 0.29 1.25 1.18 1.20 1.16 1.19 I2K2 0.95 0.91 0.93 0.91 0.92 0.37 0.32 0.37 0.32 0.34 1.33 1.24 1.30 1.23 1.26 I2K3 0.97 0.93 0.95 0.92 0.94 0.38 0.32 0.37 0.34 0.35 1.35 1.26 1.32 1.26 1.29 Mean 0.95 0.91 0.92 0.90 0.92 0.35 0.31 0.34 0.31 0.32 1.31 1.23 1.27 1.22 1.25 I3K1 0.93 0.90 0.90 0.88 0.90 0.32 0.28 0.32 0.27 0.29 1.26 1.19 1.22 1.16 1.19 I3K2 0.96 0.92 0.95 0.91 0.93 0.38 0.33 0.38 0.32 0.34 1.34 1.25 1.33 1.23 1.27 I3K3 0.97 0.93 0.95 0.93 0.94 0.38 0.34 0.37 0.34 0.35 1.36 1.28 1.33 1.27 1.29 Mean 0.95 0.92 0.93 0.90 0.92 0.36 0.32 0.36 0.31 0.32 1.32 1.24 1.29 1.22 1.25 Sole 1.00 1.00 1.00 1.00 1.00 1.00 1.00 1.00 1.00 1.00 1.00 1.00 1.00 1.00 1.00
[image:21.595.61.538.359.612.2]DOI: 10.4236/as.2018.98070 1028 Agricultural Sciences
and received K1 fertilizer gave a disadvantage of this intercropping pattern over sole culture.
4. Conclusion
Generally, competitive effects of intercropping peanut with sunflower appear to be a viable approach for reducing water dependency and improving profitability of Egyptian farmers under sandy soil conditions. P1 intercropping pattern de-creased competitive pressure between the intercrops and increase WER with in-crease in K uptake by 30% over sole peanut under 120% drip water irrigation. Also, this cropping system increased MAI, IA and IER compared with sole pea-nut and it could be recommended.
Conflicts of Interest
The authors declare no conflicts of interest regarding the publication of this pa-per.
References
[1] Craine, J.M. and Dybzinski, R. (2013) Mechanisms of Plant Competition for Nutri-ents, Water and Light. Functional Ecology, 27, 833-840.
https://doi.org/10.1111/1365-2435.12081
[2] Sammis, T.W. (1980) Comparison of Sprinkler, Trickle, Subsurface, and Furrow Ir-rigation Methods for Row Crops. Agronomy Journal, 72, 701-704.
https://doi.org/10.2134/agronj1980.00021962007200050002x
[3] NWRP (2002) Facing the Challenge. National Conference: National Water Re-sources Plan Project, Planning Sector, Ministry of Water Resources & Irrigation, Cairo, 29 April 2002, 5.
[4] Abdel Wahab, A.F., Biomy, A.H.M. and El Farghal, W.M. (2003) Effect of Some Natural Soil Amendments on Biological Nitrogen Fixation, Growth and Green Yield of Pea Plants Grown on Sandy Soils. Fayoum Journal of Agricultural Research and Environment, 17, 47-54.
[5] Sezen, S.M., Yazar, A., Kapur, B. and Tekin, S. (2011) Comparison of Drip and Sprinkler Irrigation Strategies on Sunflower Seed and Oil Yield and Quality under Mediterranean Climatic Conditions. Agricultural Water Management, 98, 1153-1161.
https://doi.org/10.1016/j.agwat.2011.02.005
[6] Kadasiddappa, M.M., Rao, V.P., Reddy, K.Y., Ramulu, V., Devi, M.U. and Reddy, S.N. (2017) Effect of Irrigation (Drip/Surface) on Sunflower Growth, Seed and Oil Yield, Nutrient Uptake and Water Use Efficiency—A Review. Agricultural Reviews, 38, 152-15. https://doi.org/10.18805/ag.v38i02.7947
[7] Malik, S.M., Chaudhry, R.A. and Hussain, G. (1989) Crop Response to Potassium Application in the Punjab. Proceedings of Workshop on Role of K Improving Fer-tilizer Use Efficiency, UDFC/PARC, Islamabad, Pakistan, 21-22 March 1987. [8] Mkamilo, G.S. (1998) Analysis of Yield Advantage in Intercropping. Master’s
The-sis, Wageningen Agricultural University, Wageningen.
DOI: 10.4236/as.2018.98070 1029 Agricultural Sciences
[10] Asadi, S. (2010) Influence of Different K Fertilizer Sources on Sunflower Produc-tion. 19th World Congress of Soil Science, Science and Research Campus, Tehran, Iran, 1-6 August 2010, 16-18.
[11] Veeramani, P. and Subrahmaniyan, K. (2012) Physical and Economic Optimum of Response Model for NPK Application in Irrigated Groundnut (Arachis hypogaea L.). Madras Agricultural Journal, 99, 526-529.
[12] Raza, M.A.S., Saleem, M.F., Shah, G.M., Jamil, M. and Khan, I.H. (2013) Potassium Applied under Drought Improves Physiological and Nutrient Uptake Performances of Wheat (Triticum aestivun L.). Journal of Soil Science and Plant Nutrition, 13, 175-185.
[13] Almeida, H.J., Pancelli, M.A., Prado, R.M., Cavalcante, V.S. and Cruz, F.J.R. (2015) Effect of Potassium on Nutritional Status and Productivity of Peanuts in Succession with Sugarcane. Journal of Soil Science and Plant Nutrition, 15, 1-10.
[14] Pal, M.S., Kumar, A. and Singh, R.P. (1997) Response of Spring Grown Sunflower (Helianthus annuus L.) Cultivars to Different Planting Geometry in Foothills of Utar Pradesh. Indian Journal of Agronomy, 42, 502-505.
[15] El-Mehy Amira, A., Taha, A.M. and Abd-Allah, A.M.M. (2018) Maximizing Land and Water Productivity by Intercropping Sunflower with Peanut under Sprinkler Irrigation. Alexandria Science Exchange Journal, 39, 144-160.
https://doi.org/10.21608/asejaiqjsae.2018.5820
[16] Snyder, R.L., Orang, M., Bali, K. and Eching, S. (2004) Basic Irrigation Scheduling BISm.
http://www.waterplan.water.ca.gov/landwateruse/wateruse/Ag/CUP/California/cCli
mate_Data_010804.xls
[17] Vermeiren, L. and Jopling, G.A. (1984) Localized Irrigation. Paper No. 36, FAO, Ir-rigation and Drainage Rome, Italy.
[18] Majumdar, D.K. (2002) Irrigation Water Management: Principles and Practice. 2nd Edition, Prentice-Hall of India, New Delhi, 487 p.
[19] Mao, L.L., Zhang, L.Z., Li, W.W., Werf, W.V.D., Sun, J.H., Spiertz, H. and Li, L. (2012) Yield Advantage and Water Saving in Maize/Pea Intercrop. Field Crops Re-search, 138, 11-20. https://doi.org/10.1016/j.fcr.2012.09.019
[20] Adetiloye, P.O., Ezedinma, F.O.C. and Okigbo, B.N. (1983) A Land Equivalent Co-efficient Concept for the Evaluation of Competitive and Productive Interactions on Simple Complex Mixtures. Ecological Modelling, 19, 27-39.
https://doi.org/10.1016/0304-3800(83)90068-6
[21] Odo, P.E. (1991) Evaluating Short and Tall Sorghum Varieties in Mixtures with Cowpea in Sudan Savanna of Nigeria: LER, Grain Yield and System Productivity Index. Experimental Agriculture, 27, 435-441.
https://doi.org/10.1017/S0014479700019426
[22] Banik, P., Midya, A., Sarkar, B.K. and Ghose, S.S. (2006) Wheat and Chickpea Intercropping Systems in an Additive Series Experiment: Advantages and Weed Smothering. European Journal of Agronomy, 24, 325-332.
https://doi.org/10.1016/j.eja.2005.10.010
[23] Willey, R.W. (1979) Intercropping Its Importance and Research Needs. Part I: Competition and Yield Advantages. Field Crops Abstract, 32, 1-10.
DOI: 10.4236/as.2018.98070 1030 Agricultural Sciences
[25] Banik, P., Sasmal, T., Ghosal, P.K. and Bagchi, D.K. (2000) Evaluation of Mustard (Brassica compestris var. Toria) and Legume Intercropping under 1M:1S and 2:1 Row-Replacement Series Systems. Journal of Agronomy and Crop Science, 185, 9-14. https://doi.org/10.1046/j.1439-037X.2000.00388.x
[26] Ghosh, P.K. (2004) Growth, Yield, Competition and Economic of Groundnut/Cereal Fodder Intercropping Systems in the Semi-Arid Tropics of India. Field Crops Re-search, 88, 217-237. https://doi.org/10.1016/j.fcr.2004.01.015
[27] Bulletin of Statistical Cost Production and Net Return (2017) Summer and Nili Field Crops and Vegetables and Fruit, Agriculture Statistics and Economic Sector, Ministry of Egyptian Agriculture and Land Reclamation, Part (2). Egypt.
[28] Ghaffarzadeh, M. (1997) Economic and Biological Benefits of Intercropping Ber-seem Clover with Oat in Corn-Soybeanoat Rotations. Journal of Production Agri-culture, 10, 314-319. https://doi.org/10.2134/jpa1997.0314
[29] Gomez, K.A. and Gomez, A.A. (1984) Statistical Procedures for Agricultural Re-search. 2nd Edition, John Willey and Sons, Toronto, ON, Canada.
[30] Rao, R.C.N., Singh, S., Sivakumar, M.V.K., Srivastava, K.L. and Williams, J.H. (1984) Effect of Water Deficit at Different Growth Phases of Peanut. I. Yield Re-sponses. Agronomy Journal, 77, 782-786.
https://doi.org/10.2134/agronj1985.00021962007700050026x
[31] Boote, K.J., Stansell, J.R., Schubert, A.M. and Stone, J.F. (1982) Irrigation, Water Use, and Water Relations. In: Pattee, H.E. and Young, C.T., Eds., Peanut Science and Technology, Yoakum, American Peanut Research and Education Society, Texas, 164-205.
[32] Mozaffari, K., Arshi, Y. and Zeinali-Khanghaa, H. (1996) Research on the Effects of Water Stress on Some Morphophysiological Traits and Yield Components of Sun-flower (Helianthus annuus L.). Seed and Plant, 12, 24-33.
[33] El-Midaoui, M., Serieys, H., Griveau, Y., Benbella, M., Talouizte, A., Berville, A. and Kaan, F. (2003) Effects of Osmotic and Water Stresses on Root and Shoot Mor-phology and Seed Yield in Sunflower (Helianthus annuus L.) Genotypes Bred for Morocco or Issued from Introgression with H. Argophyllus T. & G. and H. Debilis Nutt. Helia, 26, 1-15. https://doi.org/10.2298/HEL0338001M
[34] Rauf, S. and Sadaqat, H.A. (2007) Effects of Varied Water Regimes on Root Length, Dry Matter Partitioning and Endogenous Plant Growth Regulators in Sunflower (Helianthus annuus L.). Journal of Plant Interactions, 2, 41-51.
https://doi.org/10.1080/17429140701422512
[35] Abdel-Mawgoud, A.S.A., Gameh, M.A., Abd-Elaziz, S.H. and El-Sayed, M.M. (2009) Sunflower Water Relations at Various Irrigation Regimes with Modern Irrigation Systems under Climatic Conditions of Assiut Governorate, Upper Egypt. 13th In-ternational Water Technology Conference (IWTC 2009), Hurghada, Egypt, 12-15 March 2009, 589-609.
[36] Szabo, A. and Pepo, P. (2005) Effect of Agrotechnical and Meteorological Factors on Yield Formation in Sunflower Production. Cereal Research Communications, 33, 49-52. https://doi.org/10.1556/CRC.33.2005.1.11
[37] Osman, E.B.A. (2001) Productivity of Some Sunflower Hybrids by Using Modern Sydtems of Irrigation and Fertilization under Newly Reclaimed Soil. Master’s The-sis, Assiut University, Assiut, Egypt.
DOI: 10.4236/as.2018.98070 1031 Agricultural Sciences
[39] Gabr, E.M.A. (1998) Effect of Preceding Winter Crops and Potassium Fertilizer Levels on Growth and Yield of Intercropped Peanut and Sesame in New Sandy Soils. Proceeding of 8th Conference in Agronomy Sciences, Suez Canal University, Ismailia, Egypt, 28-29 November 1998, 553-560.
[40] Andrade, F.H., Calvino, P., Cirilo, A. and Barbieri, P. (2002) Yield Responses to Narrows Rows Depend on Increased Radiation Interception. Agronomy Journal, 94, 975-980. https://doi.org/10.2134/agronj2002.0975
[41] Barros, J.F.C., Carvalho, M.D. and Basch, G. (2004) Response of Sunflower ( Heli-anthus annuus L.) to Sowing Date and Plant Density under Mediterranean Condi-tions. European Journal of Agronomy, 21, 347-356.
https://doi.org/10.1016/j.eja.2003.10.005
[42] Khan, M.A. and Akmal, M. (2016) Plant Arrangement Effect on the Sunflower Yield and Yield Traits in Spring Season Crop. Sarhad Journal of Agriculture, 32, 151-155.
https://doi.org/10.17582/journal.sja/2016.32.3.151.155
[43] Gireshsingh, M. and Mahindra, C. (2016) A Study on the Effects of Different Irriga-tion Methods and Fertilizer Regimes on Groundnut (Arachis hypogea var. cabri). Scholars Journal of Agriculture and Veterinary Sciences, 3, 9-19.
[44] Taha, M.M. and Abbass, J.A. (2008) Effect of Potassium Fertilization and Irrigation Intervals on Growth and Yield of Sunflower Helianthus annuus L. Jordan Journal of Agricultural Sciences, 4, 207-216.
[45] Zhang, L., Van der Werf, W., Zhang, S., Li, B. and Spiertz, J. (2007) Growth, Yield and Quality of Wheat and Cotton in Relay Strip Intercropping Systems. Field Crops Research, 103, 178-188. https://doi.org/10.1016/j.fcr.2007.06.002
[46] Abdel-Galil, M.A., Abdel-Wahab, S. and Abdel-Wahab, T. (2015) Effect of Some Preceded Peanut Cultivars on Wheat Yield and Agro—Economic Feasibility under Two Cropping Systems in Sandy Soil. Sustainable Agriculture Research, 4, 47-56.