Far-Field Pattern Reconstruction from Positioning Errors
Affected Near-Field Data Acquired via Helicoidal Scanning
Francesco D’Agostino, Flaminio Ferrara, Claudio Gennarelli, Rocco Guerriero, Massimo Migliozzi
Department of Electronic and Computer Engineering, University of Salerno, Fisciano, Italy. Email: {fdagostino, flferrara, cgennarelli, rguerriero, mmigliozzi}@unisa.it
Received December 7th, 2011; revised January 10th, 2012; accepted January 19th, 2012
ABSTRACT
In this paper, an effective technique to compensate the positioning errors in a near-field - far-field (NF-FF) transforma-tion with helicoidal scanning for elongated antennas is presented and validated both numerically and experimentally. It relies on a nonredundant sampling representation of the voltage measured by the probe, obtained by considering the antenna as enclosed in a cylinder ended in two half-spheres. An iterative scheme is used to reconstruct the helicoidal NF data at the points fixed by the representation from the acquired irregularly spaced ones. Once the helicoidal data have been retrieved, those needed by a classical NF-FF transformation with cylindrical scanning are efficiently evaluated by using an optimal sampling interpolation algorithm. Some numerical tests, assessing the accuracy of the approach and its stability with respect to random errors affecting the data, are reported. Experimental tests performed at the Antenna Characterization Lab of the University of Salerno further confirm the validity of the proposed technique.
Keywords: Antenna Measurements; Near-Field - Far-Field Transformations; Helicoidal Scanning; Nonredundant Sampling Representations of Electromagnetic Fields; Probe Positioning Errors Compensation
1. Introduction
Nowadays, the reduction of the time required to acquire the near-field data is assuming an ever growing relevance for the antenna measurement community. In fact, such a time is currently very much greater than that needed to perform the near-field - far-field (NF-FF) transformation. As suggested in [1], an effective way for reducing the measurement time is the use of innovative spiral scan-ning techniques [2-11], which can be implemented by means of continuous and synchronized movements of the positioning systems of the probe and antenna under test (AUT). These scans rely on the nonredundant sampling representations of electromagnetic (EM) fields [12] and use optimal sampling interpolation (OSI) formulas [13] to retrieve the NF data required by the NF-FF transfor-mation with the corresponding classical scanning from the acquired nonredundant ones. Accordingly, a drastic measurement time saving can be achieved due to the use of continuous movements and to the significantly re-duced number of acquired NF data. The resulting NF-FF transformations have proved to be accurate, stable, and efficient. In particular, the AUT has been considered as enclosed in the smallest sphere able to contain it in [2-5], whereas the unified theory of spiral scans for nonspheri-cal antennas [11] has made possible to adopt more effec-tive AUT modellings [6-10]. Besides a further reduction
of the needed NF data in the case of elongated or quasi- planar antennas, these last allow one to consider meas-urement cylinders (planes) with a radius (distance) smaller than one half the antenna maximum size, thus reducing the error due to the scanning zone truncation.
It is worth noting that other spiral scanning techniques have been proposed [14,15], but since these last ap-proaches do not exploit the nonredundant representations of EM fields, they need a useless large amount of NF measurements.
mulas are employed to retrieve the NF data required by the corresponding classical NF-FF transformation from the acquired nonredundant ones. In this context, the for-mulas available for the direct reconstruction from nonuni-form samples are not user friendly, unstable, and valid only for particular sampling points arrangements [19]. A convenient policy is to recover the uniform samples from those irregularly spaced and then determine the value at any point of the scanning surface by an accurate and sta-ble OSI formula. To this end, two different approaches have been proposed in [19,20] and compared and ex-perimentally validated in the cylindrical scanning case [21]. The former [19] relies on an iterative technique which converges only if it is possible to build a biunique correspondence associating at each uniform sampling point the nearest nonuniform one. The latter [20] em-ploys the singular value decomposition (SVD) method [22] and can be conveniently applied when the starting two-dimensional problem can be reduced to find the so-lution of two independent one-dimensional ones. If such a hypothesis is no longer valid, as in the helicodal scan-ning case, the dimension of the involved matrixes would become very large, thus requiring a massive computa-tional effort. Accordingly, in order to compensate the positioning errors, the iterative technique has been suc-cessfully applied in [23,24] for reconstructing the uni-formly distributed helicoidal samples from the acquired irregularly spaced ones in the NF-FF transformation with helicoidal scan for a quasi-spherical [2,5] and an elon-gated antenna [6,8], respectively.
The aim of this paper is to present and validate, both numerically and experimentally, the iterative scheme for compensating the positioning errors in the NF-FF trans-formation with helicoidal scanning for long antennas [7]. This last transformation assumes the AUT as enclosed in a cylinder ended in two half-spheres and, due to the flexibility of such a modelling, results to be more effec-tive from the data reduction viewpoint than the one [6,8] employing the prolate ellipsoid.
2. Theoretical Background
For reader’s convenience the key steps of the classical probe compensated NF-FF transformation with cylindri-cal scanning [25], as well as those concerning the recon-struction of the probe voltage from a nonredundant number of its samples lying along a helix [7], are sum-marized in this Section.
2.1. Classical NF-FF Transformation with Cylindrical Scanning
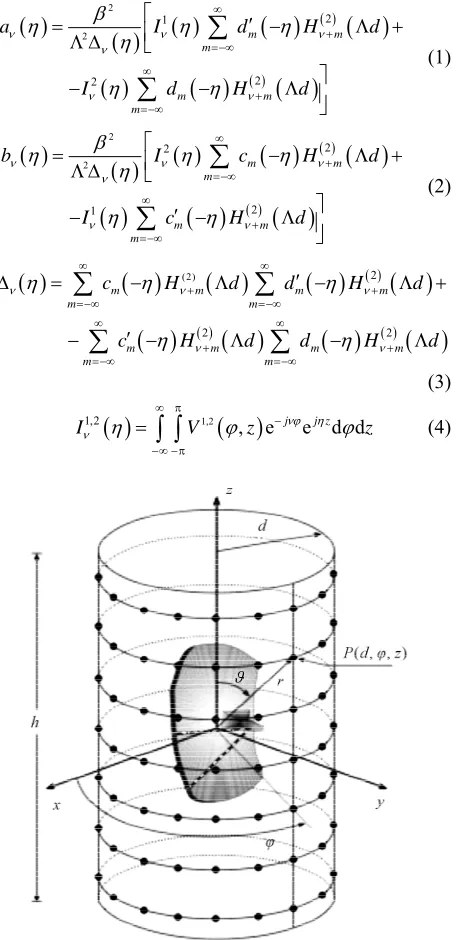
Let us consider a probe scanning a cylinder of radius d in the antenna NF region, and adopt the spherical coordi-nate system (r, , ) to denote an observation point both
in the NF and in the FF region (see Figure 1).
According to the classical probe compensated NF-FF transformation with cylindrical scanning, the modal co-efficients a and b of the cylindrical wave expansion of the field radiated by the AUT are related to: 1) the two-dimensional Fourier transforms 1
I and I2 of the output voltages of the probe for two independent sets of measurements (the probe is rotated 90˚ about its longitu-dinal axis in the second set); 2) the coefficients ( ) and ( , m m c d , m
c dm) of the cylindrical wave expansion of the
field radiated by the probe and the rotated probe, respec-tively, when used as transmitting antennas. The key rela-tions [25] are:
2 2 2 1 2 2 m m m m m ma I d H
I d H d
d
(1)
2 2 2 2 2 1 m m m m m mb I c H
I c H d
d
d (2)
(2) 2 2 2m m m m
m m
m m m m
m m
c H d d H d
c H d d H
(3)
1,2
1,2 , e j e d dj z
I V z z
(4) [image:2.595.313.542.246.716.2]
wherein , is the Hankel func-tion of second kind and order , is the wavenumber, and , are the output voltages of the probe and the rotated probe at the point of cylindrical coordinates
2 2
1/ 2
2 V )
(2)( )
H 1
V ,
d z
( , .
In the classical approach [25], the FFT is employed to evaluate in an efficient way the Fourier transforms (4), and the NF data are collected on a cylindrical grid where- in the sample spacing z between the rings is smaller than one half a wavelength and the one on each of them is fixed according to the so called minimum cylin-der law, i.e.,
2; 2
z
(5)
where ' is the radius of the smallest cylinder enclosing the AUT and is the wavelength.
Once the modal coefficients have been determined, the FF components of the electric field can be evaluated by means of the following relations:
, ,
2 e– sin
cos
ej r
j
E r j j b
r
(6)
, ,
2 e– sin
cos
ej r
j
E r j a
r
(7)which can be efficiently computed by performing the summations via the FFT algorithm.
In the next subsection, it is shown how the NF data at the grid spacings (5) can be recovered from a nonredun-dant (i.e. minimum) number of samples collected by the probe and rotated probe along a helix wrapping the measurement cylinder [7].
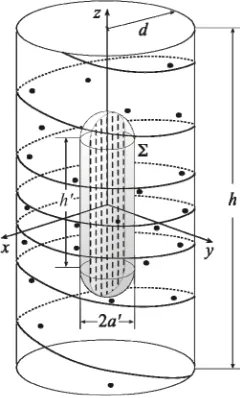
2.2. Nonredundant Sampling Representation on a Cylinder
Let us consider an elongated AUT, enclosed in a convex domain bounded by a surface with rotational symmetry, and a nondirective probe scanning a proper helix lying on a cylinder of radius d (Figure 2). A shape suitable to fit such an AUT is obtained by choosing coincident with a rounded cylinder, namely, a cylinder of height h ended in two half-spheres of radius (see Figure 2). Since the voltage measured by a nondirective probe has the same effective spatial bandwidth of the AUT field [26], the nonredundant representations of EM fields [12] can be applied to it. Accordingly, when dealing with the rep-resentation of the probe voltage on an observation curve C, it is convenient to adopt an optimal analytical param-eterization r
a
= r() to describe C and to introduce the “reduced voltage”
ej [image:3.595.363.483.86.285.2]V V (8) where V
is the voltage measured by the probe or byFigure 2. Geometry of the problem.
the rotated probe, and
V
is a proper phase function. The error, occurring when
is approximated by abandlimited function, becomes negligible as the band-width exceeds a critical value W [12]. Therefore, it can be effectively controlled by choosing a bandwidth equal to W, where 1 is the bandwidth enlargement factor.
The unified theory of spiral scans for nonspherical an-tennas [11] allows the development of the voltage repre-sentation on the cylinder from a nonredundant number of its samples on the helix. To this end, it is necessary: 1) to determine a nonredundant representation along the helix; 2) to choose the step of the helix coincident with that required for the interpolation along a generatrix. In par-ticular, according to [7,11], the bandwidth W, the pa-rameterization and the phase function relevant to a generatrix are:
1 2 1 2
; 2
W R R
s s
(9)
1 2 1 22 R R s s
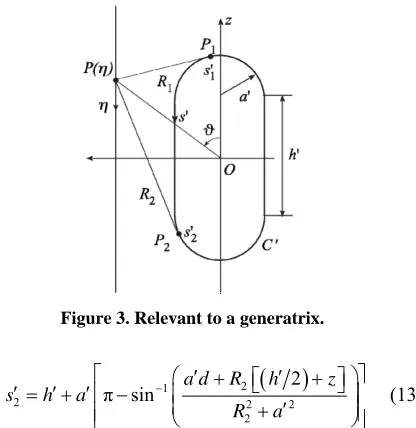
(10)where 2
h a
is the length of C (intersec-tion curve between the meridian plane and ), 1,2
s are the arclength coordinates of the tangency points 1,2 between the cone of vertex at the observation point P and
P
C, and
2 21,2 2
R zh d a2 (11) are the distances from P to (see Figure 3). It can be easily verified that: 1,2
P
1 1
1 2 2
1 2
sin a d R h z
s a
R a
Figure 3. Relevant to a generatrix.
2 1
2 2 2
2 2
π sin a d R h z
s h a
R a
(13)
The helix is obtained by projecting onto the scanning cylinder a proper spiral wrapping . The projection is obtained via the curves at = const [7,11]. The helix step, determined by two consecutive intersections with a given generatrix, is equal to the sample spacing
2 2N 1
required to interpolate the voltage along a generatrix. Note that , where Int(x) denotes the integer part of x, , and
Int 1
N N Int N W
11
is an oversampling factor that controls the truncation error [13]. The equations of the helix, when imposing its passage through a fixed point of the generatrix at = 0, are: 0
Q
cos sin cot
s s x d y d z d (14)wherein is the parameter describing the helix, s is
the value of at Q0, and k, k being a parameter related to the helix step by k 2 1 2
N1
. A nonredundant representation along the helix is then ob-tained by enforcing the optimal parameter for describ-ing it equal to W times the arclength of the project-ing point on the spiral wrappproject-ing and by choosing the related phase function coincident with that relevant to a generatrix. Moreover, the bandwidth W is chosen equal to times the length of the spiral wrapping from pole to pole [7].
By exploiting the above results, the reduced voltage at any point of the helix can be recovered [7] via the OSI expansion:
0
0 1
, , ,
m p
m m
m m p
V V G M
M (15)
where m0Int
s
is the index of thesam-ple nearest to the output point, 2p the number of retained samples V
m , and
2
2 1
m s
m s m M (16) with Mln t
M
1 and Mln t
W
1. More-over,
, m, ,M
M
m
DM
m
G M (17) wherein
sin 2
1
2
2 1 sin 2
M M M
D (18)
2
2
1 2 cos 2 cos 2
1 2 cos 2
M T M M T
(19)
are the Dirichlet and Tschebyscheff sampling functions, respectively, TM
being the Tschebyscheff polyno-mial of degree M MM and p .The OSI expansion (15) can be applied to evaluate the “intermediate samples”, namely, the reduced voltage va- lues at the intersection points between the helix and the generatrix passing through the observation point P. Once these samples have been determined, the reduced voltage at P can be evaluated by using a quite similar formula [7]. The following two-dimensional OSI expansion thus re-sults:
0 0 0 0 1 1 ( ), n n , , , , , , n q n q m pm n m
m m p
V G N N
V G M M
(20)where n0 Int
0
, 2q is the number of theretained intermediate samples V
n
, NNN,
s k n 0 nn n
(21) and the other symbols have the same meaning as in (15). Expansion (20) can be used to evaluate the voltage at any point P on the cylinder and, in particular, at those needed to perform the classical NF-FF transformation with cy-lindrical scanning [25].
3. Recovery of the Helicoidal Samples
Let us now turn to the case of irregularly spaced samples (Figure 2) and denote with
i, i
the nonuniform sampling point corresponding to the nearest uniform onei
0 0 0 0 1 1 , , , , , , ,1, 2, ,
n q
i i i n
n n q
m p
m n m
m m p
V G N N
V G M M
i Q
(22)where Q is the overall number of sampling points. Such a linear system can be rewritten in the matrix form
Axb, where A is the Q Q sparse matrix whose elements are
, , ,
, , ,
im i n n m
A G N N G M M (23) b is the vector of the collected nonuniform data, and x is the vector of the unknown uniform helicoidal samples.
By splitting A into its diagonal part D
A and nondi-agonal one , it results
AD
xb (24) multiplying both members of (24) by 1D
A and rear-ranging the terms, we get
1 1
D D
x A b A x (25) The following iterative procedure thus results
1 1 1 0 1
D D D
x A b A x x A x1 (26) where x is the vector of the uniform helicoidal sam-ples estimated at the th step. Necessary conditions for the convergence [19] are that Aii 0, i, and
,
ii im
A A m i. These conditions are certainly satis-fied in the here assumed hypothesis of one-to-one corre-spondence between each uniform helicoidal sampling point and the “nearest” nonuniform one. By straightfor-ward evaluations, we finally get:
0 0 0 0 1 1 11 , , , ,
, , ,
n q
i i i i n
n n q ii
m p
m n m
m m p m i
V V G N N
A
V G M M
(27) wherein
, , ,
, , ,
i iii i n n i
A G N N G M M (28)
0
Nint
i i
n being the index of the inter-mediate sampling point nearest to the uniform one i.
4. Numerical Simulations
The numerical simulations refer to a uniform planar array
of 0.6 spaced elementary Huygens sources, polarized along the z axis and covering a zone in the plane y = 0, formed by a rectangle ended in two half-circles (see Fig- ure 2). The rectangle sizes are: 2a 14 and h 54
13 . The helix wraps a cylinder having radius d and height h180 . An open-ended WR-90 rectangular waveguide, at the frequency of 10 GHz, is chosen as probe. The nonuniform samples have been generated by imposing that the distances in and between the posi-tion of each nonuniform sample and the associate uni-form one on the helix are random variables uniuni-formly distributed in
0.3, 0.3
and
0.3, 0.3
,which represents a pessimistic occurrence in a real scan-ning procedure.
A reconstruction example of the voltage V1 (the most significant one) on the generatrix at = 90˚, obtained by 0 and 6 iterations, is shown in Figures 4 and 5, respec-tively. As can be seen, 6 iterations are enough to get a very good recovery. The evaluation of the mean-square errors (normalized to the voltage maximum on the cylin-der) in the reconstruction of the uniform samples as-sesses more quantitatively the effectiveness of the tech-nique. They have been determined by comparing the re-constructed helicoidal samples and the exact ones in the central zone of the scanning surface, to assure the exis-tence of the guard samples. As can be seen (Figure 6), on increasing the number of iterations, the errors de-crease quickly until a constant saturation value is at-tained. This value decreases on increasing the number of retained samples. Even smaller errors are to be expected when the nonuniform samples are nearer to the uniform ones. The stability of the approach has been assessed (Figure 7) by corrupting the exact samples with random errors. Both a background noise (bounded to a in am-plitude and with arbitrary phase) and uncertainties on the data of ar in amplitude and ± in phase have been
[image:5.595.59.287.523.663.2]simulated. The reconstructions of the FF pattern in the
[image:5.595.309.536.543.694.2]Figure 5. Amplitude of the probe voltage on the generatrix at φ = 90˚. Solid line: exact. Crosses: recovered at the itera-tion 6.
Figure 6. Normalized mean-square errors in the reconstruc-tion of the uniform samples.
Figure 7. Amplitude of the probe voltage on the generatrix at φ = 90˚. Solid line: exact. Crosses: recovered at the itera-tion 6 from error affected data.
principal planes are shown in Figures 8 and 9. As can be seen, the exact and recovered fields are indistinguishable, thus providing an overall assessment of the technique.
Note that the number of used samples for reconstruct-ing the NF data over the considered cylinder is 29,260, about one half than that (46,080) needed by the standard cylindrical scanning and by the helicoidal scanning tech-nique [14].
5. Experimental Validation
The described technique has been experimentally vali-dated in the anechoic chamber available at the UNISA Antenna Characterization Lab. The chamber, whose di-mensions are 8 m × 5 m × 4 m, is equipped with an ad-vanced cylindrical NF facility supplied by MI Tech- nologies. An open-ended WR90 rectangular waveguide is used as probe. The AUT, located in the plane x = 0, is a very simple H-plane monopulse antenna, operating at 10 GHz in the sum mode. It has been realized by using two pyramidal horns (8.9 × 6.8 cm) made by Lectronic Research Labs at a distance of 26 cm (between centers) and a hybrid Tee (Figure 10). According to the described sampling representation, the AUT has been modelled as enclosed in a rounded cylinder having h' = 36 cm and
[image:6.595.309.535.356.508.2]
Figure 8. E-plane pattern. Solid line: exact. Crosses: recon-structed from nonuniform NF data.
[image:6.595.60.286.487.648.2] [image:6.595.309.537.549.709.2]Figure 10. Photo of the monopulse antenna.
a' = 4.2 cm. The helix lies on a cylinder with d = 17.5 cm and h = 240 cm. To assess the effectiveness of the tech-nique in severe conditions as in the case of measurements performed by using bad positioning systems, we have enforced the acquisition of the NF data in such a way that the distances in and between the position of each nonuniform sample and the associate uniform helicoidal one are random variables uniformly distributed in
0.3, 0.3
and
0.3, 0.3
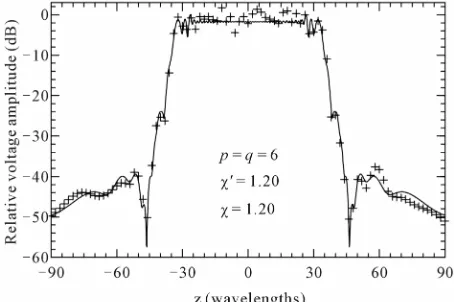
. It is worth not- ing that no optical device has been used to read the actual sampling positions, since those given by the employed positioners were more than safe.The amplitude and phase of the probe voltage relevant to the generatrix at = 0˚ reconstructed by using 10 it-erations are compared in Figures 11 and 12 with those directly measured. According to Figure 6, such a number of iterations ensures the algorithm convergence with very low errors. Note that the phase is shown only in the range [–20 cm, 120 cm] to improve the readability. As can be seen, although the considered positioning errors are very pessimistic in an actual scanning procedure, there is an excellent agreement between the recovered voltage and the measured one, save for the peripheral zone wherein the error is caused both by the truncation of the scanning area and by the environmental reflections. The smoother behaviour of the reconstructed voltage with respect to the measured one is due to the filtering properties of the in-terpolation functions which cut away the spatial harmon-ics of the noise sources outside the AUT spatial band-width.
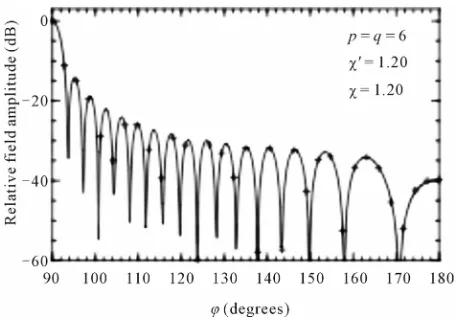
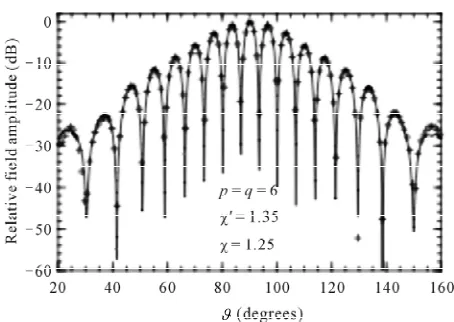
At last, the FF patterns in the principal planes E and H recovered from the irregularly spaced helicoidal NF data
are compared in Figures 13 and 14 with those (refer-ences) obtained from the data directly measured on the classical cylindrical grid. In both the cases, the software package MI-3000 has been used to get the FF reconstruc-tions. Obviously, once the uniform data have been re-trieved, the OSI algorithm has been used to recover the cylindrical data needed to carry out the NF-FF transfor-mation.
Note that all the reported reconstructions have been obtained by using 1.35, 1.25, and p = q = 6.
It is interesting to compare the number of acquired nonuniform NF data (1512) with that (5760) required by the traditional cylindrical and helicoidal scanning tech-niques [14] to cover the same measurement zone.
6. Conclusions
An effective iterative technique for compensating the probe positioning errors in the NF-FF transformation with helicoidal scanning using a cylinder ended in two
Figure 11. Amplitude of the probe voltage on the generatrix at φ = 0˚. Solid line: measured. Crosses: recovered from irregularly spaced NF data.
[image:7.595.309.536.541.694.2]Figure 13. E-plane pattern. Solid line: reference. Crosses: recovered from irregularly spaced NF data.
Figure 14. H-plane pattern. Solid line: reference. Crosses: recovered from irregularly spaced NF data.
half-spheres to model an electrically long antenna has been here proposed. In particular, the helicoidal NF data at the points fixed by the sampling representation are efficiently reconstructed from the acquired irregularly spaced ones, whose positions are known. Once the heli-coidal data have been retrieved, those needed by a clas-sical NF-FF transformation with cylindrical scanning are efficiently evaluated via the two-dimensional OSI algo-rithm. The effectiveness of the approach has been as-sessed both numerically and experimentally.
REFERENCES
[1] R. G. Yaccarino, L. I. Williams and Y. Rahmat-Samii, “Linear Spiral Sampling for the Bipolar Planar Antenna Measurement Technique,” IEEE Transactions on Anten-nas and Propagation, Vol. AP-44, No. 7, 1996, pp. 1049- 1051. doi:10.1109/8.504314
[2] O. M. Bucci, C. Gennarelli, G. Riccio and C. Savarese, “Nonredundant NF-FF Transformation with Helicoidal Scanning,” Journal of Electromagnetic Waves and Ap-plications, Vol. 15, No. 11,2001, pp. 1507-1519.
doi:10.1163/156939301X00076
[3] O. M. Bucci, F. D’Agostino, C. Gennarelli, G. Riccio and C. Savarese, “Probe Compensated FF Reconstruction by NF Planar Spiral Scanning,” IEE Proceedings, Micro-waves Antennas and Propagation, Vol. 149, No. 2,2002, pp. 119-123. doi:10.1049/ip-map:20020265
[4] O. M. Bucci, F. D’Agostino, C. Gennarelli, G. Riccio and C. Savarese, “NF-FF Transformation with Spherical Spi-ral Scanning,” IEEE Antennas and Wireless Propagation Letters, Vol. 2, 2003, pp. 263-266.
doi:10.1109/LAWP.2003.820710
[5] F. D’Agostino, C. Gennarelli, G. Riccio and C. Savarese, “Theoretical Foundations of Near-Field-Far-Field Trans-formations with Spiral Scannings,” Progress in Electro-magnetics Research, Vol. PIER 61, 2006, pp. 193-214. doi:10.2528/PIER06021401
[6] F. D’Agostino, F. Ferrara, C. Gennarelli, R. Guerriero and M. Migliozzi, “Near-Field-Far-Field Transformation Technique with Helicoidal Scanning for Elongated An-tennas,” Progress in Electromagnetics Research B, Vol. 4, 2008,pp. 249-261. doi:10.2528/PIERB08011503
[7] F. D’Agostino, F. Ferrara, J. A. Fordham, C. Gennarelli, R. Guerriero, M. Migliozzi, G. Riccio and C. Rizzo, “An Effective NF-FF Transformation Technique for Elongated Antennas Using a Fast Helicoidal Scan,” IEEE Antennas and Propagation Magazine, Vol. 51, No. 4, 2009, pp. 134-141. doi:10.1109/MAP.2009.5338700
[8] F. D’Agostino, F. Ferrara, C. Gennarelli, R. Guerriero and M. Migliozzi, “Laboratory Tests Assessing the Effec-tiveness of the NF-FF Transformation with Helicoidal Scanning for Electrically Long Antennas,” Progress in Electromagnetics Research, Vol. PIER 98, 2009, pp. 375-388. doi:10.2528/PIER09092303
[9] F. D’Agostino, F. Ferrara, C. Gennarelli, R. Guerriero and M. Migliozzi, “An Effective NF-FF Transformation Technique with Planar Spiral Scanning Tailored for Quasi- Planar Antennas,” IEEE Transactions on Antennas and Propagation, Vol. 56, No. 9, 2008, pp. 2981-2987. doi:10.1109/TAP.2008.928786
[10] F. D’Agostino, F. Ferrara, C. Gennarelli, R. Guerriero, M. Migliozzi and G. Riccio, “A Nonredundant Near-Field to Far-Field Transformation with Spherical Spiral Scanning for Nonspherical Antennas,” The Open Electrical & Elec-tronic Engineering Journal, Vol. 3, 2009, pp. 1-8. doi:10.2174/1874129000903010001
[11] F. D’Agostino, F. Ferrara, C. Gennarelli, R. Guerriero, and M. Migliozzi, “The Unified Theory of Near-Field- Far-Field Transformations with Spiral Scannings for Nonspherical Antennas,” Progress in Electromagnetics Research B, Vol. 14, 2009, pp. 449-477.
doi:10.2528/PIERB09031808
[12] O. M. Bucci, C. Gennarelli and C. Savarese, “Representa-tion of Electromagnetic Fields over Arbitrary Surfaces by a Finite and Nonredundant Number of Samples,” IEEE Transactions on Antennas and Propagation, Vol. 46, No. 3, 1998, pp. 351-359. doi:10.1109/8.662654
[image:8.595.58.285.279.440.2]No. 11, 1991, pp. 1633-1643. doi:10.1109/8.102779 [14] S. Costanzo and G. Di Massa, “Far-Field Reconstruction
from Phaseless Near-Field Data on a Cylindrical Helix,” Journal of Electromagnetic Waves and Applications,Vol. 18, No. 8, 2004, pp. 1057-1071.
doi:10.1163/1569393042955414
[15] S. Costanzo and G. Di Massa, “Near-Field to Far-Field Transformation with Planar Spiral Scanning,” Progress in Electromagnetics Research, Vol. PIER 73, 2007, pp. 49-59. doi:10.2528/PIER07031903
[16] A. Dutt and V. Rohklin, “Fast Fourier Transforms for Nonequispaced Data,” Proceedings of SIAM Journal Sci-entific Computation, Vol. 14, No. 6,1993, pp. 1369-1393. [17] R. Wittmann, B. K. Alpert and M. H. Francis, “Near-
Field Antenna Measurements Using Nonideal Measure-ment Locations,” IEEE Transactions on Antennas and Propagation, Vol. 46, No. 5, 1998, pp. 716-722.
doi:10.1109/8.668916
[18] R. C. Wittmann, B. K. Alpert and M. H. Francis, “Near- Field, Spherical Scanning Antenna Measurements with Nonideal Probe Locations,” IEEE Transactions on An-tennas and Propagation, Vol. 52, No. 8, 2004, pp. 2184- 2186. doi:10.1109/TAP.2004.832316
[19] O. M. Bucci, C. Gennarelli and C. Savarese, “Interpola-tion of Electromagnetic Radiated Fields over a Plane from Nonuniform Samples,” IEEE Transactions on Antennas and Propagation, Vol.AP-41, No. 11, 1993, pp. 1501- 1508. doi:10.1109/8.267349
[20] F. Ferrara, C. Gennarelli, G. Riccio and C. Savarese, “NF-FF Transformation with Cylindrical Scanning from Nonuniformly Distributed Data,” Microwave and Optical
Technology Letters, Vol. 39, No. 1, 2003, pp. 4-8. doi:10.1002/mop.11109
[21] F. D’Agostino, F. Ferrara, C. Gennarelli, R. Guerriero and M. Migliozzi, “On the Compensation of Probe Posi-tioning Errors When Using a Nonredundant Cylindrical NF-FF Transformation,” Progress in Electromagnetics ResearchB,Vol. 20, 2010, pp. 321-335.
doi:10.2528/PIERB10032402
[22] G. H. Golub and C. F. Van Loan, “Matrix Computations,” J. Hopkins University Press, Baltimore, 1996.
[23] F. D’Agostino, F. Ferrara, C. Gennarelli, R. Guerriero, and M. Migliozzi, “Near-Field - Far-Field Transformation with Helicoidal Scanning from Irregularly Spaced Data,” International Journal of Antennas and Propagation, Vol. 2010, 2010, Article ID: 859396.
doi:10.1155/2010/859396
[24] F. D’Agostino, F. Ferrara, C. Gennarelli, R. Guerriero and M. Migliozzi, “An Iterative Technique to Compen-sate for Positioning Errors in the NF-FF Transformation with Helicoidal Scanning for Long Antennas,” Progress in Electromagnetics Research C, Vol. 18, 2011, pp. 73-86. doi:10.2528/PIERC10102801
[25] W. M. Leach Jr. and D. T. Paris, “Probe Compensated Near-Field Measurements on a Cylinder,” IEEE Transac-tions on Antennas and Propagation, Vol. AP-21, No. 4, 1973, pp. 435-445. doi:10.1109/TAP.1973.1140520 [26] O. M. Bucci, G. D’Elia and M. D. Migliore, “Advanced