PREVALENCE AND ASSOCIATED FACTORS OF OBESITY AMONG ADULTS IN TAMIL NADU STATE,
1,*
Rajalakshmi Murugan
1
Ph.D Research Scholar, Faculty of Pharmacy and Paramedical Sciences (Nursing),
Himalayan University, Arunachal Pradesh, India
2
Professor, College of Nursing, College of Nursing, Mother Theresa Post Graduate Institute of Health Sciences
ARTICLE INFO ABSTRACT
The world health organization has described obesity as one of today’s most neglected public health problems, affecting developed and developing countries in the world.
more frequently with overweight, obesity, and their consequences. This study was aimed to determine the prevalence and associate factors of obesity among adults in Theni district, Tamil Nadu State, India. Study design was cross
government hospitals and primary health center (PHC’s) in Theni District. 680 samples were collected with convenient sampling technique. Appropriate descriptive and analytical (frequency, standard deviation, binary logistic regression) were used to determine the prevalence and statistical significant association between the variables with SPSS version 20.
overweight/obese among adults was 52.4%, more over females o and in males overweight/obese was 23.4
marital status, occupation, income meat/egg consumption and snack consumption were statistically significant association with O
78.5% than male 49.6%. In Bivariate analysis result shows age between 18
likely to be obese than those who are greater than or equal to 50 years [ (COR=1.55(1.03 Multivariate logistic analysis result revels that the likely hood be being obese among respondents of married living with partners were 1.76 times higher than those who were separated and diverted [AOR= 1.76(1.12, 2.78)], and Prevalence of male
AOR=0.64 (0.42, 0.97). The prevalence of obesity was also 0.44 times lower among Hindus than other religions [AOR=0.44(0.21
south India. Hence, t
prevent the epidemic of obesity and its allied health disasters in South India.
Copyright©2016, Rajalakshmi Murugan and Maria Therese
permits unrestricted use, distribution, and reproduction in any medium, provided the original work is properly cited.
INTRODUCTION
The world health organization has described obesity as today’s most neglected public health problems affecting every region of the globe (Pednekar, 2008). Obesity has also emerged as a major public health challenge in south Asian countries. Obesity has reached epidemic proportions in India in the 21 century with morbid obesity affecting 5% of the country’s population. (http//www/Bangok 2002/ S7Aqrawal,Pdf.
*Corresponding author: Rajalakshmi Murugan,
Ph.D Research Scholar, Faculty of Pharmacy and Paramedical Sciences (Nursing), Himalayan University, Arunachal Pradesh, India.
ISSN: 0975-833X
Vol.
Article History:
Received 23rd June, 2016
Received in revised form 09th July, 2016
Accepted 05th August, 2016 Published online 20th September,2016
Citation: Rajalakshmi Murugan and Maria Therese
International Journal of Current Research, 8, (09), 38193
Key words: Prevalence, Obesity, Adult, Tamil Nadu, South India.
RESEARCH ARTICLE
PREVALENCE AND ASSOCIATED FACTORS OF OBESITY AMONG ADULTS IN TAMIL NADU STATE,
SOUTH INDIA
Rajalakshmi Murugan and
2Maria Therese
Ph.D Research Scholar, Faculty of Pharmacy and Paramedical Sciences (Nursing),
Himalayan University, Arunachal Pradesh, India
Professor, College of Nursing, College of Nursing, Mother Theresa Post Graduate Institute of Health Sciences
and Research, Puducherry, India
ABSTRACT
The world health organization has described obesity as one of today’s most neglected public health problems, affecting developed and developing countries in the world.
more frequently with overweight, obesity, and their consequences. This study was aimed to determine the prevalence and associate factors of obesity among adults in Theni district, Tamil Nadu State, India. Study design was cross-sectional and institutional based study. Data was collected in government hospitals and primary health center (PHC’s) in Theni District. 680 samples were collected with convenient sampling technique. Appropriate descriptive and analytical (frequency, ard deviation, binary logistic regression) were used to determine the prevalence and statistical significant association between the variables with SPSS version 20.
overweight/obese among adults was 52.4%, more over females overweight/obese was 22.8% and in males overweight/obese was 23.4-22%. Prevalence of obesity/overweight (BMI) age, gender, marital status, occupation, income meat/egg consumption and snack consumption were statistically significant association with Obesity (BMI) (P< P<0.05). Abdominal obesity increased in female 78.5% than male 49.6%. In Bivariate analysis result shows age between 18
likely to be obese than those who are greater than or equal to 50 years [ (COR=1.55(1.03 Multivariate logistic analysis result revels that the likely hood be being obese among respondents of married living with partners were 1.76 times higher than those who were separated and diverted [AOR= 1.76(1.12, 2.78)], and Prevalence of male respondents was 0.64 times lower than female AOR=0.64 (0.42, 0.97). The prevalence of obesity was also 0.44 times lower among Hindus than other religions [AOR=0.44(0.21-094)]. An increasing prevalence of obesity was seen epically in south India. Hence, there is an urgent need to address the trouble and efforts should be made to prevent the epidemic of obesity and its allied health disasters in South India.
Rajalakshmi Murugan and Maria Therese. This is an open access article distributed under the Creative Commons Att use, distribution, and reproduction in any medium, provided the original work is properly cited.
The world health organization has described obesity as one of today’s most neglected public health problems affecting every ). Obesity has also emerged as a major public health challenge in south Asian countries. Obesity has reached epidemic proportions in India in the 21st
entury with morbid obesity affecting 5% of the country’s http//www/Bangok 2002/ S7Aqrawal,Pdf.)
Rajalakshmi Murugan,
Ph.D Research Scholar, Faculty of Pharmacy and Paramedical , Arunachal Pradesh, India.
In south India the percentage of women and men who are overweight or obese is highest in kerela 34.3
Tamil Nadu 24.4, and Andhra Pradesh 22.7 Umnikrishnan, 2012). According to the percentage of family Health survey (NFHS)
women age 15-45 years who are overweight or obese increased from 11% in NFHS-2 to15% in NFHS
obesity are both higher in women than man due to higher in
women than man due to lesser physical activity.
(http://www.nfhsindia.org/nfhs3.html
2012). India is currently witnessing rising number of people in the middle class who are obese.
International Journal of Current Research
Vol. 8, Issue, 09, pp.38193-38200, September, 2016
INTERNATIONAL
Rajalakshmi Murugan and Maria Therese. 2016. “Prevalence and associated factors of obesity among adults in Tamil Nadu state, South India 38193-38200.
PREVALENCE AND ASSOCIATED FACTORS OF OBESITY AMONG ADULTS IN TAMIL NADU STATE,
Ph.D Research Scholar, Faculty of Pharmacy and Paramedical Sciences (Nursing),
Professor, College of Nursing, College of Nursing, Mother Theresa Post Graduate Institute of Health Sciences
The world health organization has described obesity as one of today’s most neglected public health problems, affecting developed and developing countries in the world. Indians now report more and more frequently with overweight, obesity, and their consequences. This study was aimed to determine the prevalence and associate factors of obesity among adults in Theni district, Tamil Nadu State, sectional and institutional based study. Data was collected in government hospitals and primary health center (PHC’s) in Theni District. 680 samples were collected with convenient sampling technique. Appropriate descriptive and analytical (frequency, ard deviation, binary logistic regression) were used to determine the prevalence and statistical significant association between the variables with SPSS version 20. The overall prevalence rate of verweight/obese was 22.8% -34.8% 22%. Prevalence of obesity/overweight (BMI) age, gender, marital status, occupation, income meat/egg consumption and snack consumption were statistically besity (BMI) (P< P<0.05). Abdominal obesity increased in female 78.5% than male 49.6%. In Bivariate analysis result shows age between 18-34 were 1.55 times more likely to be obese than those who are greater than or equal to 50 years [ (COR=1.55(1.03,2.34)], Multivariate logistic analysis result revels that the likely hood be being obese among respondents of married living with partners were 1.76 times higher than those who were separated and diverted respondents was 0.64 times lower than female AOR=0.64 (0.42, 0.97). The prevalence of obesity was also 0.44 times lower among Hindus than An increasing prevalence of obesity was seen epically in here is an urgent need to address the trouble and efforts should be made to prevent the epidemic of obesity and its allied health disasters in South India.
under the Creative Commons Attribution License, which
In south India the percentage of women and men who are obese is highest in kerela 34.3, followed by Tamil Nadu 24.4, and Andhra Pradesh 22.7 (Kalra and ). According to the percentage of National the percentage of ever- married 45 years who are overweight or obese increased 2 to15% in NFHS-3,Overweight and obesity are both higher in women than man due to higher in
ue to lesser physical activity.
://www.nfhsindia.org/nfhs3.html). Accessed on 6 march, India is currently witnessing rising number of people in the middle class who are obese.
INTERNATIONAL JOURNAL OF CURRENT RESEARCH
Prevalence of obesity in higher in women aged between 25 to 50 years than men in Delhi, India (Guptha and Kappor, 2010) prevalence of obesity was higher level among 12 standard educated participants and other factors associated with prevalence of obesity was physical activity, food habits, less intake of energy dense diet, TV watching resulted in changes in life style in rural areas (Ramachandran and Snehalatha, 2010).
Objective
To explore epidemiological data on the prevalence and associate factors of obesity among adults in Theni District, Tamil Nadu state, India.
MATERIALS AND METHODS
Study SettingsTheni District was selected as study area for this study. It is a one of the agriculture districts in Tamil Nadu state in South India. Theni is a district headquarters. Theni district has eight taluks such as Periyakulam, Uthamapalayam, Theni, Bodinayakanur, Andipatti, Chinnamanur, Myladumbarai, and Cumbum. It has 6 government hospitals and one medical college hospital, 30 primary Health centers, 30 private hospitals, and 90 clinics and nursing homes. Study period was 2013-2016.
Study design
A cross-sectional institutional based study was conducted
Source of population: All adult clients attending the government hospitals and primary health centers in Theni district, Tamil Nadu State.
Study population: Study Population were all the adult clients attending the health faculties, who have been attending Hospital/ primary health center during the data collection period they were selected as sample population
Inclusive criteria:
Clients age factor 18-60 years
Those who have willing to participate in this study
Exclusive criteria
Client age below 18 and above 60
Clients who were mentally and physically incapable to participate in this study Sample size determination
Sample size was calculated using the formula to estimate a single Population proportions.
Sample size for to assess the prevalence of Obesity
The sample size required for the quantitative study
n = (Z α/2) 2 p (1-p) d2
where z is the percentile of the standard normal distribution, p is expected prevalence and d is the desired precision, with the assumption of prevalence of obesity being 27.3% with 5% level of significance, a design effect of 2 and an addition of 10% non response rate, with those assumptions stat Calc application of EPI Info 3.5.1 was used for calculation ultimately, the minimum required sample was 680.
Sampling procedure
In Theni district has six Government Hospitals, one medical college hospital and 30 primary health centres were present, in this one government hospital and 2 PHC were selected by using lottery method. Respondents were selected principally using a convenient sampling technique.
Data collection Instruments
A structured administered questionnaire adapted from literatures. The data collection instrument consist of Part –I Socio demographic data it has age, sex, marital status, education, type of occupation, and income. Part –II Screening of clients using risk assessment tool, it has BMI (Height and weight), WHR, and to classify obesity.
Data collection procedure
Before going to the data collection, pretest was done on5% of similar clients in different government hospital. Data were collected through face to face interview method .Data collectors were two male and two female diploma nurses and one supervisor. All data collectors and supervisor were trained for two days on their responsibilities for describing the purpose of the study, how to collect the data, specially about how to take weight, height, WC, WHR and telling clients the importance of honest and genuine reply towards the questions. The principal investigator and supervisors strictly follow the overall activities of the data collection on daily base to ensure the completeness of questionnaire and to give further clarification.
Data quality assurance and management
Data collector and supervisor were trained prior to conduct the data collection. Training was given for two day on the purpose of the study, details of the questionnaire, and insuring confidentiality of the respondents. For better communication during interview the original English version questionnaire was translated in to Tamil version questionnaire before actual data collection activities. 5% of pre test was done. Validation of questionnaire was done by particular field of expatriates, given correction and suggested questionnaires taken in to consideration and amendment was done before data collection.
Dependent Variables: Obesity
Data processing and analysis
Data were entered in to Epi Data version 3.1 and exported and analyzed using SPSS Software version 20. Mean, Standard deviation, frequencies, percentage, Chi-square test and odds ratio were calculated. Binary and multiple logistic regression analysis were determined to assess the association between independent and dependent variables. The strength of statistical association was measured by odds ratio and 95%confidence intervals and statistical significance was considered at P<0.05.
Definitions
Anthropometric measurements
Weight: Weight was measured in the upright position to the nearest 0.1 kg using calibrated weighing scale.
Height: Height was measured without shoes to the nearest 0.1 cm using calibrated stadiometer.
Body mass index (BMI): Body mass index was calculated by dividing observed weight by height squared (kg/m 2).
Waist circumference (in centimetres): Waist circumference was measured using a non-stretchable measuring tape. Waist circumference was measured at the nearest 0.1 cm at the narrowest point between lower end of the rib cage and iliac crest at the end of expiration.
BMI classification: Subjects were classified using WHO classification and classification recommended for Asians for BMI. Categories as per WHO classification are <18.5 kg/m 2 as underweight, 18.5-24.99 kg/m 2 as normal, 25.0-29.99 kg/m 2 as overweight and ≥30.0 kg/m 2 as obese. Categories as per Asian classification are <18.5 kg/m 2 as
below normal, 18.5-22.99 kg/m 2 as normal, 23.0-27.4
kg/m 2 as increased risk, ≥27.5 kg/m 2 as high risk.
Central obesity/Abdominal obesity: Central obesity was
defined as WC ≥ 90 cm for men and WC ≥ 80 cm for women.
Generalized obesity (GO): Generalized obesity was defined as a BMI ≥ 25 kg/m2 for both genders (based on the World Health Organization Asia Pacific Guidelines)
Overweight: Overweight was defined as a BMI ≥23 kg/m2 but
<25 kg/m2 for both genders (based on the World Health Organization Asia Pacific Guidelines)
Ethical consideration: Ethical clearance was obtained from institutional review board of Faculty of Pharmacy and Paramedical Sciences (Nursing), Himalayan University, Arunachal Pradesh. Permission was obtained from Andipatti Government hospital and two health centers for their cooperation to conduct the study in the health facilities. Each study participant was adequately informed about the purpose, method and anticipated benefit and risk of the study and the right to withdraw from the study any time by their data collectors. Oral Informed consent was obtained from each study participants.
RESULTS
The total number of participants was 680 and the response rate was 680 (100%), and the socio-demographic of the respondents distribution related to the sex female respondents were 394(57.9%) and Male were 286(42.1%). About the age of the respondents 245(36%) were between the age of 35-49, above 50 years were 209(30.7%) and the mean age of the respondents were 41.32. Majority 632(92.9%) of respondents were Hindu religion and 21(3.1%) were Muslims. About Marital status majority of them married 581(85.4%), and divorced were22(3.2%). Educational status of the respondents 196(28.8%) were able read and write only, 29(4.3%) were undergraduate and above education. About occupation of the
respondents majority 296(43.5%) were daily labour,
145(21.3%) were house wives, and 11(1.6%) were unemployed. Majority 237(34.9%) were received income between 1000-3000 rupees, 181(26.6%) were received between 3001-5000 rupees and 44(6.5%) were received > 15000 rupees.
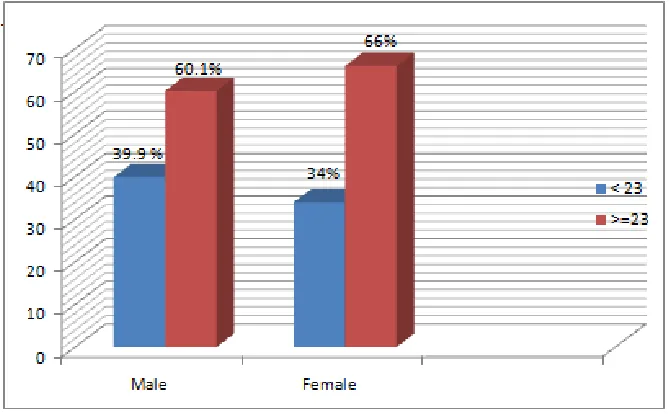
This study reveals that prevalence of overweight 90(22.8%) were among female and 67(23.4%) were among males study participants. About obesity 137(34.8%) were among females than males. Majority 270(78.5%) of the females had Central obesity and 375(95.2%) were female had above normal WHR Figure 1 shows the distribution of the BMI among sex of the study participants. Total of male Participants were 286, in this participant BMI <23 among males were 114 (39.9%) and BMI of >= 23 participant were 173 (60.1%). Total females participants were 394 among this females BMI <23 were 134(34%) and BMI of >= 23 participant were 260(66%). The results of the studied respondents sample revealed that 16(2.4%) underweight, 307(45.1%) were normal, 157(23.1%) were overweight and 200(29.4%) were obese. The prevalence rate of obesity and overweight by sex and age was found to be significant (p= 0.001). prevalence of overweight and obese among marital status of the respondents particularly married participants 24.4% and 30.3% was found to be significant(p =0.000). The prevalence of obesity and overweight was found
to be higher among Hindu religion 23.1% and
28.5%respectively than those who were in other religion. However, this variation was not statistically significant (p = 0.439). Regarding educational status of the respondents, prevalence of obesity and overweight was found to be higher among illiterates was 32.7% and 30.9%. However, this variation was not statistically significant (p= 0.382. concerning to occupation of the respondents of prevalence rate of obesity and overweight was found to be significant (p= 0.001). The prevalence rate of obesity and overweight by income of the respondents was found to be significant (p= 0.001).
Description of the proportions of obesity categories by age ranges
Table 1. Distribution of socio-demographic characteristic of clients in Theni District, Tamil Nadu State, 2016
Characteristics Frequency (n=680) Percentage (%)
Sex M 286 42.1
F 394 57.9
Age 18-34 226 33.2
35-49 245 36.0
>50 209 30.7
Religion Hindu 632 92.9
Christian 27 4.0
Muslim 21 3.1
Marital status Single 50 7.4
Married 581 85.4
Divorced 22 3.2
Widow 27 4.0
Educational status Illiterate 55 8.1 read and write only 196 28.8
1-7 std 175 25.7
8-10 std 161 23.7
+2 – diplama 64 9.4
undergraduat degree and above 29 4.3
Occupation Unemployed 11 1.6
House wife 145 21.3
Farmer 77 11.3
Daily labour 296 43.5
Student 18 2.6
Govt worker 71 10.4
private worker 50 7.4
Merchant/business 12 1.8
Income <1000 94 13.8
1000-3000 237 34.9
3001-5000 181 26.6
5001-10000 69 10.1
10001- 15000 55 8.1
[image:4.595.157.447.428.480.2]> 15000 44 6.5
Table 2. Prevalence of overweight, Obesity and central obesity by sex among study participants in Theni District, Tamil Nadu, 2016
Characteristics Female No% Male No% Total (%) Overweight 90 (22.8%) 67 (23.4%) 157 (23 %) Obesity 137(34.8) 63 (22%) 200 (29.4%) Abdominal Obesity 270 ( 78.5%) 242 ( 49.6%) 512(75.2%) Waist Hip Ratio 375 ( 95.2%) 134 ( 46.9%) 509(74.85) BMI ≥ 23 overweight, Obesity ≥ 25 kg/m2 , Abdominal obesity ≥80cm for female and ≥90cm for male , WHR ≥0.90 for male, ≥0.80 for female.
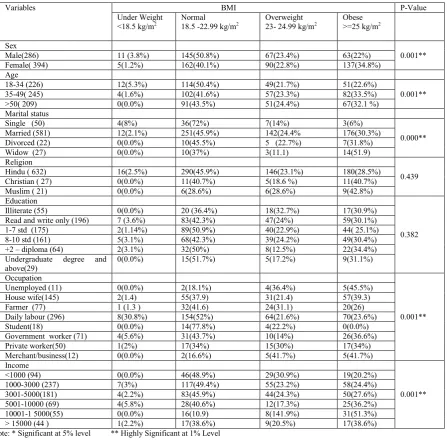
[image:4.595.139.474.520.727.2]Table 3. Socio Demographic Characteristics of the Respondents with BMI Category in Theni District, Tamil Nadu, 2016
Variables BMI P-Value Under Weight
<18.5 kg/m2
Normal 18.5 -22.99 kg/m2
Overweight 23- 24.99 kg/m2
Obese >=25 kg/m2
Sex
0.001** Male(286) 11 (3.8%) 145(50.8%) 67(23.4%) 63(22%)
Female( 394) 5(1.2%) 162(40.1%) 90(22.8%) 137(34.8%) Age
18-34 (226) 12(5.3%) 114(50.4%) 49(21.7%) 51(22.6%)
0.001** 35-49( 245) 4(1.6%) 102(41.6%) 57(23.3%) 82(33.5%)
>50( 209) 0(0.0%) 91(43.5%) 51(24.4%) 67(32.1 %) Marital status
Single (50) 4(8%) 36(72%) 7(14%) 3(6%)
0.000** Married (581) 12(2.1%) 251(45.9%) 142(24.4% 176(30.3%)
Divorced (22) 0(0.0%) 10(45.5%) 5 (22.7%) 7(31.8%)
Widow (27) 0(0.0%) 10(37%) 3(11.1) 14(51.9)
Religion
0.439 Hindu ( 632) 16(2.5%) 290(45.9%) 146(23.1%) 180(28.5%)
Christian ( 27) 0(0.0%) 11(40.7%) 5(18.6 %) 11(40.7%) Muslim ( 21) 0(0.0%) 6(28.6%) 6(28.6%) 9(42.8%) Education
0.382 Illiterate (55) 0(0.0%) 20 (36.4%) 18(32.7%) 17(30.9%)
Read and write only (196) 7 (3.6%) 83(42.3%) 47(24%) 59(30.1%) 1-7 std (175) 2(1.14%) 89(50.9%) 40(22.9%) 44( 25.1%) 8-10 std (161) 5(3.1%) 68(42.3%) 39(24.2%) 49(30.4%) +2 – diploma (64) 2(3.1%) 32(50%) 8(12.5%) 22(34.4%) Undergraduate degree and
above(29)
0(0.0%) 15(51.7%) 5(17.2%) 9(31.1%)
Occupation
0.001** Unemployed (11) 0(0.0%) 2(18.1%) 4(36.4%) 5(45.5%)
House wife(145) 2(1.4) 55(37.9) 31(21.4) 57(39.3) Farmer (77) 1 (1.3 ) 32(41.6) 24(31.1) 20(26) Daily labour (296) 8(30.8%) 154(52%) 64(21.6%) 70(23.6%) Student(18) 0(0.0%) 14(77.8%) 4(22.2%) 0(0.0%) Government worker (71) 4(5.6%) 31(43.7%) 10(14%) 26(36.6%) Private worker(50) 1(2%) 17(34%) 15(30%) 17(34%) Merchant/business(12) 0(0.0%) 2(16.6%) 5(41.7%) 5(41.7%) Income
0.001** <1000 (94) 0(0.0%) 46(48.9%) 29(30.9%) 19(20.2%)
1000-3000 (237) 7(3%) 117(49.4%) 55(23.2%) 58(24.4%) 3001-5000(181) 4(2.2%) 83(45.9%) 44(24.3%) 50(27.6%) 5001-10000 (69) 4(5.8%) 28(40.6%) 12(17.3%) 25(36.2%) 10001-1 5000(55) 0(0.0%) 16(10.9) 8(141.9%) 31(51.3%) > 15000 (44 ) 1(2.2%) 17(38.6%) 9(20.5%) 17(38.6%) Note: * Significant at 5% level ** Highly Significant at 1% Level
[image:5.595.73.521.95.535.2]The multivariate linear regression model (Table- 4) had an R-squared value of 0.10, indicating 10% of the variance in BMI among participants was explained by the variables included in the model. After adjustment for potential confounders, there existed positive associations between BMI and age, sex, marital status, meat/egg consumption and snack consumption. There were inverse association between BMI and educational status, occupation, physical activity, vegetable consumption, soft drink and juice consumption. This study finding analysis was repeated the analysis using log – transformed BMI to improve normality of residuals and homoscedasticity. As the results were very similar; so, result
was presented here the fitted coefficients without
transformation for ease of interpretation.
Factors associated with BMI and different back ground of the Respondents in Theni District, Tamil Nadu state, 2016. (Table 5)
[image:6.595.144.453.257.373.2]In this study the association of different background factors with having BMI of greater than 23(obesity) was investigated using bivariate and multivariate logistic regression. On bivariate analysis respondents with age of between 18 and 34 were 0.68 times less likely to be obese compared to those who are greater than or equal to 50 years old [COR=0.68(0.46, 0.99)]. On the other hand those who are in age group between 35-49 were 1.55 times more likely to be obese than those who are greater than or equal to 50 years [COR=1.55(1.03,2.34)].
Table 4. Factors Associated with BMI of respondents in Theni district, Tamil Nadu state based on a multivariable analysis
Variables Coefficients Standard error p-value
Constant .547 0.320 <0.000
Age .296 0.077 0.000
Sex .012 0.003 0.000
Marital status .136 0.069 0.049
Educational status -0.011 0.032 0.727
Occupation -0.039 0.24 0.103
Physical Activity (30 minutes /day) .112 0.071 0.115 Vegetable consumption -0.30 0.063 .641 Soft drinks/juice consumption 0.101 0.072 .641 Meat/egg consumption -0.019 0.044 0.013 Snack consumption -0.171 0.069 0.013
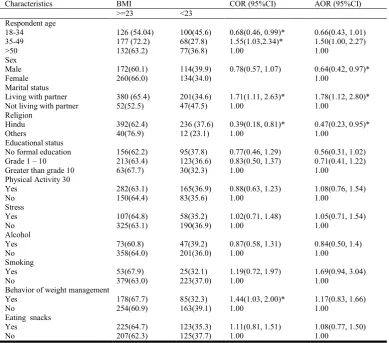
Table 5. Factors associated with BMI and different back ground of the Respondents in Theni District, Tamil Nadu, 2016
Characteristics BMI COR (95%CI) AOR (95%CI)
>=23 <23 Respondent age
18-34 126 (54.04) 100(45.6) 0.68(0.46, 0.99)* 0.66(0.43, 1.01) 35-49 177 (72.2) 68(27.8) 1.55(1.03,2.34)* 1.50(1.00, 2.27)
>50 132(63.2) 77(36.8) 1.00 1.00
Sex
Male 172(60.1) 114(39.9) 0.78(0.57, 1.07) 0.64(0.42, 0.97)*
Female 260(66.0) 134(34.0) 1.00
Marital status
Living with partner 380 (65.4) 201(34.6) 1.71(1.11, 2.63)* 1.78(1.12, 2.80)* Not living with partner 52(52.5) 47(47.5) 1.00 1.00
Religion
Hindu 392(62.4) 236 (37.6) 0.39(0.18, 0.81)* 0.47(0.23, 0.95)*
Others 40(76.9) 12 (23.1) 1.00 1.00
Educational status
No formal education 156(62.2) 95(37.8) 0.77(0.46, 1.29) 0.56(0.31, 1.02) Grade 1 – 10 213(63.4) 123(36.6) 0.83(0.50, 1.37) 0.71(0.41, 1.22) Greater than grade 10 63(67.7) 30(32.3) 1.00 1.00
Physical Activity 30
Yes 282(63.1) 165(36.9) 0.88(0.63, 1.23) 1.08(0.76, 1.54)
No 150(64.4) 83(35.6) 1.00 1.00
Stress
Yes 107(64.8) 58(35.2) 1.02(0.71, 1.48) 1.05(0.71, 1.54)
No 325(63.1) 190(36.9) 1.00 1.00
Alcohol
Yes 73(60.8) 47(39.2) 0.87(0.58, 1.31) 0.84(0.50, 1.4)
No 358(64.0) 201(36.0) 1.00 1.00
Smoking
Yes 53(67.9) 25(32.1) 1.19(0.72, 1.97) 1.69(0.94, 3.04)
No 379(63.0) 223(37.0) 1.00 1.00
Behavior of weight management
Yes 178(67.7) 85(32.3) 1.44(1.03, 2.00)* 1.17(0.83, 1.66)
No 254(60.9) 163(39.1) 1.00 1.00
Eating snacks
Yes 225(64.7) 123(35.3) 1.11(0.81, 1.51) 1.08(0.77, 1.50)
[image:6.595.104.494.411.754.2]Those who are currently living with partner were 1.86 times more likely to be obese than those who are not currently cohabit or living together [COR=1.71(1.11, 2.63)]. And respondents who reported as they know about behaviors used to reduce obesity were 1.44 times more likely to be obese [COR=1.44(1.03, 2.00)]. Multivariate logistic analysis results showed that the likely hood of being obese among respondents who reported living with partner were 1.81 times higher than those who did not live their partner[AOR=1.81(1.15, 2.85)]. On the other hand the likely hood of being obese was 0.64
times lower in male respondents than females.
[AOR=0.64(0.42, 0.97)].The prevalence of obesity was also 0.76times lower among Hindus when compared to other religions [AOR=0.45(0.23, 0.92)].
DISCUSSION
Overall Obesity was high 52.4% compare to previous studies in India. Overweight and obesity of males 22.7% and females were 57.5%. This finding has slight difference with study done in kanchupuram and Tiruvallur districts, Tamil Nadu state and central state and south India (http://www.who.Int /gho/ned/risk-factors/obesity-tex/en/.; Kaur et al., 2011; http://dx.doi.org/10. 1136/bmj.c4974 (Published 27 September 2010). Prevalence of obesity rate was comparatively low 26% in Iran. Obesity and overweight was high in USA and Kingdom of Saudi Arabia 62% and 26%. Females Prevalence rate was high in this study it is consistent with other study done in Maharashtra state and Andhra Pradesh in south India, (Rashidy-pour et al., 2010; Chow et al., 2007; Bhardwaj et al., 2011) this Similarity and differences is due to socioeconomic condition, cultural factors and food habits of the people.
This result shows that prevalence of Central obesity was more in females 78.5% than males 49.6%. This study finding was consistent with other studies done in Delhi, Tamil Nadu and Bangladesh. (http://www.sci-rep.com; Tasnima Siddiquee
et al., 2015), and other finding in Tamil Nadu result shows
comparatively low about abdominal obesity with present study 17.6% in males and 23.7% in females, this may due to large sample study. (http://dx,doi.org/10,11,55/2014) The result of current shows that age, gender, marital status, meat/egg consumption and snack consumption were statistically significant and associated with Obesity (BMI) (p=0.001 and p=0.000). This result was consistent with study done in Bangladesh, Andhra Pradesh, and Tamil Nadu state in India (Ramachandran and Snehalatha, 2010; Kaur et al., 2011; http://dx,doi.org/10,11,55/2014; Bhardwaj et al., 2011), This similarity due to same culture Pattern and socio demographic starts in south India. This finding was contradictory with other studies association between BMI and educational status. (Kaur
et al., 2011; Sanjay Kinra et al., 2010; Chow et al., 2008; Kaur et al., 2011). This study finding proportion of obesity
categories like overweight and obesity with age group of 34-49 years of respondents had high level of overweight and obesity was23.3%, 33.5. Age above 50 percentage of overweight and obesity was declined. This finding was consistent with study done in hail region, in kingdom of Saudi Arabia (Sanjay Kinra
et al., 2010; Rashidy-pour et al., 2008). The result of the
current study showed a strong association between obesity and hyper tension or diabetes which shows a statistically significant
with hypertension p<0.01 and diabetes p<0.001). The relationship between obesity and hypertension or and diabetes is well established with other study reports (Chow et al., 2008; http://www.nfhsindia.org/nfhs3.html. Accessed on 6 march, 2012). Factors associated with BMI and different back ground of the respondents on Bivariate analysis this study result shows that age between 18-34 were 1.55 times more likely to be
obese than those who are greater than or equal to 50 years [(COR=1.55(1.03,2.34)]. Multivariate logistic analysis result
revels that the likely hood be being obese among respondents of married living with partners were 1.76 times higher than those who were separated and diverted [AOR= 1.76(1.12, 2.78)], and Prevalence of male respondents was 0.64 times lower than female AOR=0.64 (0.42, 0.97). The prevalence of obesity was also 0.44 times lower among Hindus than other religions [AOR=0.44(0.21-094)].
Conclusion
Overweight and obesity are prevalent in Tamil Nadu state, in India and should be considered a serious public health problem. Gender, diet, physical activity, education levels and SES were associated with the increase prevalence of obesity, which necessitates urgent intervention preventive measures includes early detection of obesity and health education regarding the right food choices and encouraging physical exercise among all age groups for both genders.
Conflict of Interests
The authors declared that there is no conflict of interests regarding the publication of this paper.
Author Contribution
Both author contributed equally during design and conduct of the study. We both participated in data collection, statistical analysis and interpretation of findings. Rajalakshmi Murugan prepared the draft then revised by Maria Therese. Both authors read and approved the final content of the manuscript.
Acknowledgment
We were very thankful to the participants who gave their times to take part in this study. We likes to thank primary health centers and Hospitals staffs for given permission for data collection and also data collectors for their full support and cooperation.
REFERENCES
Agrwal, Emerging obesity in northern India States Serious threat for Health. IUSSP conference, Bangkok, date of access 12 June 2002, Available from http//www/Bangok 2002/ S7Aqrawal, Pdf.
Chow, C.K., Naidu, S., Raju, K. et al. 2008. Significant lipid, adiposity and metabolic abnormalities amongst 4535 Indians from a developing region of rural Andhra Pradesh. Atherosclerosis 196: 943-952.doi:10.1016/j atherosclerosis 2007.02.027 [pub med][cross reference].
Golbal Health observatory (GHO), Obesity, situation and trends, world 2013. http://www.who.Int/gho/ned/risk-factors/obesity-tex/en/.
Guptha, S. and Kappor. 2010. Sex difference in blood pressure level and its association with obesity indices: who is at greater risk: Ethn is20:370-5.
Hussen Gadelkarim, Ibrahim, Abdelmeeheed Ginavie et al. 2014. Prevalence of obesity in Hail Region KSA: In a comprehensive survey, Hindawi Publishing corporation,
Journal of Obesity, Volume 2014, Article ID 96186, 5 Pages, http://dx,doi.org/10,11,55/2014.
Jayashree, Sachin Gothakar, Prevalence of Obesity and its associated of co morbidities among adults, National
Journal of Community Medicine, Vol 2, Issue 2, July –Sep
2011, pp221-244.
Kalra, S., Umnikrishnan, A.G. 2012. Obesity in India : The weight the weight of the nation. Journal of medical nutrition and nutraceuticals, 2012. Volume 1/ issue 1/Jan-June2012.http://www.nfhsindia.org/nfhs3.html.Accessed on 6 march, 2012.
Kaur, P., Rao, S.R. Radhakrishnan, E., et al. 2011. High Prevalence of tobacco use, alcohol use and overweight in a rural population in Tamil Nadu, India, Journal of Post
Graduate Medicine, Vol57, No 1, January – March, pp.
9-15.
Pednekar, M.S. 2008. Association of body mass index with all-cause and cause – specific mortality: Finding from a prospective cohort study in Mumbai (Bombay), India. In J
Epidemiol., 37:524-35.
Ramachandran, A. Snehalatha C. 2010. Rising burden of obesity in Asia. J. Obesity, 2010.
Ramesh Chand Chauhan, Neelima Singh Chauhan,
Manikandan et al. Obesity among adult population of a rural coastal area in South India, International Journal of Scientific Reports Chauhan RC et al. Int J Sci Rep., 2015 Jul;1(3):155-158, http://www.sci-rep.com
Rashidy-pour, A., Malek, M., Eskandarion, R., Ghorbami, R. Obesity in the Iranian population ” Obe Rev10(1): 2-6.doi:10.1111/J. 1467-789x.2008.00536.x. PMID 1921868. [Cross Reference].
Sanjay Kinra, Liza J Bowen, Tanica Lyngdoh et al.
Sociodemographic patterning of non-communicable
disease risk factors in rural India: a cross sectional study, BMJ 2010; 341 doi: http://dx.doi.org/10.1136/bmj. c4974
(Published 27 September 2010) Cite this as:
BMJ 2010;341:c4974.
Tasnima Siddiquee, Bishwajit Bohowmil, Nayla Cristina Da Vale Moreira, et al. Prevalence of Obesity in a rural Asian India (Bangladeshi) Population and its determinants. BMC
Public Health 2015, 15:860doi:10.1186/s12889-015-
2193-4.