AN ANALYSIS OF LAND USE AND LAND COVER CHANGE IN THIRUVAIYARU BLOCK, THANJAVUR
Senthilkumar
Department of Industries and Earth
ARTICLE INFO ABSTRACT
In this paper an attempt has been made to analyse the landuse and landcover change detection in Thiruvaiyaru block of Thanjavur district using remote sensing and GIS techniques. The total area of the study is 163.88 sq.km. It lies between the long 78
N. In this block there are totally 62 villages.
imageries LANDSAT 5TM (2005) and LANDSAT 7ETM (2015) data’s are used and the scale is 1:50,000.
maps were generated and classified into agriculture land,
river sand, water bodies, and vegetation land for the year 2005 and 2015 based on NRSA classification. Each landuse and landcover has been from change to have positively and negatively for the two decades, es
19.62, 6.56, 13.16 and 14.91 percentages respectively. These images were taken for comparing the classifications. The Landsat 5TM and 7ETM images were taken from GLCF.
Copyright©2017, Senthilkumar and Sujatha. This is unrestricted use, distribution, and reproduction in any medium,
INTRODUCTION
Land is the basic resource of human society. It is the most significant among the natural resources of the country and most of its inhabitants depend on agriculture for their livelihood. Land is being used by people for various purposes. The basic requirement of human society is food. Farmers produce food from the land. The second important basic need of the people is home. It takes a very higher priority in its demand of land. The other need of mankind is work. For that, land can provide right location for work place or industries. The fourth need is recreation and fifth is the communication. These also require land, but, agricultural areas should not be considered for allotment for these purposes. Only lands not suitable for agriculture should be taken into consideration. Land use change always been of involves interest to geographers. This topic of geographic research is in land use change identification, location and mapping the sites and areas of differe
change and by updating the existing land use records and maps. The above said information is important in providing an updated inventory of the existing land resources that are being used by human beings. Using this information on change, the interaction among the forces and the effects of land use change on associated attributes such as land quality, land value and
*Corresponding author: Sujatha, P.
Department of Industries and Earth Sciences, Tamil University, Thanjavur-613010
ISSN: 0975-833X
Vol.
Article History: Received 15th August, 2017
Received in revised form 09th September, 2017 Accepted 14th October, 2017
Published online 30th November, 2017
Citation: Senthilkumar, U. and Sujatha, P. 2017. “
International Journal of Current Research, 9, (11), 60804 Key words:
Lnaduse, Landcover change, Thiruvaiyaru block and GIS.
RESEARCH ARTICLE
AN ANALYSIS OF LAND USE AND LAND COVER CHANGE IN THIRUVAIYARU BLOCK, THANJAVUR
DISTRICT IN TAMIL NADU
Senthilkumar, U. and *Sujatha, P.
Department of Industries and Earth Sciences, Tamil University, Thanjavur
ABSTRACT
In this paper an attempt has been made to analyse the landuse and landcover change detection in Thiruvaiyaru block of Thanjavur district using remote sensing and GIS techniques. The total area of
udy is 163.88 sq.km. It lies between the long 78 o 48’ E to 79
. In this block there are totally 62 villages.This area has a multi various land use.
imageries LANDSAT 5TM (2005) and LANDSAT 7ETM (2015) data’s are used and the scale is 1:50,000. It is located in the central part of Tamil Nadu. Landuse and Landcover change detection maps were generated and classified into agriculture land, built-up land, fallow land, Uncultivable land, river sand, water bodies, and vegetation land for the year 2005 and 2015 based on NRSA classification. Each landuse and landcover has been from change to have positively and negatively for the two decades, especially agriculture land, sandy area, vegetation and fallow land, which is about 19.62, 6.56, 13.16 and 14.91 percentages respectively. These images were taken for comparing the classifications. The Landsat 5TM and 7ETM images were taken from GLCF.
is an open access article distributed under the Creative Commons medium, provided the original work is properly cited.
Land is the basic resource of human society. It is the most significant among the natural resources of the country and most of its inhabitants depend on agriculture for their livelihood. by people for various purposes. The basic requirement of human society is food. Farmers produce food from the land. The second important basic need of the people is home. It takes a very higher priority in its demand of land. The work. For that, land can provide right location for work place or industries. The fourth need is recreation and fifth is the communication. These also require land, but, agricultural areas should not be considered for ds not suitable for agriculture should be taken into consideration. Land use change always been of involves interest to geographers. This topic of geographic research is in land use change identification, location and mapping the sites and areas of different types of change and by updating the existing land use records and maps. The above said information is important in providing an updated inventory of the existing land resources that are being used by human beings. Using this information on change, the nteraction among the forces and the effects of land use change on associated attributes such as land quality, land value and
Department of Industries and Earth Sciences, Tamil University,
tenure can be studied in a comprehensive manner Bryant (1976). These investigations often enhances the knowledge, and provide a sound basis, from which better management and planning policies, regarding land resources. Thus there is no doubt of the importance of an efficient and accurate acquisition procedure to obtain this change information. Anderson (1971) has studied the land use classification using recent geographic applications of remote sensing and
have described the urban land use model in Britain. Jensen (1981) explains change detection can be performed manually by means of visual digital change detection techniques have been developed. Gautam et al. (1982) has been studied the us remote sensing technique in land use within a very short time and accurate manner. The present are also mapping and analysis the landuse and landcover change in Thiruvaiyaru block of Thanjavur district.
Location of the study area
Thiruvaiyaru, means Five Rivers around the city Thiruvaiyaru is a panchayat town in the Thanjavur District it is situated on the banks of the river Cauvery 13km from Thanjavur. Thiruvaiyaru is Located at north Latitude of 10
56‘15’´and East Longitude of 78 cover the survey of topographic sheet
has an averages elevation of 38 metres (124feet). The block of Thiruvaiyuru is north corner of Thanjavur districts in Tamil Nadu state. lt is bounded on the N
International Journal of Current Research
Vol. 9, Issue, 11, pp.60804-60811, November, 2017
“An analysis of land use and land cover change in Thiruvaiyaru block, Thanjavur district in Tamil Nadu” 60804-60811.
Available online at http://www.journalcra.com
z
AN ANALYSIS OF LAND USE AND LAND COVER CHANGE IN THIRUVAIYARU BLOCK, THANJAVUR
Sciences, Tamil University, Thanjavur-613010
In this paper an attempt has been made to analyse the landuse and landcover change detection in Thiruvaiyaru block of Thanjavur district using remote sensing and GIS techniques. The total area of 48’ E to 79o 9’ E and Lat. 10o 48’ to 11o 56’ This area has a multi various land use. The satellite imageries LANDSAT 5TM (2005) and LANDSAT 7ETM (2015) data’s are used and the scale is It is located in the central part of Tamil Nadu. Landuse and Landcover change detection up land, fallow land, Uncultivable land, river sand, water bodies, and vegetation land for the year 2005 and 2015 based on NRSA classification. Each landuse and landcover has been from change to have positively and negatively for pecially agriculture land, sandy area, vegetation and fallow land, which is about 19.62, 6.56, 13.16 and 14.91 percentages respectively. These images were taken for comparing the classifications. The Landsat 5TM and 7ETM images were taken from GLCF.
Commons Attribution License, which permits
n be studied in a comprehensive manner Bryant (1976). These investigations often enhances the knowledge, and provide a sound basis, from which better management and planning policies, regarding land resources. Thus there is no efficient and accurate acquisition procedure to obtain this change information. Anderson (1971) has studied the land use classification using recent geographic applications of remote sensing and Rhind and Hudson (1980) have described the urban land use model in Britain. Jensen (1981) explains change detection can be performed manually by means of visual digital change detection techniques have . (1982) has been studied the use remote sensing technique in land use within a very short time and accurate manner. The present are also mapping and analysis the landuse and landcover change in Thiruvaiyaru
, means Five Rivers around the city Thiruvaiyaru in the Thanjavur District it is situated on the banks of the river Cauvery 13km from Thanjavur.
Thiruvaiyaru is Located at north Latitude of 100 48‘ 49”to100
tude of 780 58‘48’ to 790 9’58’ and
cover the survey of topographic sheet no 58N and 58 J/3. lt has an averages elevation of 38 metres (124feet). The block of Thiruvaiyuru is north corner of Thanjavur districts in Tamil Nadu state. lt is bounded on the North by Ariyalur District
INTERNATIONAL JOURNAL OF CURRENT RESEARCH
south by Thanjavur block. East by papanasam taluk and west by budalur taluk Thiruvaiyaru taluk is central location. The block having 62 revenue villages and about 163.88sq.km and shown in figure. The study area slope is generally gentle slope to flat lying pere lained terrain with a gently easterly gradient of in 20m towards the coast. The maximum elevation of land surface is about 38 above mean sea level. The study area is a plain terrain with a gently slope towards east and south east direction. In the study area major rivers are Coleroon river have flown in the northern part of the taluk Cauvery and kodamurutti Rivers are flowing in the central part of the study area vannar and vettar Rivers are flowing in the southern part rest of them are canals such canals are punavasal channel and kadungal vaikkal vaikkal its tributaries are important water resources for fulfilling the agricultural purposes of the taluk.
Population
The total population of Thanjavur district is 2,402,781 of which male and female population are 1,183,112 and 1,219,669 respectively (Census, 2011). In 2001, Thanjavur had population of 2,216,138 of which males were 1,096,638 and remaining1,119,500 were females (Census, 2001). The district has a population density of 691 people per km2. Its population growth rate over the decade 2001-2011 was 8.42%. Thanjavur has a sex ratio of 1031 females for every 1000 males, and a literacy rate of 82.72% (Census, 2011).Out of total population 64.61 % population of Thanjavur districts lives in rural areas of villages. The total population of Thanjavur district living in rural areas is 1,552,325 of which males and females are 765,784 and 786,541 respectively (Census, 2011). Density of population is high in Papanasam, Kumbakonam and Thanjavur taluk and least in Thiruvidaimarudur, Orathanadu, and Peravurani. Kumbakonam and Thanjavur Kumbakonam, Thiruvidaimarudur taluks have low sex ratio.Proportion of urban population is high in Thanjavur taluk. Highest literates are found in Thanjavur and lowest in Peravurani. Birth rate shows gradual declining trend in five taluks namely Thiruvidaimarudur, Papanasam, Peravurani, Thiruvaiyaru and Orathanadu during 1991-2001. Still birth rate also, shows declining trend. Thiruvidaimarudur, Thanjavur and Papanasam taluks show declining trend of maternal mortality rate while in other taluks it varies.
Location map of the study area
Objectives
The main objectives of the study are
1. To prepare a landuse and landcover map and analyse the change for the years 2005 and 2015.
Methodology
The survey of India Toposheets of 58 M/ 16, 4, 8 in 1:50,000 scale of Thiruvaiyaru block is registered, digitized and analyzed with the help of Arc GIS imagine software for landuse and landcover change analysis in the years 2005 and 2015. Totally, seven landuse and landcover classes were established in the study area, as agriculture land, built-up land, fallow land, vegetation, Uncultivable land, water bodies and sandy area. Two dated LANDSAT images were compared with supervised classification technique. In the supervised
classification technique, two images with different years are independently classified.
Land use and land cover changes in Thiruvaiyaru block 2005 AND 2015
This Thiruvaiyaru block as an area of (163.88sq.km).The area
under investigation lies between the long 78o 58’ E to 79o 9’ E
and Lat. 10o 48’ to 10o 56’ N.This area has a multi various land
use. Such land use has been identified and the area has been calculated, the land under use agriculture land, Uncultivable land, built-up land, fallow land, vegetation, river sand, water bodies. In this block there are totally 62 villages. Each land use and land cover positively and negatively has been changed in the years. 2005 and 2015 every 9 year of the selected year. The changes have been discussed below. Table 4.1 and Fig 4.1.
Agriculture land
Land use map prepared gives an idea of how land use pattern keeps the trends of change. Mainly in 2005, what were the changes of the land use pattern of agriculture land, built-up land, water bodies, and vegetation and. The detailed changes are analyzed into change detection part. This particular land has undergone drastic changes in the area. The agriculture lands were located in all villages. Most of the agriculture lands were located around the settlements. There are under agriculture activities in this block. This area has been seen busy agriculture activities in 2005 higher than the year. In 2005 the agriculture land occupied an area of 74.32sq.km.
There are located in village Southern part of
Vilangudi, Rajendiram, Peramur, Konerirajapuram,
Karuppur, Ambathumelakaram, Kaduveli, Karukkudi,
Eswarankovilpathu, Allur, Sathanur, kuzhimathur,
perumpuliyur, Karuppur. In 2015 agriculture land was found in (69.17sq.km).They are location in the village western part of suyampatchanallur, vadukakkudi, Avikkarai,Aachanur, karur, Kuzhimathur, Naducauvery, rayampettai, suysmpatchanallur, Nagathi, punavasal, Sathanur, Thennancheri, Tiruchchatturai, vellamperambur. There are over all agriculture land changes (24.80%) in this block. Shows the different land use pattern and their proportion to the total area. Because of the land converted to Uncultivable land and fallow land.Because of increasing population and migration of people to good infrastructural facilities in this block. So much of agriculture lands were transformed in to uncultivable land to fallow land and converted to built-up land .Most of the area is occupied by the built- up land in high concentration with gradual reduction of agricultural activities. Changing land use and land cover of Thiruvaiyaru block. In all these two years 2005, and 2015 agriculture lands were decreased to 24.80%.
Built –up-land
The block of Thiruvaiyaru is located in the northern portion of the study area. The present study area covers 62 villages. Among the villages categorized based on the size of the population leads to all portion of the block. The major settlements are categorized based on the density of the population. It is defined as an area of human habitation developed due to non agriculture area. Which has a cover of building, transport and communication, utilities association with water, vegetation and vacant lands. Migration of people is from rural to urban has become quite common.
The built up land is increasing day by day. The built up land has spread in over the entire study area. In 2005 built-up land occupied an area of (18.60sq.km). In 2005 compared to 2015 the built-up lands were increased in (22.56%) respectively. Built-up land denotes urban settlements where as built-up land indicates rural settlements. Rural settlements migration of the converted to urban settlements reason for school colleges govt offices in all other facilities and transportation in urban area. The village settlements were extended in the area. Such as
Northern side of punavasal, Keelatiruppanthuruthi,
Kalyanapuramsethi, karupur, Konerirajapuram,
Manakkarambai, Mealtiruppanturuthi, Peramur, Semmankudi, Thenperambur, Thiruvalampozhil some villages extended in this block. Settlements Over all spread in this area but particularly North to Eastern side was high concentration in this block. The built-up land has been increased day by day due to density population from the category of uncultivable land, agriculture land fallow lands. The transportation facilities have been well developed in this block. The built-upland
increased in this block. From 2005 to 2015 built-up land was increased to 22.56% in this block.
Fallow land
This is an agriculture land but temporarily not used for cultivation It is described as an area under agriculture land, which is taken up for cultivation but temporarily allowed to rest uncropped one or more seasons but less than one year. Waste land is described as degraded land. It can be brought under vegetative cover with reasonable efforts but at present they are unutilized and are deteriorating due to the lack of appropriate land, water, and soil management or on account of natural cause. Land with scrub, it is one of the waste lands categories. It is generally associated with foothills, bazadas, relatively high topography like the upland, the high ground area covered by a thin veneer of soils, eroded lands, and bad Lands topography and so on. The lands were demarcated in the north part of the study area. In 2005 the fallow land occupied an area of 21.52sq.km. This has increased because of the
Fig.1. Location Map
changes in monsoon. It is natural, when a land in the neighbour hood of township was going waste, due to density of people some land is converted probably for housing. In 2005 compared to 2015 the fallow land (16.12%) had been increased in this block. The fallow land is in high concentration in north to south particularly in the villages name kandiyur,
mannarsamuthiran, maharajapuram, maruvur, sathanur,
Thennancheri, Thiruvaiyaru, Semmankudi, Rajendiram,
valappakkudi, varahur, Thulasenthira. In 2015 Fallow land occupied an area of (24.66 sq.km). This was increased in this year. The increase was in the villages found in the eastern side of suyampatchanallur, vadukakkudi, Avikkarai, Aachanur,
karur, Kuzhimathur, Naducauvery, rayampettai,
suysmpatchanallur, Nagathi, punavasal, Sathanur,
Thennancheri, Tiruchchatturai, vellamperambur, Punavasal,
Keelatiruppanthuruthi, Kalyanapuramsethi, karupur,
Konerirajapuram, Manakkarambai, Mealtiruppanturuthi,
Peramur, Semmankudi, Thenperambur, Thiruvalampozhil. The fallow land was increased due to changes of monsoon over a long period. Two cropping system have been brought down into a single crop system in the field. This fallow land must have been the area on the Eastern side of settlement and house plots in the neighbourhood of the major developing town like revenue village. From 2005 to 2015 fallow land had over all changes ie 16.12%.
Vegetation
The vegetation is located over the entire block. In 2005 this area occupied 19.18sq.km. It has decreased in this year. In the year of 2005 compared to 2015 vegetation had decreased to (-13.87%). It was identified in villages on the southern side of
Vilangudi, Rajendiram, Peramur, Konerirajapuram,
Karuppur, Ambathumelakaram, Kaduveli, Karukkudi,
Eswarankovilpathu, Allur, Sathanur, kuzhimathur,
perumpuliyur and Karuppur. In 2015 it was identified in an area of (16.30sq.km). In the villages such as punavasal,
Keelatiruppanthuruthi Kalyanapuram sethi, karupur,
Konerirajapuram, Manakkarambai, Mealtiruppanturuthi,
Peramur, Semmankudi, Thenperambur, Thiruvalampozhil.In this block. vegetation was decreased because of shortage of irrigation facilities and changes of monsoon, soil erosion, flood in a particular reason in this block. This land has been converted into built-up land and other facilities are there. From 2005 to 2015 vegetation had over all changes 13.87%.
Water bodies
The major river Kollidam flows in the west to east direction which is found in the southern parts (south most) of the study area. There is a concentration of three drainage system with the small river like kollidam and cauvery River. A canal has been identified in the north and the central and the south parts of the study area. The canal flows from north to south and the southeast direction and finally it joins the river Cauvery. A number of streams are noticed throughout the study area in which the southern streams have been perennial. In 2005 area
occupied was (18.13sq.km). In villages such as
suyampatchanallur, vadukakkudi, Avikkarai, Aachanur,
karur, Kuzhimathur, Naducauvery, rayampettai,
suysmpatchanallur, Nagathi, punavasal, Sathanur,
Thennancheri, Tiruchchatturai, vellamperambur it was found. In 2005 compared to 2015 water bodies increased (-11.66%) to in these years. In the villages like kandiyur, mannarsamuthiran,
maharajapuram, maruvur, sathanur, Thennancheri,
Thiruvaiyaru, Semmankudi, Rajendiram, valappakkudi,
varahur, Thulasenthira. In 2015 occupied in this area an (15.92sq.km). In 2005 to 2015 the water bodies had over all changes 11.66% in this block.
Uncultivable land
Uncultivable land is described as degraded land that can be brought under vegetative cover with reasonable efforts but at present they are un utilized and are deteriorating due to the lack of appropriate land, water, and soil management or on account of natural cause. Uncultivable it is one of the waste land categories. In 2005 occupied as an area of (8.01qs.km). In 2005 compared to 2015 uncultivable land has (10.30%) decreased in this block. Some villages in the north to western side of suyampatchanallur, vadukakkudi, Avikkarai, Aachanur,
karur, Kuzhimathur, Naducauvery, rayampettai,
suysmpatchanallur, Nagathi, punavasal, Sathanur,
Thennancheri, Tiruchchatturai, vellamperambur. Uncultivable lands were found. But in 2015 year the uncultivable land had increased. From 2005 to 2015 they had uncultivable land over all changes 10.30%.
River sand
The river sand is that sand that is spread over in the river bed. It was noted in the southern side of Kollidam River and Cauvery river basin. The area observed in this category was 4.12sq.km 2005. In 2005 compared to 2015 the river sand has increased to (0.69%).It been noted in kollidam and Cauvery river basin. In the river much of the sand has been found in this place from south to north but southern side was mostly covered
by villages of punavasal, Keelatiruppanthuruthi,
Kalyanapuramsethi, karupur, Konerirajapuram,
Manakkarambai, Mealtiruppanturuthi, Peramur, Semmankudi, Thenperambur, Thiruvalampozhil. The 2015 river sand occupied an area of 3.98sq.km. Some of the agriculture land in high concentration is in southern part of the block.
Summery and Conclusion
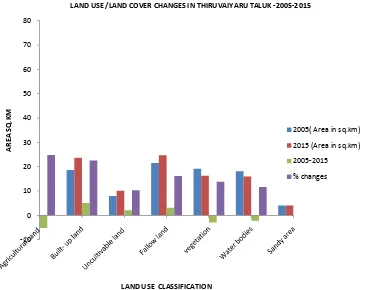
Land is non- renewable resource and hence assessment of land use and land cover in temporal sequence is essential for planning and development of land and water resources. In this context the present study was carried out in Thiruvaiyaru block the land use and land cover practices of the years 2005 and 2015. The following land use and land cover pattern was observed, such as Agriculture land (74.32) sq.km, Built-up land (18.60) sq.km, Fallow land (21.52) sq.km, vegetation (19.18) sq.km, Water bodies (18.13) sq.km, uncultivable land (8.01) sq.km, Sandy area (4.12) sq.km. The year 2015 of land sat satellite data has interpreted, the following land use and land cover has been observed such as Agriculture land (69.17) sq.km, Built-up land (23.70) sq.km, Fallow land (24.66) sq.km, vegetation (16.30) sq.km, Water bodies (15.92) sq.km, uncultivable land (10.15) sq.km, sandy area (3.98) sq.km. Finally, the 2005 and 2015 land use and land cover data has been compared and analyzed that, there will be drastic change in land use and land cover categories of such as Agriculture land 24.80% , Built-up land 22.56%, Fallow land 16.12%, vegetation 13.87%, Water bodies 11.66%, uncultivable land 10.30%, sandy area 0.69%. Mainly a decreasing trend has been identified in the categories of agriculture land, water bodies, and vegetation lands. Built-up land, uncultivable land River sand, fallow land, shows a trend of increase in this area.
Fig. 4.3. Lands at 5tm images in Thiruvaiyaru block -2005
Fig. 4.4. Landsat 5tm, image in Thuraiyur block -2015
[image:5.595.160.445.423.779.2]Fig. 4.5. land use and land cover changes in Thiruvaiyaru block-2005
Fig. 4.6. Land use and land cover changes in Thiruvaiyaru block -2015
[image:6.595.183.419.417.747.2]It also helps in identifying the status of various land use and land cover categories at a particular time. The study area has rural settlements that have been changed in to urban settlements due to the declining process started on agriculture and its allied categories of land use practices, because of low rainfall, climatic changes migration of population from rural to urban in search of jobs and other infrastructural facilities was found.
REFERENCES
Alexandre Boucher, and Kyriadi, Phaedon C. 2006. Super – resolution land cover mapping with indicator geostatistics. Remote Sensing of environment, Vol. 104, Issue 3, pp 264 – 282.
Anderson, James R. 1971. Land use classification schemes used in selected recent geographic applications of remote sensing: Photogrammetric. Eng, v.37, no.4,p.379-387. Anne Chin, 2006. Urban transformation of river landscapes in
a global context. Geomorphology, Vol. 79, Issue 3 – 4, pp.
460-487.
Bhamare S.M. and Pagar, M.P. 2004. Slope and land use changes in Kalwan Tahsil, India. Ecology, Environment & Conservation, 10 (3), pp. 375-381.
Chada Narongrit and Mitsuharu Tokunaga, 2000. Mapping topography and monitoring land use disturbance using day
and night time NOAA – AVHRR data. Asian Journal of
Geoinformatics, Vol.1, No.2, pp 41 – 46.
Congalton R.G. et al. 1998. Mapping and monitoring
agricultural crops and other land cover in the lower
Colorado River basin. Photogrammetric Engineering and
Remote Sensing, Vol. 64 No.11 pp. 1075-1118.
Dhinwa, P.S. et al. 1992. Land use change analysis of
Bharatpur district using Gis. Journal of the Indian Society
of Remote Sensing, Vol.20, No.4, pp. 237-250.
Dwivedi R.S. et al. 2001. An integrated decision tree approach
(IDTA) to mapping land cover using satellite remote sensing in support of grizzly bear habitat analysis in the
Alberta yellow head ecosystem. Canadian Journal of
Remote Sensing, Vol.27 No.6.
Frohn, et al. 2005. Improving artificial neural networks using
texture analysis and decision trees for the classification of
land cover. Geosciences and Remote Sensing, Vol. 42,
No.1, pp. 44-65.
Gesche Krause, et al. 2004. Mapping land – cover and
mangrove structures with remote sensing techniques a contribution to a synoptic GIS in support of coastal management in north Brazil environmental management, Vol. 34, No. 3, pp. 429-440.
Hari Shankar, et al. 2006. Application potentials of synthetic
aperture radar intergeometry for land-cover mapping and
[image:7.595.104.492.73.164.2]crop-height-estimation. Current Science, Vol.91. No.6.
Table 4.2 Land use and land cover changes in Thiruvaiyaru block
Classification 2005(Area in sq.km) 2015 (Area in sq.km) 2005-2015 % changes
Agricultural Land 74.32 69.17 -5.15 24.80
Built- up land 18.60 23.70 5.1 22.56
Uncultivable land 8.01 10.15 2.14 10.30
Fallow land 21.52 24.66 3.14 16.12
vegetation 19.18 16.30 -2.88 13.87
Water bodies 18.13 15.92 -2.21 11.66
Sandy area 4.12 3.98 0.14 0.69
Total 163.88 163.88 - 100
Fig. 4.7. Land use and land cover changes in Thiruvaiyaru block -2005 -2015
-10 0 10 20 30 40 50 60 70 80
AR
EA
SQ.K
M
LAND USE CLASSIFICATION
LAND USE /LAND COVER CHANGES IN THIRUVAIYARU TALUK -2005-2015
2005( Area in sq.km) 2015 (Area in sq.km) 2005-2015 % changes
[image:7.595.106.472.180.470.2]He, Y P. et al. 2003. GIS-based hazard mapping and zonation of debris flows in Xiaojiong basin, south western china.
Environmental Geology, Vol.45, No.2, pp. 286-293.
Jana M. M. 1997. Management and development of river basins in north Bengal using remote sensing techniques.
Journal of the in the Society of Remote Sensing, vol 25,
no.2, pp.1052-111.
Kang, Rambir S. and Marston, Richard A. 2006. Geomophic effects of rural to urban land use conversion on three stream in the central red bed plains of Oklahoma Research papers, Vol.79. Issues 3-4, pp.488-506.
Khayingshing Luirei, et al. 2006. Geomorphic evidences of
neotectonic movements in Dharchula area, northeast kumaun: a perspective of the recent tectonic activity.
Journal of the Geological Society of India, Vol.67,
pp.92-100.
Kilic S. et al. 2006. Environmental monitoring of land-use and
land-cover changes in a Mediterranean region of turkey.
Environmental Monitoring and Assessment, Vol.114,
No.1-3, pp.157-168.
Kyung-Soo Han, et al. 2004. A land cover classification
product over France at 1km resolution using SPOT 4/vegetation data Remote Sensing of Environment, 92, pp.52-66.
Lark, RM. and Webster, R. 2006. Geostatistical mapping of geomorphic Variables in the presence of ternd Research Articles, Vol.31, issue it.
Leroy Proff, et al. 2006. Hydrologic variation with land use
across the contiguous united states: geomorphic and
ecological consequences for stream ecosystems.
Geomorphology, Vol.79 Issues 3-4 pp.264-285.
Li, Weidong; Zhang, Chvanrong, 2005. Application of trnsiograms to Markov Chain simulation and spatial uncertainty assessment of land – cover classes. Giscience and Remote sensing, Vol.42, No.4, pp.297-319.
Maksud Kamal, A.S.M. Midorikawa Saburoh, 2004. GIS based geomorphological mapping using remote sensing data and supplementary geoinformation: a case study of the
Dhaka city area, Bangladesh. International Journal of
Applied Earth Observation and Geoinformation, Vol.6,
No.2, pp.11-125.
Martinez. G.A. et al. 2001. Combined use of Radarsat-1 and
landsat TM data for geomorphologic applications in
lowlands of Buenos aires provice, argentina Canadian
Journal of Remote Sensing, Vol.27.no.6
Muller, S.V. et al. 1998. Accuracy assessment of a land cover
map of the kuppruk River Basin, Alaska; considerations for
remote regions. Photogrammetric Engineering and Remote
Sensing, vol.64.No.6.pp.619-628.
Nolvaline Jocab., et al. 2006. Spatial dynamic modeling
through cellular automala for simulating land use change
dynamics. International Journal of Geoinformatics, Vol.2.
pp.31-38
Olsen, Lisa M., et al. 2005. Time series analysis of land cover
using landscape metrics. Giscience and Remote Sensing,
Vol.42. No.3, pp.200-223.
Palanively, R. et al. 1988. Geology and geomorphology of
cumbum valley and varushanadu hills, Madurai district, Tamil nadu through remote sensing. Indian society of remote sensing, vol.16, No.1 pp.73-78.
Palaniyadi,M., and Nagarathinam V., landuse / land cover mapping and change detection using space borne data. Journal of the Indian society of Remote sensing 1997, vol.25, No.1 pp.27-33.
Porwal, M.C. and Pant, D.N. 1989. Forest cover type and land use mapping using landsat thematic mapper false color composite: a case study for chakrata in Western Himalayas,
U.P. Journal of the Indian Society of Remote Sensing,
Vol.17. No.1 PP.33-40.
Prasad. N. et al. 2006. Spatial analysis of land cover at various
spatial scales for identification of optimum pixel resolution.
International Jounal of Geoinformatics, Vol.2, No.2.pp.
Raju, K. and Anil Kumar, R. 2006. Spatial analysis of land cover at various spatial scales for identification of optimum
pixel resolution. International Journal of Geoinformatics,
Vol.2, pp.31-38.
Raju. K. and Anil Kumar. R. 2006. Land use changes in Udumbanhola Taluk, iddukki District-Kerala: and analysis
with the application of remote sensing data. Journal of the
Indian society of Remote Sensing, Vol.19, No.2,
pp.113-123.
Roy. P.S. et al. 1991. Forest cover and land use mapping in
Karbi angling and north Cachar Hills districts of Assam
using Landsat MSS data. Journal of the Indian Society of
Remote Sensing, Vol.19, No.2, pp.113-123.
Russell, Gordon. D. et al. 1997. The role of GIS in selecting
sites for riparian restoration ased on hydrology and land
use. Restoration Ecology, Vol.5, 56p.