The Integration of FAO-CropWat Model and GIS
Techniques for Estimating Irrigation Water
Requirement and Its Application in the Gaza Strip
Husam Al-Najar
Department of Environmental Engineering, The Islamic University of Gaza, Gaza, Gaza Strip. Email: [email protected]
Received July 9th, 2011; revised August 11th, 2011; accepted August 25th, 2011.
ABSTRACT
In the Gaza Strip irrigation practices are only based on the farmer’s own experience, they determine when and how to irrigate crops based on the appearance of the soil and the climatic conditions. Even though FAO-CropWat model is used for many countries to estimate irrigation water requirements, it is rarely used for Gaza Strip. In the current re-search, it is the first attempt to model the historical available meteorological data to estimate the irrigation water re-quirements for the most common cultivated crops (citrus, almonds, date palms, grapes) and to compare the results with the farmer irrigation practices. The model results show that, the reference evapotranspiration accounts for 1451 ± 5 mm/year. Therefore the irrigation water requirements estimated to be 763, 722, 1083, 591 mm/year in average for Cit-rus, Almonds, Date palm, Grapes, respectively. The farmer irrigation practice exceeding the irrigation water require-ment by 30%. The spatial distribution of irrigation water requirements in the entire area of Gaza Strip is shown on maps derived by GIS technique based on data from eight meteorological stations. Irrigation water quality is not optimal in the Gaza Strip, chemical analysis of irrigation wells indicate high salinity and SAR ratio. The obtained results from the model could be a good management tool for the planners and decision makers to minimize the overexploitation of the groundwater and to build fair and strict regulations to optimize the water use in agricultural sector in the Gaza Strip which characterized by semi-arid region.
Keywords: Cropwat Model, FAO, Irrigation Demand, Gaza Strip, Evapo-Transpiration
1. Introduction
Gaza strip, like any other parts in the Middle East, has a distinct and serious deficit in water, the problem in this area is more clear and serious, and it is related to the wa-ter quantity and quality. It is located geographically in arid and semi arid areas at longitudes 33˚2"east and lati-tudes 31˚16" north’s. Water is becoming an increasingly scarce resource and planners are forced to consider any sources of water, which might be used economically and effectively in agriculture to promote future development. The rapid increase in urban population, land scarcity and the challenge of urban food security has accelerated the phenomenon of urban agriculture on the account of water resources in Gaza Strip, which is mostly ignored by planning institutions [1]. Ground water is the only re-source of water, and many estimates of the annual groundwater recharge in the Gaza strip have been men-tioned in different references, all of these references agree
on one fact, the annual recharge is less than the extracted quantities for a long time, resulting in a serious mining of the groundwater resources [2-5]. The type of fertilizer and irrigation practices has aimed to supply sufficient nutrients and water to ensure economical yields [6]. Ni-trogen and irrigation practices should be considered as complementary to each other [7]. Agriculture is the main water consumer in the Gaza Strip (more than 70% of the total groundwater extraction). The trend of degradation of water resources will continue if serious plans are not prepared in addition to policies and strategies towards efficient water allocation. The Food and Agriculture Or-ganization of the United Nations (FAO) hasproposed using the Penman-Monteith [8](FAO-56 PM) method as the standardmethod for estimating reference evapotran-spiration (ET0), in order to estimate the various crops
were provided to FAO-CropWat model except for Gaza Strip in spite of the water scarcity and the excessive use of irrigation water in this area. FAO-CropWat model built based on the recommended FAO-56, 1998 [8] method which is proven by many researches as a best available approach. The Model was build to calculate the crop water requirements and scheduling based on local meteorological data such as minimum and maximum temperature, wind speed, humidity, daily sun shine hours and effective rains. This approach is rarely discussed for Gaza Strip and most of the practices depend mainly on the historical and legacy experience. Therefore, the main objective of the current research is to review the current irrigation practices and the extracted amount of water from the coastal aquifer for irrigation purposes in com-parison to the real needs based on historical meteoro-logical data and FAO-CropWat modeling. The results will be presented on the Gaza Strip maps using the GIS techniques for spatial analysis to be used as guidelines for farmers to determine their irrigation needs based on crop type and geographical location within the Gaza Strip entire area.
2. Methodology
2.1. CropWat Model
Modeling of average meteorological data for the last ten years by using CropWat Version 8.0. CropWat 8.0 Win-dows is a program that uses the FAO (2004) Pen-man-Monteith method for calculating reference crope- vapo-transpiration. These estimates are used in crop wa-ter requirements calculations:
Crop Water Requirement (CWR) = ET0 × Kc – Pe ,
where, Kc is the crop coefficient and Pe, is the effective
rainfall calculated by USDA soil conservation service method (T. A. Obreza and D. J. Pitts, 2002).
Pe = SF × [0.70917 × (Pr/25.4)0.82416 – 0.11556] ×
100.000955ETc
SF = 0.531747 + 0.295164 (D/25.4) – 0.057697 × (D/25.4)2 + 0.003804 × (D/25.4)3
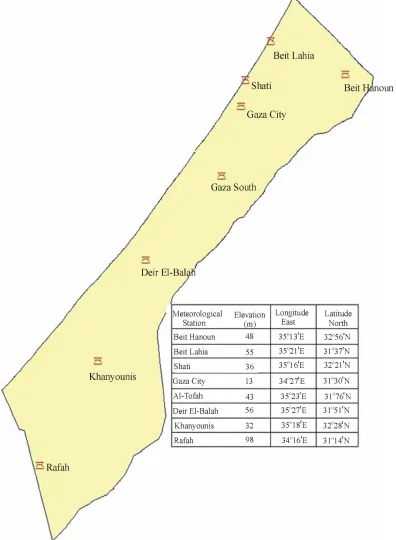
where D represents the usable soil water storage (mm). While Gaza soil texture ranges from sandy loess soils to brown clay loam. Therefore, it represented as a me-dium soil according to the FAO soil classification in the model. Meteorological data such as rainfall, wind speed, humidity, minimum and maximum temperature and sunshine hours are collected from eight meteoro-logical station distributed all over the entire area of Gaza Strip as shown in Figure 1. Model results are compared with the results of questionnaire distributed to farmers to ensure the real figures of water use for irrigation of the targeted crops (Citrus, date palm, almonds and grapes) in the study.
2.2. Quality Measures
For qualitative study, collected samples from irrigation wells of the visited farms were analyzed for major cations such as, Ca and Mg by Titration, Na by Flame photometer; to estimate the Sodium Adsorption Ratio (SAR). Anions such as, by Titration, EC is deter-mined using electrode. The study relied on transactions descriptive statistics such as average, standard deviation, correlation by using the statistical program SPSS v.15, Excel 2007 in the analysis.
Cl
3. Results and Discussions
As shown in Figure 1. Gaza Strip has eight meteoro-logical stations, an average of ten years for maximum and minimum temperature, humidity, wind speed and sun shine hours were inputs for the FAO-CropWat model (Table 1). The maximum temperature ranges between 18.1 and 29.4˚C, while the minimum temperature ranges between 10.7 and 24.6 in winter and summer, respec-tively. The average humidity is 68.3% indicating high humidity in summer than in winter, as the Gaza Strip located on a coastal zone. Wind speed ranges between 230 and 281 km/d. while the average sun shine hours are 5.7 and 9.7 hours/d in winter and summer, respectively.
The model outputs such as solar radiation and refer-ence evapotranspiration indicates high variation between winter and summer, the average solar radiation ranges from 8.5 to 25.6 MJ/m2/d in winter and summer, respec-tively as a consequence the reference evapotranspiration accounts for 1.8 mm/d in February and 5.7 mm/d in July. For the Gaza Strip limited data sources as the mete-orological data is well documented in the last decade only, such model produce satisfactory values compared to other approaches; Slavisa Trajkovic, 2005 [10] from Serbia (Southeast Europe) examined whetherit is possi-ble to attain the reliapossi-ble estimates of ET0only on the
ba-sis of the temperature data. His goalwas reached by the evaluation of the reliability of fourtemperature-based approaches (radial basis function (RBF) network, Thorn-thwaite, Hargreaves, and reduced set Penman-Monteith methods) as compareed to the FAO-56 Penman-Monteith (PM) method. The study showed the Thornthwaite, Har-greaves, and reduced set Penman-Monteith methods mostly underestimated or overestimated ET0 obtained by
the FAO-56 PM method. In addition, reference evapo- transpiration (ET0) estimates have been computed on a
global scale using a high-resolution monthly climate dataset. Penman-Monteith (PM) and Hargreaves (HG) methods have been compared, showing very reasonable agreement between the two methods and proved ET0
Gaza Strip is characterized by short winter season, the first real rain starts from October till March, rains in September and April are occasionally and happened two times in the last decade. Therefore, the average yearly
rainfall is only distributed to five months a year. Around 30% of the rains occurs in January as shown in Table 2
[image:3.595.101.497.155.695.2]for the eight meteorological stations all over the Gaza Strip. In general rainfall and effective rain is nearly nil in
Table 1. Gaza Strip average of ten years monthly meteorological data (reference evapo-transpiration ETo for grass, calcu-lated based on Penman-Monteith as a result of FAO-CropWat model).
Temperature Month
Max Min
Humidity (%) Wind Spd (km/d)
Sun shine (hrs/d)
Solar Rad. (MJ/m2/d)
ETo (mm/d)
[image:4.595.62.534.282.421.2]Jan. 17.8 ± 2 10.7 ± 1 64 ± 5 281 ± 27 4.8 ± 1.4 9.9 ± 1.5 2.5 ± 0.4 Feb. 18.1 ± 2 11.2 ± 1 67 ± 4 278 ± 15 6.2 ± 1.7 13.4 ± 1.9 1.8 ± 0.3 March 19.8 ± 2 13.2 ± 3 68 ± 5 262 ± 22 7.6 ± 1.0 17.7 ± 1.2 3.4 ± 0.4 April 22.5 ± 3 16.7 ± 3 67 ± 6 250 ± 14 8.2 ± 1.3 20.9 ± 1.7 4.3 ± 0.3 May 24.4 ± 2 19.2 ± 3 71 ± 4 230 ± 12 9.8 ± 1.0 24.5 ± 1.5 4.9 ± 0.2 June 27.0 ± 2 21.7 ± 2 74 ± 6 238 ± 15 9.8 ± 1.2 24.8 ± 1.6 5.2 ± 0.3 July 29.4 ± 2 23.9 ± 4 74 ± 4 233 ± 13 10.5 ± 0.5 25.6 ± 1.0 5.7 ± 0.2 Aug. 29.4 ± 3 24.6 ± 3 71 ± 4 238 ± 16 10.5 ± 0.5 24.6 ± 1.1 5.6 ± 0.2 Sept. 28.7 ± 4 23.1 ± 3 69 ± 6 250 ± 30 9.6 ± 0.9 21.3 ± 1.4 5.0 ± 0.3 Oct. 26.3 ± 3 20.4 ± 2 68 ± 3 257 ± 26 8.2 ± 1.7 16.6 ± 2.1 3.9 ± 0.4 Nov. 23.0 ± 3 16.1 ± 2 61 ± 3 262 ± 15 6.0 ± 1.8 11.6 ± 2.4 3.2 ± 0.4 Dec. 19.2 ± 2 12.6 ± 2 65 ± 5 262 ± 22 3.9 ± 1.1 8.5 ± 1.3 2.4 ± 0.5
Table 2. Ten years (2000-2010) average rain basis from the eight meteorological station (MS) all over the Gaza Strip.
Meteorological Station
1 2 3 4 5 6 7 8 Month
---mm/month---
January 133 ± 42 131 ± 39 120 ± 44 127 ± 36 117 ± 17 95 ± 20 78 ± 23 78 ± 19 February 88 ± 24 86 ± 30 80 ± 23 82 ± 19 65 ± 9 60 ± 15 57 ± 17 57 ± 10 March 45 ± 7 45 ± 9 37 ± 9 37 ± 8 38 ± 2 33 ± 10 32 ± 12 32 ± 9
April 7 ± 4 8 ± 4 7 ± 4 7 ± 4 8 ± 4 7 ± 4 9 ± 4 9 ± 4
September 2 ± 1 3 ± 2 3 ± 2 3 ± 2 0 0 0 0 October 28 ± 4 26 ± 6 26 ± 10 28 ± 6 22 ± 8 20 ± 7 14 ± 5 14 ± 5 November 62 ± 4 76 ± 6 62 ± 4 62 ± 5 57 ± 10 53 ± 9 46 ± 8 45 ± 9 December 93 ± 30 97 ± 34 93 ± 27 96 ± 23 82 ± 40 71 ± 31 69 ± 15 69 ± 7 Total 456 ± 83 470 ± 90 428 ± 98 442 ± 72 389 ± 89 339 ± 85 305 ± 77 304 ± 61
April till September. The annual average effective rain accounts for 327 mm/year, calculated by USDA method [9]. Historical meteorological data is lacking, the existing meteorological stations are established 15 years ago. Meteorological data used before this time was adopted from the closest meteorological stations from neighbor countries.
3.1. Quantity of Irrigation Water
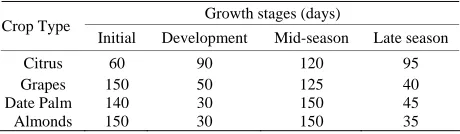
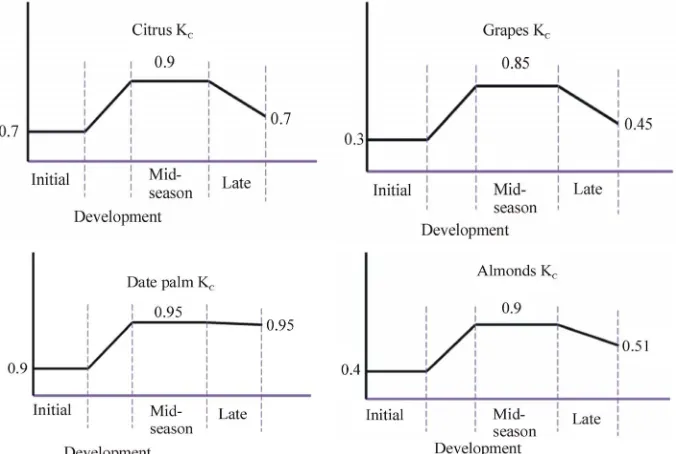
Gaza Strip agricultural sector has a wide range of culti-vated crops. The main permanent trees are citrus, al-monds, apricot, apple, date palm, grapes and olives [12]. In addition to wide range of vegetables such as tomato, pepper, eggplants and potato. Rain fed crops such as winter wheat and barley cultivated in winter season only, so it is neglected from the calculations. Table 3 repre-sents the crops growth stages of citrus, grapes, date palm and almonds. Almonds and grapes show that the initial stage is the highest (150 days) among other crops, while citrus is the highest development stage equals 90 days. Almonds and date palm have midseason stage of 150 days which is the highest, late season of citrus is 95 days, while other crops it ranges from 35 to 45 days. Crop co-efficient curves provide simple, reproducible means to
Table 3. The Gaza Strip permanent crops growth stages.
Growth stages (days) Crop Type
Initial Development Mid-season Late season
Citrus 60 90 120 95
Grapes 150 50 125 40
Date Palm 140 30 150 45
Almonds 150 30 150 35
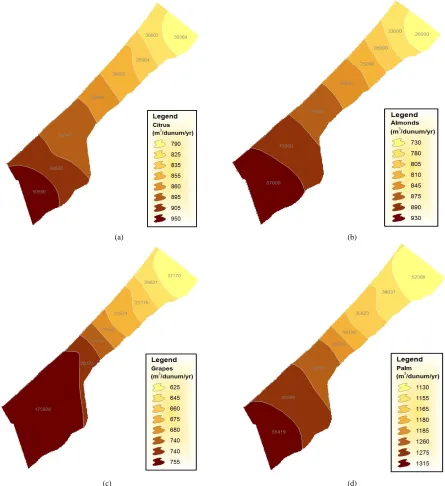
[image:4.595.308.538.450.517.2]cally for irrigation water requirements is not same in the whole entire area of the Gaza Strip, for example the irri-gation water requirements ranges from 790 to 950, 730 to 930, 625 to 755 and 1130 to 1315 mm/year for citrus, almonds, grapes and date palm, respectively from north to south of the Gaza Strip. Comparing with the data ac-cording to the estimations of water authority and the ministry of agriculture and farmers questionnaire, date-palm constitute the most water consumption crop around 1378 mm/year, followed by citrus 1020 mm/year, apple and almonds 1000 mm/year and grapes 865 mm/year. These values exceed the values of the model by at least 20%. Farmers used to cultivate Winter wheat and barley to feed their animals without having tangible agricultural infrastructure or irrigation water consumption therefore, it is classified as rain fed crops. The water allocate for irrigation is measured and published by relevant institu-tions, in the current farmers practice citrus, olives, fruits and vegetables are irrigated with extra amount of water required for evapotranspiration due to absence of re-search in this field leading to unfair revenue which is not cover the cost of pumped water from the aquifer [1]. Therefore, the agricultural water demand is estimated from the available cultivated areas multiplied by the irri-gation water quota allowed for each crop calculated by FAO-CropWat model. One of the missed issues which cannot be investigated by FAO-Model is the irrigation in the green houses and the required irrigation water quality. In spite of the crops which cultivated in green houses have the highest farm profit, it consume the highest quota
of irrigated water especially the green houses which consumes more than 1500 mm per annum [14,15].
The total groundwater extraction in the Gaza Strip in recent years estimated at 142 -170 Million Cubic Meter (MCM). Agricultural extraction is accounted for 100 MCM a year [15]. The results of the model shows that the irrigation water requirements for citrus is 790 to 930 mm/year while the real practice as a collected data from the questionnaire indicates that the irrigation require-ments for citrus ranges between 1000 to 1200 mm/ year. Population growth, and agricultural development have put more pressure on the existing scarce resources. They are currently being exploited to their maximum capacity to meet the desired development. As a result, a lot of environmental problems have started to arise such as the sea water intrusion [16]. Environmental problems will be more acute in the near future if the current resource utilization patterns continue [2].
[image:5.595.129.467.468.695.2]The main aquifer in the Gaza Strip is part of what is known as the coastal plain aquifer. This aquifer extends over a distance of 120 km starting from south of mount of Carmel (Haifa) and ending over in the Gaza Strip, it has a width of 7 - 20 km and it disappears near the foot hills of the mountains of the West Bank. There are an estimated 4000 wells within the Gaza Strip. Almost all of these are privately owned and used for agricultural pur-poses. Approximately 100 wells are owned and operated by individual municipalities and are used for domestic supply [12]. Most of municipal water is not suitable for domestic use according to WHO standards for drinking
(a) (b)
(c) (d)
Figure 3. (a) Irrigation water consumption for citrus based on eight meteorological stations in the Gaza Strip; (b) Irrigation water consumption for almonds based on eight meteorological stations in the Gaza Strip; (c) Irrigation water consumption for grapes based on eight meteorological stations in the Gaza Strip; (d) Irrigation water consumption for date palm based on eight meteorological stations in the Gaza Strip.
water quality, which recommend Chloride and Nitrate concentration 250 and 60 mg/l respectively. Due to the increasing of salinity and nitrate in the groundwater aquifer, most of the water-relevant institutions in Gaza strip rely on brackish water desalination for drinking purposes [17]. The water balance of the Gaza coastal
[image:6.595.74.519.97.583.2]flows, the net deficit range between 18-26 MCM a year. Across much of Gaza Strip, the only groundwater fresh- water supply is threatened by a combination of over- withdrawal and saltwater intrusion meaning that as the region’s only drinking water source, saltwater contami- nation or over-pumping would create a significant hazard to public health [18]. Extracting 80 to 100 million cubic meters a year for agricultural purposes is unreasonable based on irrigation water requirements calculated by FAO-CropWat model.
3.2. Quality of Irrigation Water
Due to the high extraction rate of agricultural purposes, the groundwater quality is deteriorated; seawater intru- sion, up conning are common characteristics of Gaza aquifer. Samples for agricultural wells were analyzed for electrical conductivity (EC), chloride concentration ( ), nitrate ( ) and Sodium adsorption ration
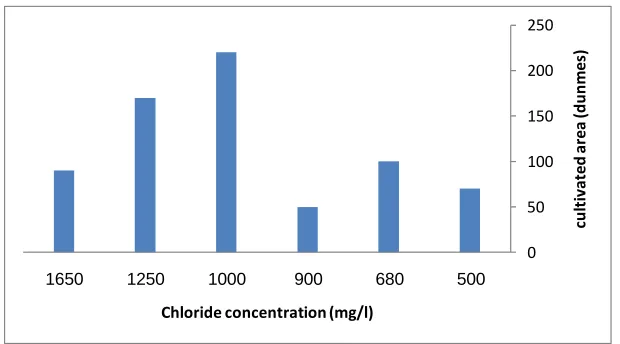
(SAR) as manmade pollution due to the excessive use of fertilizer. Most of the samples were collected from irri-gation wells for citrus orchards all over the Gaza Strip. As shown in Figure 4, the salinity represented by the EC, indicates that citrus survive at 3.8 ds/m, where more than 250 dunmes irrigated with and shows no decline in the yield as reported by framers. Irrigation wells with 1.6 to 2.4 ds/m should be transformed to irrigate vegetables or more sensitive crops. In some agricultural wells, chloride concentration is less than in domestic wells where chlo- ride concentration less than 600 mg/l is detected. High percentage of citrus orchards irrigated with water con-tains more than 1000 mg/l, as shown in Figure 5.
Cl NO3
Excess use of nitrogen fertilizer is shown in the analy- sis of irrigation water, as shown in Figure 6, more than 60% of the cultivated areas irrigated with water contains more than 82 mg NO3/l. The nitrate concentration in the
irrigation water hasn’t adverse effect on the yield of
0 50 100 150 200 250 300
1.6 2.4
3 3.8
4.5
cu
lt
iv
at
ed
are
a
(dun
m
es
)
[image:7.595.149.448.327.494.2]EC (ds/m)
Figure 4. Electrical conductivity of the irrigation water in relation to the irrigated areas of citrus orchards.
0 50 100 150 200 250
500 680
900 1000
1250 1650
cul
ti
va
te
d
are
a
(dunm
es
)
Chloride concentration (mg/l)
[image:7.595.144.454.526.698.2]0 20 40 60 80 100 120 140 160 180 200
19 40 52 61 82 92 115 134
cu
lt
iv
at
ed
ar
ea
(d
u
n
me
s)
[image:8.595.142.454.96.270.2]Nitrate (mg/l)
Figure 6. Nitrate concentration of the irrigation water in relation to the irrigated areas of citrus orchards.
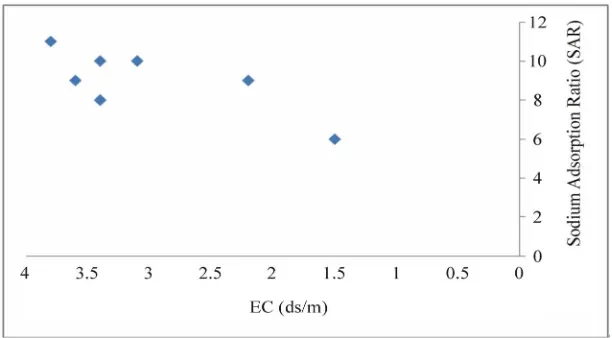
Figure 7. Electrical conductivity in relation to Sodium adsorption ration of the irrigation water of citrus orchards.
citrus production. The relation between electrical con-ductivity and SAR plays essential effect on soil proper-ties and plant yield, as shown in Figure 7, most of the irrigation water has EC values ranges from 3 to 4 has SAR values ranges from 8-11. Citrus cultivated in sandy soil in the Gaza Strip, therefore the effect of SAR on soil is neglected.
4. Conclusions
The main results of the model show that the farmers use about 20 to 30% excess irrigation water than required for the common cultivated crops. Prudent planning requires that a strong water resources research program be maintained, that decisions about future water planning and management be flexible, and that the risks and benefits of agricultural economy be incorporated into all long-term water planning. Water managers and policy- makers must start considering the excess use of irrigation
water as a serious threat to the water resources in the region.
5. Acknowledgements
The Author would like to thank Eng. Mansour Abu Kwaik from the Ministry of Planning for his constructive efforts on spatial maps preparation.
REFERENCES
[1] H. Al-Najar, “Urban Agriculture and Eco-Sanitation: The Strategic Potential toward Poverty Alleviation in the Gaza Strip,” RICS Research, Vol. 7, No. 7, 2007, pp. 9-22. [2] B. Shomer, G. Mueller and A. Yahya, “Potential Use of
Treated Wastewater and Sludge in Agricultural Sector of the Gaza Strip,” Clean Technologies and Environmental
Policy, Vol. 6, No. 2, 2004. pp. 128-137.
doi:10.1007/s10098-003-0228-5
[image:8.595.145.451.300.469.2]the Gaza Strip,” RICS Research, Vol. 5, No. 8, 2005, pp. 7-21.
[4] A. Khalaf, H. Al-Najar and J. Hamad, “Assessment of Rainwater Runoff due to the Proposed Regional Plan for Gaza Governorate,” Journal of Applied Science, Vol. 6, No. 13, 2006, pp. 2693-2704.
[5] K. Qahman, A. Larabi, D. Ouazar, A. Naji and A. H.-D. Cheng, “Optimal Extraction of Groundwater in Gaza Coastal Aquifer,” Journal Water Resource and Protection, Vol. 1, No. 4, 2009, pp. 249-259.
[6] M. Cockx and H. Simonne, “Reduction of the Impact of Fertilization and Irrigation Processes in the Nitrogen Cy-cle in Vegetable Fields with BMPs,” 2003.
http://edis.ifas.ufl.edu
[7] T. A. Bauder, I. Broner and R. M. Waskom, “Nitrogen and Irrigation Management,” 2004.
http://www. Ext.colostate.edu
[8] Food and Agriculture Organization (FAO), “Crop Evapo-transpiration-Guidelines for Computing Crop Water Requi- rements, FAO Irrigation and Drainage Paper 56,” FAO, Rome, 1998.
[9] T. A. Obreza and D. J. Pitts, “Effective Rainfall in Poorly Drained Microirrigated Citrus Orchards,” Soil Science
Society American Journal, Vol. 66, 2002, pp.212-221.
[10] S. Trajkovic, “Temperature-Based Approaches for Esti-mating Reference Evapotranspiration,” Journal Irrigation
and Drainage Engineering, Vol. 131, No. 4, 2005, pp.
316-323. doi:10.1061/(ASCE)0733-9437(2005)131:4(316)
[11] P. Droogers and R. G. Allen, “Estimating Reference Eva- potranspiration under Inaccurate Data Conditions,”
Irri-gation and drainage systems, Vol. 16, No.1, 2004, pp.
33-45.doi:10.1023/A:1015508322413
[12] Palestinian Water Authority (PWA), “Agricultural and Municipal Water Demand in Gaza Governorates for year 2005,” PWA, Gaza, 2005.
[13] R. G. Allen, L. S. Pereira, M. Smith, D. Raes and J. L. Wright, “FAO-56 Dual Crop Coefficient Method for Es-timating Evaporation from Soil and Application Exten-sions,” Journal of Irrigation and Drainage Engineering, Vol. 131, No. 1, 2005, pp. 2-13.
doi:10.1061/(ASCE)0733-9437(2005)131:1(2)
[14] Ministry of Agriculture (MoA), “Input-Output Gross Mar- gin and Profit per Dunam in the Gaza Strip,” MoA, Gaza, 2003.
[15] Palestinian Water Authority (PWA), “Coastal Aquifer Management Program (CAMP), Final Model Report (Task 7),” PWA, Palestine, 2000.
[16] M. Al-Khatib and H. Al-Najar, “Hydro-Geochemical Cha- racteristics of Groundwater beneath the Gaza Strip,” Jou-
rnal of Water Resources and Protection, Vol. 3, No. 5,
2011, pp. 341-348.
[17] A. Hilles and H. Al-Najar, “Brackish Water Desalination is the Merely Potable Water Potential in the Gaza Strip: Prospective and Limitations,” Environmental Science and
Technology, Vol. 4, No. 2, 2011, pp. 158-171.
doi:10.3923/jest.2011.158.171
[18] M. M. Yassin, S. S. Abu Amr and H. M. Al-Najar, “As-sessment of Microbiological Water Quality and Its Rela-tion to Human Health in Gaza Governorate,” Public
Health, Vol. 120, No. 12, 2006, pp. 1177-1187.