ISSN Online: 1945-3108 ISSN Print: 1945-3094
Evaluation and Impact of a Polluted Stream on
the Integrated Management of a Drinking
Water Resource: A Case Study of the Middle
Vaal River, South Africa
Shalene Janse van Rensburg
1, Sandra Barnard
2*1Midvaal Water Company, Stilfontein, South Africa
2Unit for Environmental Sciences and Management, North-West University, Potchefstroom, South Africa
Abstract
The Koekemoerspruit is a possible pollution source of the Middle Vaal River, an important drinking water source in South Africa. This case study aimed to establish the water quality of the Koekemoerspruit, to evaluate the impact of the Koekemoerspruit on the Vaal River, and to use this information to iden-tify shortcomings in the monitoring program. Monthly and weekly samples from both the Vaal River and the Koekemoerspruit were analyzed at an ac-credited testing laboratory based on ISO 17025 for 20 chemical methods. A dataset from 2002 to 2015 was statistically analyzed by means of Statistica software, the Mann-Kendall test and the Sens’s slope to determine descriptive statistics and significant trends respectively. The sites’ water quality was eva-luated by comparison with both national drinking water standards and envi-ronmental target water quality objectives. Results indicated that the target water quality objectives for orthophosphate, nitrate and nitrite, and ammonia concentrations were considerably exceeded in the Koekemoerspruit. The drinking water quality of the Koekemoerspruit and the Middle Vaal was noncompliant with South African standards. Color, electrical conductivity, turbidity, sulfate, recoverable cyanide and arsenic at one site posed aesthetic, operational, acute and chronic health risks. Color, mean ammonia and total chlorophyll concentrations displayed significant trends of increase over time and increased drastically after 2012 at the site where water enters the Middle Vaal River. However, the Koekemoerspruit did not seem to have a significant impact on the overall water quality of the Middle Vaal River, except for total chlorophyll concentrations. Moreover, the review and recommendations for optimizing the water quality monitoring program proved that original
moni-How to cite this paper: van Rensburg, S.J. and Barnard, S. (2019) Evaluation and Im-pact of a Polluted Stream on the Integrated Management of a Drinking Water Re-source: A Case Study of the Middle Vaal River, South Africa. Journal of Water Re-source and Protection, 11, 148-165. https://doi.org/10.4236/jwarp.2019.112009
Received: December 7, 2018 Accepted: January 28, 2019 Published: January 31, 2019
Copyright © 2019 by author(s) and Scientific Research Publishing Inc. This work is licensed under the Creative Commons Attribution International License (CC BY 4.0).
http://creativecommons.org/licenses/by/4.0/
Open Access
toring objectives have been achieved. The reviewed monitoring program has consequently been adopted in the water safety plan to address the shortcom-ings that were identified during this case study.
Keywords
Target Water Quality, Eutrophication, Domestic Wastewater, Mining, Pollution
1. Introduction
A healthy river ecosystem is an essential resource for surrounding communities in terms of drinking water, agriculture, and industries. Therefore, Integrated Water Resources Management (IWRM) was introduced to improve manage-ment of the physical environmanage-ment and its use by the different water divisions [1]. IWRM has to take into account both economic benefits and ecological concerns
[2]. In this respect, IWRM succeeds in satisfying present needs and usually does not consider future changes. Environmental monitoring is essential for detecting water quality and land use changes as well as associated pollution sources and other stressors, such as climate change. Monitoring is also needed to evaluate the effects of proposed environmental policies and resource use and management strategies [3]. Water related problems are better understood and controlled through the early detection and increased knowledge of the environment. Dur-ing this study we used Midvaal Water Company in South Africa (a water treat-ment plant that supplies bulk potable water from the Middle Vaal River to 501 500 consumers), as a case study to show how changes in surface water stressors due to changes in land use and socio-economic issues can impact on the chal-lenge of providing safe drinking water.
According to Reference [4], water quality monitoring is the “long-term, stan-dardized measurement and observation of the aquatic environment in order to define status and trends.” South Africa has overarching national legislation to enforce a nationally coordinated framework for monitoring, assessing and re-porting on resource water quality [5] [6]. This is of particular importance for multi-stressed rivers, like the Vaal River in South Africa, that serve as drinking water sources to many. The Koekemoerspruit is a polluted water resource that can impact on the Middle Vaal River system. The Koekemoerspruit has not only been affected by mining and municipal/urban village developments but also by agriculture. Nutrient enrichment and salinity, as a result of urbanization and gold mining, has been known to contribute to most of the deterioration of the water quality in the Koekemoerspruit. Thus the inflow of the highly utilized and impacted Koekemoerspruit into the Vaal River, upstream of the Midvaal Water Company’s abstraction point from the Vaal River, is regarded as a possible pol-lution threat. The monitoring objectives since 2002 have been to determine the water quality of the Koekemoerspruit by means of collecting water quality data. In 2015, the costs of the abovementioned monitoring programs amounted to
ZAR 4985200 (USD 363421), of which ZAR 65150 (USD 4749) (1.3% of the total amount) was spent on analytical costs for monitoring the Koekemoerspruit. The existing monitoring program was reviewed and improved after verification to see if the initial monitoring objectives have been met and whether additional monitoring objectives need to be addressed. The statistical methodology applied during this case study (mainly comparisons of descriptive statistics and deter-mination of trends) is fairly easy to use and readily available in the hope that our study might serve as an example to other facilities and enable sensible but prac-tical evaluation and monitoring of water quality to promote integrated water re-source management, especially for water services providers and authorities in developing parts of South Africa.
As Midvaal Water Company has to consider the stressed socioeconomic status of their consumers regarding water tariffs, cost-effective monitoring and man-aging of the water resource is of the essence. In view of these constraints the wa-ter quality in Koekemoerspruit has been investigated as possible source of pollu-tion to determine: 1) changing trends in the data and to identify parameters that were beyond reference limits, 2) its impacts on the water quality of the Middle Vaal River, and 3) to identify possible shortcomings in the monitoring program.
2. Materials and Methods
2.1. Study Area
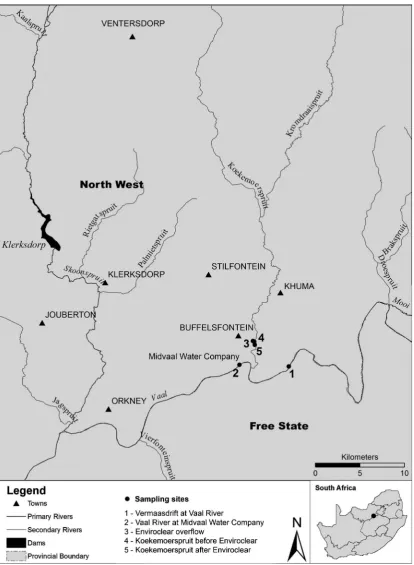
The Koekemoerspruit is a tributary of the Vaal River in the Middle Vaal Catch-ment area, South Africa. It originates from a natural underground source be-tween the towns of Klerksdorp and Ventersdorp in the North-West Province and flows over a distance of approximately 50 km in a south-south-westerly di-rection into the Vaal River about 1.6 km upstream of Midvaal Water Company’s abstraction point. The Koekemoerspruit’s embankments and flood plains are almost completely covered with Phragmites australis, a perennial reed. The study area occurs in the summer (December to January) rainfall region of the country and an average annual rainfall of 684 mm was recorded during the study period. The groundwater of the Koekemoerspruit area is easily polluted because of the permeability of the underlying dolomitic soils, which are prone to sinkhole for-mation. The Koekemoerspruit upstream of the study area is surrounded by closed goldmines and the urban village of Khuma, with a population of ap-proximately 46,000 people. The study area covered the section of the Koeke-moerspruit below Khuma up to the confluence with Vaal River, as well as sites up-stream (at the Vermaasdrift bridge) and downup-stream (at the abstraction point of Midvaal Water Company) of the confluence in Vaal River. The land use of the study area is mostly natural land with some cultivation at the confluence (Figure 1).
The South African Government Gazette 39943 No. 469 [7] has divided the Middle Vaal Catchment into eight integrated units of analysis, subdivided into smaller resource units, to which classes and target water quality objectives have been assigned. The Vaal River main stem from Vermaasdrift to upstream of the
Schoonspruit confluence (downstream of Midvaal Water Company) has been classified as a Class III resource unit, with a largely modified present and rec-ommended ecological state (Table 1). The Koekemoerspruit, from its origin to its confluence with the Vaal River, has also been classified as a Class III resource
Figure 1. Koekemoerspruit study area indicating the five study sites, streams of the catchment and surrounding towns.
unit. This is the only resource unit in Government Gazette 39943 No. 469 [7]
whose ecological state is required to be improved, from being seriously modified to being largely modified (Table 1).
2.2. Study Sites
Five study sites were identified at the onset of the water quality monitoring pro-gram in 2002 (Table 2, Figure 1).
2.3. Sampling Regime
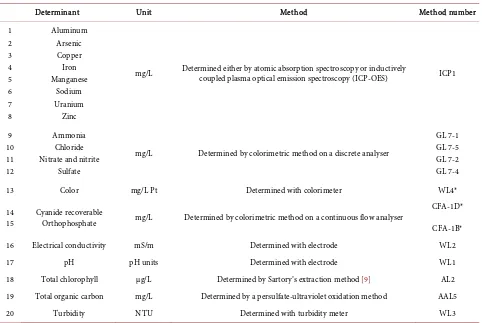
Surface water samples were collected by Midvaal Water Company Scientific Ser-vices on a monthly basis at sites 1, 3, 4 and 5 and on a daily basis at site 2. Sam-ples were chemically analyzed at Midvaal Water Company Scientific Services for 20 determinants as listed in Table 3. Midvaal Water Company Scientific Services has been an accredited South African National Accreditation System (SANAS) testing laboratory (T0132) since 2002 based on ISO 17025. Data from October 2002 to December 2015 were used for this study with the exception of data for uranium, which were collected since April 2005. The method numbers in Table 3
[image:5.595.57.537.536.736.2]refer to the SANAS accredited method as indicated on the facility’s schedule of
Table 1. Resource unit classification and ecological state of the Vaal River main stem and Schoonspruit resource unit which
incorporates the Koekemoerspruit [7].
Integrated unit of analysis Vaal River Schoonspruit
Resource unit Vaal River main stem: from Vermaasdrift to upstream of the
Schoonspruit confluence as represented by study sites 1 and 2 Koekemoerspruit: from origin to confluence with Vaal River as represented by study sites 3, 4 and 5 Water resource class III: heavily used; overall ecological condition significantly
altered from its predevelopment condition III: heavily used; overall ecological condition significantly altered from predevelopment condition
Present ecological state D: largely modified D/E: largely modified/seriously modified
Recommended ecological state D: largely modified D: largely modified
Table 2. Study sites of the Koekemoerspruit water quality monitoring program.
Site number Site name Coordinates Description
Site 1 Vermaasdrift 26˚56'10.3"S,
26˚51'00.8"E Reference point to determine impacts of Koekemoerspruit on Vaal River; part of Middle Vaal, upstream of confluence of Koekemoerspruit and Vaal River. Site 2 Vaal River 26˚56'04.5"S,
26˚48'01.4"E Vaal River at Midvaal Water Company’s abstraction point downstream of confluence of Koekemoerspruitand Vaal River. Water quality at this site is critical and determines water treatment processes and operations of Midvaal Water Company.
Site 3 Enviroclear overflow 26˚54'37.8"S,
26˚48'50.5"E ± 9 km cement canal downstream from site 4 flowing from nearby mining plant into Koekemoerspruit. Site 4 Koekemoerspruit before
Enviroclear overflow 26˚54'40.3"S, 26˚48'55.4"E Koekemoerspruit from below Khuma urban village before inflow of canal; indicates influence of urban village. Site 5 Koekemoerspruit after
Enviroclear overflow 26˚54'51.7"S, 26˚48'57.0"E Koekemoerspruit after confluence of canal with site 4; represents water that will enter Vaal River.
Table 3. Determinants monitored from October 2002 to December 2015. Method numbers marked with an (*) have not been accredited by SANAS.
Determinant Unit Method Method number
1 2 3 4 5 6 7 8 Aluminum Arsenic Copper Iron Manganese Sodium Uranium Zinc
mg/L Determined either by atomic absorption spectroscopy or inductively coupled plasma optical emission spectroscopy (ICP-OES) ICP1
9 10 11 12 Ammonia Chloride Nitrate and nitrite
Sulfate
mg/L Determined by colorimetric method on a discrete analyser
GL 7-1 GL 7-5 GL 7-2 GL 7-4
13 Color mg/L Pt Determined with colorimeter WL4*
14
15 Cyanide recoverable Orthophosphate mg/L Determined by colorimetric method on a continuous flow analyser
CFA-1D*
CFA-1B*
16 Electrical conductivity mS/m Determined with electrode WL2
17 pH pH units Determined with electrode WL1
18 Total chlorophyll µg/L Determined by Sartory’s extraction method [9] AL2
19 Total organic carbon mg/L Determined by a persulfate-ultraviolet oxidation method AAL5
20 Turbidity NTU Determined with turbidity meter WL3
accreditation [8].
2.4. Approach and Statistical Analyses
Statistica software (version 13) was used to determine the descriptive statistics (mean, standard deviation, variance and confidence interval) for all variables as prescribed and discussed by Reference [10] and to create scatter plots. The Sha-piro-Wilks test for normality was used to determine whether the data were dis-tributed parametrically. The data did not meet the assumptions of normality in the distribution of all variables. Therefore, the Kruskal-Wallis analysis of variance (nonparametric statistics) for comparing multiple independent groups was used to determine differences between concentrations of determinants measured at the different sampling sites. Results that were below the limit of quantification were divided by two to be included in data processing. Results that were above the lim-it of quantification were multiplied by two to be included in data processing.
A selection of two years (2014 and 2015) was made to evaluate the compliance of different variables with national drinking water standards and environmental target water quality objectives. These two years represented a normal rainfall year (2014) and a low rainfall year (2015). In order to ensure that variables are not removed prematurely after comparison with compliance criteria, the variance
of the data collected at each site for each variable were determined [6]. No data were available on river flow of either the Koekemoerspruit or Vaal River. There-fore, the nonparametric Mann-Kendall test for testing the presence of a signifi-cant monotonic increasing or decreasing trends and Sen’s nonparametric method for estimating the slope of a linear trend were used to discover long-term trends of discrete variables [11]. The analyses were performed with the Excel application MAKESENS 1.0 and the Mann-Kendall test and Sen’s slope estimates for the trend of annual data with version 1.0 Freeware [12].
3. Results
3.1. Water Quality of the Koekemoerspruit
[image:7.595.207.541.512.736.2]The compliance of the measured water quality determinants at sites 4 and 5 in the Koekemoerspruit with the target water quality objectives for this resource unit was evaluated using data obtained during 2014 and 2015 (Table 4) to highlight where limits have recently been exceeded. The National Department: Water and Sanitation, as the custodian of water resources, has decided after consultation with relevant stakeholders and research institutions to implement the use of percentile limits for compliance monitoring. The rationale behind this is that the percentile limits give a more accurate reflection of the true situation and elimi-nates the effects of outliers. Seeing that the target water quality objectives are in many instances stricter than the drinking water limits. The percentile limits for orthophosphate, nitrate and nitrite, and ammonia concentrations were excessive-ly exceeded at sites 4 and 5. The electrical conductivity, an indicator of saliniza-tion, did not comply with limits set for these sites, and the sulfate concentration of site 5 failed to comply with the set limit as well. Even though a target water
Table 4. Relevant 50th and 95th percentile water quality data for sites 4 and 5 from January
2014 to December 2015 compared with target water quality limits of Government Gazette 39943 No. 469 for the resource unit; noncompliances are shaded.
Quality
subcomponent Determinantindicator/measure Unit Limit Percentile Site 4 Site 5
Nutrients
Orthophosphate mg/L ≤0.125 50th 3.322 3.929 Nitrate and nitrite mg/L ≤2.5 50th 0.61 0.65 Nitrate and nitrite mg/L ≤1.35 95th 5.64 7.2
Salts Electrical conductivity mS/m ≤85 95
th 151 150
Sulfate mg/L ≤250 95th 236 257
Toxics
Cyanide (dissolved) mg/L ≤0.05 95th 0.03 0.03
Aluminum mg/L ≤0.1 95th 0.04 0.06
Manganese mg/L ≤0.25 95th 0.78 0.82
Iron mg/L ≤0.25 95th 0.29 0.30
Uranium mg/L ≤0.03 95th 0.03 0.02
Ammonia mg/L ≤0.1 95th 55 52
quality objective for dissolved cyanide exists, only recoverable cyanide was moni-tored during this water quality monitoring program. The recoverable cyanide concentrations are included in Table 4 and compared with the target water qual-ity objectives of dissolved cyanide. However, since these concentrations are ex-pected to be higher than those of dissolved cyanide, the worst-case scenarios are portrayed. The 95th percentile manganese and iron concentrations failed to comply with the set limits; in comparison manganese exceeded the limit to a much greater extent.
[image:8.595.209.539.289.729.2]The water quality compliance of sites 3, 4 and 5 with the South African Na-tional Standards (SANS) [13] for drinking water 241:2015 was evaluated for 2014 and 2015 during this study to obtain a recent overview (Table 5). The
Table 5. Average values of water quality determinants measured at sites 3, 4, and 5 from
January 2014 to December 2015 compared with the limits for drinking water as per South African National Standard 241:2015 [13]; shaded values indicate exceeded limits.
Determinant Unit Limits (associated risk) Site 3 Site 4 Site 5
Color mg/L Pt ≤15 (aesthetic) 22 98 97
pH pH units ≥5.0 to ≤9.7(operational) 8.79 7.78 7.78 Electrical conductivity mS/m ≤170(aesthetic) 209 124 124
Turbidity NTU ≤1 (operational) 61 10.6 10.7
≤5 (aesthetic) 61 10.6 10.7
Chloride mg/L - 150 106 106
Sulfate mg/L ≤500 (acute health) 810 136 163
≤250 (aesthetic) 810 136 163
Sodium mg/L ≤200 (aesthetic) 183 87 86
Ammonia mg/L - 0.7 37 34
Nitrate and nitrite mg/L - 4.8 1.7 1.7
Orthophosphate mg/L - 0.12 3.79 4.00
Cyanide recoverable mg/L ≤0.2 (acute health) 0.43 <0.02 <0.02
Total chlorophyll µg/L - 67 93 95
Iron mg/L ≤2 (chronic health) 0.07 0.14 0.14
≤0.3 (aesthetic) 0.07 0.14 0.14
Manganese mg/L ≤0.4 (chronic health) 0.05 0.44 0.45 ≤0.1 (aesthetic) 0.05 0.44 0.45
Zinc mg/L ≤5 (aesthetic) 0.03 0.03 0.03
Copper mg/L ≤2 (chronic health) 0.03 <0.01 <0.01
Aluminum mg/L ≤0.3 (operational) 0.04 0.06 0.06
Arsenic mg/L ≤0.01 (chronic health) 0.02 <0.01 <0.01 Uranium mg/L ≤0.03 (chronic health) 0.03 <0.01 0.01 Total organic carbon mg/L ≤10 (chronic health) 6.2 13 12
noncompliant color, electrical conductivity, turbidity, sulfate, recoverable cyanide and arsenic concentrations of site 3 posed aesthetic, operational, and acute and chronic health risks. The noncompliant color, turbidity, manganese, and total organic carbon concentrations measured at sites 4 and 5 posed aes-thetic, operational, and chronic health risks. The water sampled at sites 3, 4, and 5 in the Enviroclear overflow canal and Koekemoerspruit (Table 5) is not suitable for drinking purposes.
3.2. Impact of Koekemoerspruit on Water Quality of Middle Vaal
River Source Water
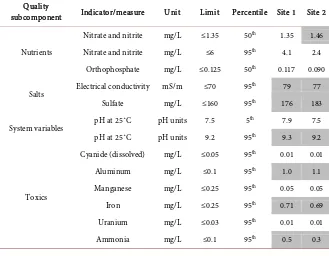
[image:9.595.207.536.471.727.2]The water quality compliance of sites 1 and 2 with target water quality objec-tives for the Vaal River main stem resource unit was also evaluated for 2014 and 2015 (Table 6). This was carried out to highlight limits that have been exceeded and to ascertain the impact of the Koekemoerspruit on the Vaal River. The Kruskal Wallis ANOVA (results not shown) indicated that the in-flow of the Koekemoerspruit did not have an impact on the water quality of the Vaal River, irrespective of whether limits were exceeded, because none of the listed determinants displayed a significant increase from site 1 to site 2. Electrical conductivity, nitrate and nitrite, sulfate, iron, and ammonia con-tents were of concern for both the Vaal River (Table 6) and the Koekemoer-spruit (Table 4). Although orthophosphate and manganese were identified as concerns for the Koekemoerspruit (Table 4), levels of these determinants complied with limits set for the Vaal River (Table 6). Aluminum content and
Table 6. Relevant 50th and 95th percentile data for sites 1 and 2 from January 2014 to
December 2015 compared with target water quality limits of Government Gazette39943 No. 469 for the resource unit; shaded values indicate noncompliance.
Quality
subcomponent Indicator/measure Unit Limit Percentile Site 1 Site 2
Nutrients
Nitrate and nitrite mg/L ≤1.35 50th 1.35 1.46 Nitrate and nitrite mg/L ≤6 95th 4.1 2.4
Orthophosphate mg/L ≤0.125 50th 0.117 0.090
Salts Electrical conductivity mS/m ≤70 95
th 79 77
Sulfate mg/L ≤160 95th 176 183
System variables pH at 25˚C pH units 7.5 5
th 7.9 7.5
pH at 25˚C pH units 9.2 95th 9.3 9.2
Toxics
Cyanide (dissolved) mg/L ≤0.05 95th 0.01 0.01
Aluminum mg/L ≤0.1 95th 1.0 1.1
Manganese mg/L ≤0.25 95th 0.05 0.05
Iron mg/L ≤0.25 95th 0.71 0.69
Uranium mg/L ≤0.03 95th 0.01 0.01
Ammonia mg/L ≤0.1 95th 0.5 0.3
pH emerged as concerns for the Vaal River but not for the Koekemoerspruit (Table 6).
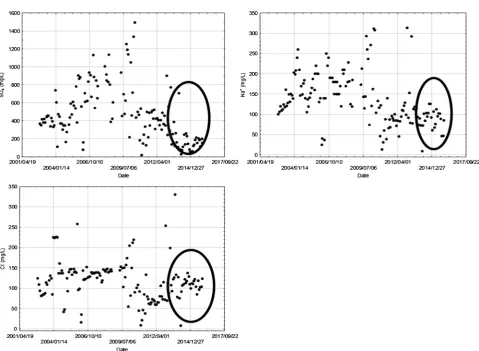
The mean values (Figure 2) for all 20 determinants were compared before and after the inflow of the Koekemoerspruit at sites 1 and 2, respectively, to determine the overall impact of the Koekemoerspruit on the Vaal River for the entire dataset (2002-2015), as not all the determinants were assigned within the target water quality objectives. Total chlorophyll values were the only mean and maximum values to show a slight increase in the Vaal River after the inflow of the Koekemoerspruit (Figure 2 and Figure 3). There were, however, no statistically significant differences between sites 1 and 2 for any of the other variables. The extremely high ammonia concentrations observed at sites 4 and 5 (Table 4 and Table 5) contributed to nutrient enrichment of the Vaal River and subsequent proliferation of algal growth.
Chloride, sulfate, total chlorophyll and sodium showed large variances in their concentrations from 2002 to 2015 at sites 1 and 2 in the Vaal River and at sites 4 and 5 in the Koekemoerspruit. The maximum concentrations shown in Figure 3
for sites 1 and 5 indicate that their respective turbidity, chloride, sulfate, total chlorophyll and sodium concentrations could jointly have contributed to the maximum levels observed at site 2 and would therefore have been able to in-crease average measured levels of these determinants at site 2.
3.3. New Environmental Concerns and Emerging Pollution
Pressures in the Koekemoerspruit
[image:10.595.165.540.455.654.2]Site 5 represents the water that flows into the Vaal River and that can impact di-rectly on the water quality of the source water destined for drinking water use.
Figure 2. Mean values derived from the water quality monitoring data for sites 1, 5, and 2 from
Oc-tober 2002 to December 2015 (n = 130 ±std); Site 1: Vaal River above the confluence of the Koeke-moerspruit; Site 5: Koekemoerspruit before the confluence with the Vaal River; Site 2: Vaal River below the confluence of the Koekemoerspruit; EC: electrical conductivity; NTU: turbidity; T.Chl: total chlorophyll; TOC: total organic carbon.
Figure 3. Maximum values derived from the water quality monitoring data for sites 1, 5, and 2 from October 2002 to December 2015; Site 1: Vaal River above the confluence of the Koekemoerspruit; Site 5: Koekemoerspruit before the confluence with the Vaal River; Site 2: Vaal River below the con-fluence of the Koekemoerspruit; EC: electrical conductivity; NTU: turbidity; T.Chl: total chlorophyll; TOC: total organic carbon.
Table 7. Mann-Kendall test and Sen’s slope estimate results showing trends of the entire
dataset (2002-2015) for site 5, indicating determinants for which a significant annual trend was observed.
Determinant Mann-Kendall test trend level Sen’s slope estimate
Ammonia 0.05 0.631
Color 0.01 2.345
Sodium 0.1 −6.993
Total chlorophyll 0.01 1.152
Determinants that showed a statistically significant increase in concentration over time were viewed as posing a risk to the Vaal River. To determine whether any of the variables illustrated in Figure 3 demonstrated an increasing trend over the long term, the temporal version of the nonparametric Mann-Kendall test was performed [11]. This was done using the entire dataset (2002-2015) for site 5; only the determinants with statistical significant increases/decreases are listed in Table 7. According to the results of the Mann-Kendall test there are statistically significant increases in ammonia (p = 0.05), color (p = 0.01) and to-tal chlorophyll (p = 0.01) during the study period. Color and toto-tal chlorophyll concentrations exhibited the highest increases (slope estimates of 2.345 and 1.152 respectively) during the study period. Domestic wastewater effluent is, however, more likely to be a contributing factor based on the high ammonia concentrations and other sewage-related determinants (Figure 4 and Table 4).
The color, ammonia, and total chlorophyll concentrations measured at site 5 not only showed a significant increase over the entire study period but also exhi-bited drastic increases from 2012 (Figure 4) onwards. The total organic carbon
[image:11.595.206.540.395.472.2]Figure 4. Mean concentrations of ammonia, total chlorophyll, total organic carbon (TOC), and color revealed drastic increases in the Koekemoerspruit as measured during the water quality monitoring program after 2012 at site 5.
concentration measured at site 5 demonstrated a great deal of variability but a general increase as shown in Figure 4. The seasonal burning of Phragmites
aus-tralis may also contribute to this variability of the total organic carbon
concen-trations.
The sulfate, sodium, and chloride concentrations measured at site 5 prior to 2012 were especially high. These determinants showed much lower concentra-tions from 2012 onwards (Figure 5), which was particularly noticeable when compared with the SANS 241:2015 [13] limits for sulfate and sodium (500 and 200 milligrams per liter, respectively).
4. Discussion
Mining activities in the Koekemoerspruit area surrounding the study site have declined significantly over the past five years. The City of Matlosana showed that mining activities have downscaled drastically specifically in the year 2011 which lead to 75% of original workforce to be retrenched [14]. This was also evident in the results of the water quality of the Koekemoerspruit.
Figure 5. Mean concentrations for sulfate, sodium, and chloride in the Koekemoerspruit were at alarming levels at times during the water quality monitoring program from 2002 to 2015 at site 5 despite a general decrease in concentration over time.
In this case study, the target water quality objectives for Koekemoerspruit in-dicated that orthophosphate, nitrate and nitrite, electrical conductivity, sulfate, manganese, iron and ammonia exceeded the relevant limits. Color, turbidity, manganese, and total organic carbon were the determinants of concern in the Koekemoerspruit when considering the SANS 241:2015 limits for drinking water. The alarming electrical conductivity, turbidity, chloride, sulfate, sodium, reco-verable cyanide, arsenic and uranium concentrations at site 3 are directly asso-ciated with mining activities. However, it did not have a significant impact on the water quality of the Koekemoerspruit after the inflow of the canal. This could perhaps be ascribed to the low flow volume of the canal or absence of flow at times as sampling was possible only 80% of the time. The decline in mining ac-tivities is evident in the decline of sulfate, sodium and chloride concentrations at site 5 since 2012.
The long term increasing trend demonstrated for ammonia together with total organic carbon concentrations suggested that upstream domestic wastewater ef-fluent or agricultural runoff currently has the largest impact on the Koekemoer-spruit. The extremely high ammonia concentrations suggest discharge of un-treated domestic wastewater effluent, which contributes to the increasing total
chlorophyll, and results in the eutrophication of the Koekemoerspruit. Sewage discharge is a major component of water pollution, contributing to oxygen de-mand and nutrient loading of water bodies, promoting toxic algal blooms and leading to a destabilized aquatic ecosystem [15]. The declining state of municipal wastewater and sewage treatment infrastructure in South Africa is one of the largest contributing factors to the numerous pollution problems and is a major contributor to health problems in poor communities [16], such as that in the study area. Investigations conducted on South African water resources have shown that poor operation and maintenance of domestic wastewater treatment plants have a great impact on both the environment and human health. The in-creasing population of the Khuma urban village [14], together with doubtful in-frastructure and operation of wastewater treatment plants upstream from site 4, most probably contributed to the decline of the Koekemoerspruit’s water quality. This is also evident from the upsurges in ammonia, total organic carbon and color concentrations observed at site 5, especially since 2012.
The inflow of the Koekemoerspruit into the Vaal River did not seem to have a significant impact on the overall water quality of the Vaal River when water quality upstream of the convergence at site 1 was compared with that down-stream of the convergence at site 2. However, total chlorophyll concentrations increased after the inflow of the Koekemoerspruit. A significant trend of in-crease over a long period of time has been demonstrated for chlorophyll con-centrations in the Koekemoerspruit and therefore would have a greater impact on the chlorophyll concentrations of the Middle Vaal River. A previous study on Midvaal Water Company by Reference [17] indicated that increasing chlorophyll concentrations and associated taste and odors, as well as fluctuating turbidity levels, are the main challenges that affect the water treatment process at this treatment plant. Although orthophosphate and ammonia concentrations are not directly addressed in South African drinking water standards, together with ni-trate and nitrite, they can contribute to nutrient enrichment of a water body and subsequent algal growth. Taste and odors can be associated with nuisance algal blooms, such as that of Microcystis sp., Oscillatoria sp., and Planktothrix sp., which occur in the Koekemoerspruit. They are responsible for the presence of geosmin and/or 2-methylisoborneol. The odor threshold concentrations for these compounds range from 4 to 20 nanograms per liter [17] and therefore af-fect downstream drinking water treatment despite dilution of the Koekemoer-spruit’s inflow into the Vaal River.
The changes recommended for the water quality monitoring program of the Koekemoerspruit are summarized in Table 8. Ammonia was not previously identified as a major concern but, as indicated by Government Gazette 39943 No. 469 [7], should be monitored for the Koekemoerspruit resource unit, along with electrical conductivity, sulfate, magnesium, nitrate and nitrite, orthophosphate, cyanide, iron, manganese, aluminum and uranium. Magnesium has also not been monitored for sites 1, 3, 4, and 5 to date and therefore has to be included in
Table 8. Proposed revised monitoring program for the Koekemoerspruit after evaluation of data collected from 2002 to 2015 and the identification of shortcomings
Determinants Existing or new determinant Frequency Government Gazette Regulated by No. 39943 Magnesium and
dissolved cyanide New Monthly Yes
Escherichia coli and
coliforms Replace faecal coliform monitoring Monthly Yes
Microcystin, geosmin
& 2-methylisoborneol New
Dependent on algal blooms or taste and
odor episodes No
Gross alpha/beta
activity New Dependent on uranium concentrations No
the water quality monitoring program. Recoverable cyanide was monitored for the study period and can be replaced with the analysis of dissolved cyanide ac-cording to the target water quality objectives as per Government Gazette 39943 No. 469 [7]. The monitoring of color, total chlorophyll and total organic carbon has to continue and the frequency cannot be reduced, as these determinants are expected to increase in the future due to ongoing pollution activities upstream; they have subsequently been identified as possible risks. Due to the increasing threat of sewage pollution, additional microbial determinants should be consi-dered for inclusion in the routine water quality monitoring program, in
particu-lar Escherichia coli, other coliforms and cyanobacterial toxins like microcystin.
The monitoring of arsenic should continue, as site 3 poses a possible risk to the Koekemoerspruit. The monitoring of pH, turbidity, chloride, sodium, zinc, and copper can either be reduced to quarterly or annual monitoring or omitted from the monitoring program, because the concentrations of these determinants did not exceed any limits or indicated a concentration increase from 2002 to 2015. The analysis of gross alpha/beta activity is suggested based on elevated uranium concentrations at site 3 to identify the associated risks. It was the first time that the Koekemoerspruit monitoring program was evaluated during this case study and should be evaluated again in future to determine whether the revised moni-toring program still holds true.
Even though legislation requires evidence of risk-based monitoring and man-agement, no specific guidelines are currently available. In optimizing the moni-toring program based on water quality monimoni-toring data the following recom-mendations could be made:
1) The monitoring of radio activity in the Koekemoerspruit is recommended due to the borderline uranium concentrations.
2) Algal identification and geosmin/2-methylisoborneol analyses of the Koe-kemoerspruit during taste and odor episodes are also recommended to establish possible aesthetic, health and environmental risks.
3) The water safety plan should be revised to state that the decreasing raw
water quality is due to upstream domestic wastewater effluent or runoff and not mining activities anymore.
4) Site 4 may be omitted from the monitoring program as it did not seem to have a significant impact on the water quality of site 5.
5) The water quality status of the Koekemoerspruit may be communicated to the community for them to understand the health-related risks and how it may impact their drinking water source.
6) Monitoring can never substitute sound management principles. Monitor-ing can be significantly reduced if the pollution source of the Koekemoerspruit is remedied.
It remains imperative to be aware that the management of water quality mon-itoring should never overshadow the management of the water quality itself [18]
as interventions and corrective actions ensure improvement of water quality. Monitoring programs should however be reviewed and the data continuously evaluated, using at least descriptive statistical methods (confidence interval and variance) to indicate variance in water quality determinants and to determine the level of compliance to set objectives and standards. The review of a moni-toring program can be prompted by schedule, new legislation, costs, or an emerging environmental impact.
5. Conclusion
Evaluation of the monitoring data showed that the water flowing from Koe-kemoerspruit into the Middle Vaal River dilutes to a great extent and there-fore it mostly has a reduced impact. Total chlorophyll concentrations of the Koekemoerspruit did however have a significant impact on the Vaal River and also showed an increasing trend over time. The increasing trends in am-monia and total organic carbon suggested that upstream domestic wastewater effluent or agricultural runoff and not mining, currently has the largest im-pact on the Koekemoerspruit. The risks/hazards addressed in Midvaal Water Company’s water safety plan remains relevant and applicable. The application of the target water quality objectives proved to be a valuable tool to evaluate monitoring data. The evaluation and review of monitoring data have identi-fied several new concerns and avenues of optimization for the Koekemoer-spruit water quality monitoring program. The monitoring program is both effective and necessary, as the determinants of concern in the Koekemoer-spruit pose a risk for the use of Vaal River water as a drinking water source downstream. However, the lack of guidelines on how to review a monitoring program would contribute significantly to the ongoing optimization of such programs. The challenges faced by Midvaal Water Company were examined, highlighting the importance of adopting a holistic approach when investigat-ing water quality problems. The focus of water quality monitorinvestigat-ing programs as part of integrated management should not only be to identify risks but also to protect the environment.
Acknowledgements
The authors hereby express their gratitude to Midvaal Water Company for making their pollution monitoring data available for this study. We would like to thank Me M Krüger (Director: Operations—Midvaal Water Company) for her valuable contribution and discussions as well as Me E Harris for her editorial input. We would like to thank the National Research Foundation for financial support (UID296036).
Conflicts of Interest
The authors declare no conflicts of interest regarding the publication of this pa-per.
References
[1] Bartram, J. and Ballance, R. (1996) Water Quality Monitoring: A Practical Guide to the Design and Implementation of Freshwater Quality Studies and Monitoring Programmes. Taylor & Francis, London and New York, 383 p.
[2] Canadian Council of Ministers of the Environment (2015) Guidance Manual for optimizing Water Quality Monitoring Programme Design, PN.
[3] Claassen, M. (2013) Integrated Water Resource Management in South Africa. In-ternational Journal of Water Governance, 1, 323-338.
https://doi.org/10.7564/13-IJWG12
[4] Department of Water and Sanitation (DWS) (1997) Water Services Act (Act No. 108 of 1997): Regulations Relating to the Compulsory National Standards and Measures to Conserve Water, as published by Government Notice No. 509 (Gov-ernment Gazette No. 22355) of 8 June 2001.
[5] Department of Water and Sanitation (DWS) (2016) Government Gazette 39943 No. 469, Classes and Resource Quality Objectives for the Middle Vaal Catchment, 22 April 2016.
[6] Eldridge, S.L.C., Wherry, S.A. and Wood, T.M. (2014) Statistical Analysis of the Water-Quality Monitoring Programme, Upper Klamath Lake, Oregon, and Opti-mization of the Programme for 2013 and Beyond, U.S. Geological Survey.
https://dx.doi.org/10.3133/ofr20141009
[7] Hallett, C. S., Valesini, F., Scanes, P., Crawford, C., Gillanders, B.M., Pope, A., Udy, J., Fortune, J., Townsend, S., Barton, J., Ye, Q., Ross, D.J., Martin, K., Glasby, T. and Maxwell, P. (2016) A Review of Australian Approaches for Monitoring, Assessing and Reporting Estuarine Condition: II. State and Territory Programmes. Environ-mental Science & Policy, 66, 270-281. https://doi.org/10.1016/j.envsci.2016.07.013
[8] Housing Development Agency (HAD) (2015) City of Matlosana—North West, Housing Market Overview, Human Settlements Mining Town Intervention, 2008-2013.
http://thehda.co.za/pdf/uploads/multimedia/City_of_Motlosana___Nort_West.pdf
[9] Igbinosa, E.O. and Okho, A.I. (2009) Impact of Discharge Wastewater Effluents on the Physico-Chemical Qualities of a Receiving Watershed in a Typical Rural Com-munity. International Journal of Environmental Science and Technology, 6, 175-182. https://doi.org/10.1007/BF03327619
[10] Janse van Rensburg, S., Barnard, S. and Krüger, M. (2016) Challenges in the Potable
Water Industry Due to Changes in Source Water Quality: Case Study of Midvaal Water Company, South Africa. Water SA, 42, 633-640.
https://doi.org/10.4314/wsa.v42i4.14
[11] Lovett, G.M., Burns, D.A., Driscoll, C.T., Jenkins, J.C., Mitchell, M.J., Rustad, L., Shanley, J.B., Likens, G.E. and Haeube, R. (2007) Who Needs Environmental Mon-itoring? Frontiers in Ecology and the Environment, 5, 253-260.
https://doi.org/10.1890/1540-9295(2007)5[253:WNEM]2.0.CO;2
[12] Mema, V. (2010) Impact of Poorly Maintained Wastewater Sewage Treatment Plants—Lessons From South Africa Wastewater Management. ReSource, 12, 60-65 [13] Rivett, U., Champanis, M. and Wilson-Jones, T. (2013) Monitoring Drinking Water Quality in South Africa: Designing Information Systems for Local Needs. Water SA, 39, 409-414. https://doi.org/10.4314/wsa.v39i3.10
[14] Salmi, T., Määttä, A., Anttila, P., Ruoho-Airola, T. and Amnell, T. (2002) Detecting Trends of Annual Values of Atmospheric Pollutants by the Mann-Kendall Test and Sen’s Slope Estimates—The Excel Template Application MAKESENS. Finnish Me-teorological Institute, Publications on Air Quality No. 31 Report code FMI-AQ-31. [15] South African National Accreditation System (SANAS) (2017).
https://www.sanas.co.za/schedules/testing/T0132-05-2018.pdf
[16] South African National Standard (SANS). 241-1: 2015 Drinking Water, Part 1: Mi-crobiological, Physical, Aesthetic and Chemical Determinants. 241-2: 2015 Drinking Water, Part 2: Application of SANS 241-1.
[17] Swanepoel, A., Du Preez, H., Schoeman, C., Janse van Vuuren, S. and Sundrama, A. (2008) Condensed Laboratory Methods for Monitoring Phytoplankton, Including Cyanobacteria, in South African Freshwaters. Water Research Commission Report No.TT 323/08. South African Water Research Commission, Pretoria.
[18] United Nations Educational, Scientific and Cultural Organization (UNESCO) (2009) IWRM Guidelines at River Basin Level. Part 1: Principles.
https://en.unesco.org/themes/water-security/hydrology/programmes/iwrm/resources
![Table 1. Resource unit classification and ecological state of the Vaal River main stem and Schoonspruit resource unit which incorporates the Koekemoerspruit [7]](https://thumb-us.123doks.com/thumbv2/123dok_us/9212837.408272/5.595.57.537.536.736/table-resource-classification-ecological-schoonspruit-resource-incorporates-koekemoerspruit.webp)

![Table 5. Average values of water quality determinants measured at sites 3, 4, and 5 from January 2014 to December 2015 compared with the limits for drinking water as per South African National Standard 241:2015 [13]; shaded values indicate exceeded limits](https://thumb-us.123doks.com/thumbv2/123dok_us/9212837.408272/8.595.209.539.289.729/determinants-measured-january-december-national-standard-indicate-exceeded.webp)