RESPONSE TO DIRECT SELECTION FOR GRAIN YIELD IN
ORYZA SATIVA IR58025B X
UNDER IRRIGATED AND STRESS CONDITIONS
*
,1, 3,4,5Kiran, B.,
1,2Mohan Kumar Varma
1Rajendra Krishna, G. V.,
1,71
Barwale Foundation, Himayathnagar, Hyderabad
2
Bayer Bio Science Pvt. Ltd, Seeds
3
Bayer Bio Science Pvt. Ltd, Madhapur,
4
Directorate of Rice Research, Rajendra nagar, Hyderabad
5
Department of Genetics, Osmania University, Hyderabad
7
Kaveri Seeds Pvt. Ltd, Hyderabad,
ARTICLE INFO ABSTRACT
Rice (O. sativa
Latin America as well. It is one of the important food crops drastically affected by raise in global temperature and has an impact througho
security. The objective of this study was to evaluate the effectiveness of direct selection for grain yield under heat and irrigated conditions. 274 BC
meridionalis
tolerance under irrigated and stress conditions. Analysis of variance and genetic
substantial genetic variation among progenies under both stress and control conditions. The genotypic coefficient of variation ranged from 1.57 for canopy temperature to 77.29 for line yield per plot, whereas, the phenotypic coefficient of variation ranged from 4.31 for panicle temperature to 91.68 for spikelet fertility. The GCV ranged from 6.35 (panicle length) in control to 77.29 (line yield) in stress condition, the PCV ranged from 9.71 (panicle length) to 93.20 (line yield)
temperature, canopy temperature and leaf area index the GCV ranged from 1.57 (canopy temperature) to 17.13 (leaf area index) in stress, the PCV ranged from 1.84 (pa
Broad sense heritability estimates varied from 0.34 (panicle temperature) to 0.86 (plant height) in control condition, and 0.12 (canopy temperature) to 0.77 (Days to 50% flowering) in stress condition
can be a novel
expansion of the cultivated gene pool of
Copyright © 2016 Kiran et al. This is an open access article distributed
distribution, and reproduction in any medium, provided the original work is properly cited.
INTRODUCTION
Rice is a major staple cereal cropping system of south and Southeast Asia. Plant’s peaceful way of living is often disturbed by a number of environmental factors, among which abiotic factors are of crucial importance. Global warming has become a big concern in sustaining and improving agricultural productivity.
*Corresponding author: Kiran, B.
Barwale Foundation, Himayathnagar,
Hyderabad-ISSN: 0975-833X
Article History:
Received 22nd October, 2015
Received in revised form 05th November, 2015
Accepted 18th December, 2015
Published online 31st January,2016
Key words:
Heat stress, O.meridionalisNg., Global warming, Inter-specific population,Heritability, Yield under heat stress.
Citation: Kiran, B., Mohan Kumar Varma, C.,
Kishor, P. B. and Subba Rao, L. V. 2016. “Response to direct selection for grain yield in interspecific population of
Oryza meridionalis Ng., mapping population under irrigated and stress conditions
RESEARCH ARTICLE
RESPONSE TO DIRECT SELECTION FOR GRAIN YIELD IN INTERSPECIFIC
IR58025B X ORYZA MERIDIONALIS NG., MAPPING POPULATION
UNDER IRRIGATED AND STRESS CONDITIONS
Mohan Kumar Varma, C
.,
5Maheshwari Parveda,
6Kalmeshwer
1,7
Vinay Shenoy,
5Kavi Kishor, P. B. and
4Barwale Foundation, Himayathnagar, Hyderabad-500 029,
Bayer Bio Science Pvt. Ltd, Seeds-Singapore-118535, India
Bayer Bio Science Pvt. Ltd, Madhapur, Hyderabad-500081,
Directorate of Rice Research, Rajendra nagar, Hyderabad-500 030,
epartment of Genetics, Osmania University, Hyderabad-500 007,
6
Monsanto, Udaipur, India
Kaveri Seeds Pvt. Ltd, Hyderabad, India
ABSTRACT
O. sativa L.) is one of the world’s most important crops, particularly in Asia, but increasingly in Africa and
Latin America as well. It is one of the important food crops drastically affected by raise in global temperature and has an impact throughout worldwide on people who depend on rice production for their livelihoods and food security. The objective of this study was to evaluate the effectiveness of direct selection for grain yield under heat and irrigated conditions. 274 BC2F6 BILs were derived from a cross between
meridionalis Ng. (2n = 24, AA), a heat tolerant wild species to evaluate 18 yield and its related traits and for heat
tolerance under irrigated and stress conditions. Analysis of variance and genetic
substantial genetic variation among progenies under both stress and control conditions. The genotypic coefficient of variation ranged from 1.57 for canopy temperature to 77.29 for line yield per plot, whereas, the phenotypic efficient of variation ranged from 4.31 for panicle temperature to 91.68 for spikelet fertility. The GCV ranged from 6.35 (panicle length) in control to 77.29 (line yield) in stress condition, the PCV ranged from 9.71 (panicle length) to 93.20 (line yield) in stress condition. Further, for physiological traits like flag leaf temperature, panicle temperature, canopy temperature and leaf area index the GCV ranged from 1.57 (canopy temperature) to 17.13 (leaf area index) in stress, the PCV ranged from 1.84 (panicle temperature to 27.05 (leaf area index) in stress. Broad sense heritability estimates varied from 0.34 (panicle temperature) to 0.86 (plant height) in control condition, and 0.12 (canopy temperature) to 0.77 (Days to 50% flowering) in stress condition
can be a novel source of natural genetic variation for the improvement of rice expansion of the cultivated gene pool of O. sativa.
is an open access article distributed under the Creative Commons Attribution License, which distribution, and reproduction in any medium, provided the original work is properly cited.
Rice is a major staple cereal cropping system of south and Southeast Asia. Plant’s peaceful way of living is often disturbed by a number of environmental factors, among which abiotic factors are of crucial importance. Global warming has n in sustaining and improving agricultural
-500 029, India.
High temperature is one of the most important abiotic stresses that reduce crop yield and quality
2005). Global warming has increased due to rapid increase in atmospheric greenhouse gasses (Easterling
et al., 2007). Over the past 100 years, the global average
temperature has increased by 0.6 continue to rise at a rapid rate (Root
0.5 to 2.80 C increase predicted by the end of the 21 (Meehle et al., 2005, Vuuren et al
International Journal of Current Research
Vol. 8, Issue, 01, pp.25053-25061, January, 2016
INTERNATIONAL
B., Mohan Kumar Varma, C., Maheshwari Parveda, Kalmeshwer Gouda, P., Rajendra Krishna, G. V., Vinay Shenoy, Kavi Response to direct selection for grain yield in interspecific population of
population under irrigated and stress conditions”, International Journal of Current Research,
INTERSPECIFIC POPULATION OF
MAPPING POPULATION
Kalmeshwer Gouda, P.,
4Subba Rao, L. V.
500 029, India
India
500081, India
500 030, India
500 007, India
L.) is one of the world’s most important crops, particularly in Asia, but increasingly in Africa and Latin America as well. It is one of the important food crops drastically affected by raise in global temperature and ut worldwide on people who depend on rice production for their livelihoods and food security. The objective of this study was to evaluate the effectiveness of direct selection for grain yield under heat from a cross between Oryza sativa IR58025B and Oryza Ng. (2n = 24, AA), a heat tolerant wild species to evaluate 18 yield and its related traits and for heat tolerance under irrigated and stress conditions. Analysis of variance and genetic estimates indicated there is substantial genetic variation among progenies under both stress and control conditions. The genotypic coefficient of variation ranged from 1.57 for canopy temperature to 77.29 for line yield per plot, whereas, the phenotypic efficient of variation ranged from 4.31 for panicle temperature to 91.68 for spikelet fertility. The GCV ranged from 6.35 (panicle length) in control to 77.29 (line yield) in stress condition, the PCV ranged from 9.71 (panicle in stress condition. Further, for physiological traits like flag leaf temperature, panicle temperature, canopy temperature and leaf area index the GCV ranged from 1.57 (canopy temperature) to 17.13 nicle temperature to 27.05 (leaf area index) in stress. Broad sense heritability estimates varied from 0.34 (panicle temperature) to 0.86 (plant height) in control condition, and 0.12 (canopy temperature) to 0.77 (Days to 50% flowering) in stress condition. Hence, this species source of natural genetic variation for the improvement of rice and simultaneously help in
ribution License, which permits unrestricted use,
High temperature is one of the most important abiotic stresses that reduce crop yield and quality (Peng et al., 2004, Lin et al., 2005). Global warming has increased due to rapid increase in
atmospheric greenhouse gasses (Easterling et al., 1997, Lee 2007). Over the past 100 years, the global average
ed by 0.60 C and is projected to continue to rise at a rapid rate (Root et al., 2003), with another C increase predicted by the end of the 21st century
et al., 2008).
INTERNATIONAL JOURNAL OF CURRENT RESEARCH
Gouda, P., Rajendra Krishna, G. V., Vinay Shenoy, Kavi
Response to direct selection for grain yield in interspecific population of Oryza sativa IR 58025b x
Therefore any further increase in mean temperature during any stage may reduce the grain yield of rice estimated at 41% by the end of the 21st century. Hence, breeding rice varieties with heat tolerance and contribute for increase of overall productivity of rice is a big challenging tasks.
Increasing the yield of plants is a major thrust research area of crop improvement. The effect of heat on rice growth stages is exploited in various studies and it is found that the flowering stage is the most sensitive stage to high temperature (Sato et
al., 1973, Satake and Yoshida 1978). High temperatures over
350 C at flowering stage cause high pollen and spikelet sterility, which leads to serious yield losses, low grain quality and low harvest index (Osada et al., 1973, Matsushima et al., 1982, Matsui et al., 1997a,b, Zhong et al., 2005). The main cause of spikelet sterility induced by high temperature at flowering stage is anther indehiscence. The anthers of heat tolerant cultivars dehisce more easily than those of susceptible cultivars under high temperature conditions (Satake and Yoshida 1978, Mackill et al., 1982, Matsui et al., 1997a,b, 2001). This is because of the tight closure of the lodicules by the cell layers, which delays spikelet opening and decreases spikelet fertility at high temperature (Matsui and Omasa, 2002). It was suggested that spikelet fertility at high temperature can be used as a screening tool for heat tolerance during the flowering stage (Prasad et al., 2006). Due to domestication, modern rice to be cultivated in hotter climate may be limited by its narrow gene pool (Zhu et al., 2007).
In wild progenitors still unexploited genetic variation is present (Wang et al., 1992), hence attempts to utilize it have been successful with wild species. O. Meridionalis Ng. has drought avoidance traits (Somanthri 2001, Brar & Kush 1997) and better adaptation strategies to avoid adverse climatic conditions than O. sativa L. (Second 1988), it also has good levels of tolerance to heat compared with O. sativa L. (Andrew
et al., 2009) is a good source for root traits under moisture
stress (Kalmesh et al., 2012). N22 cultivar was the most heat tolerant genotype (64–86% fertility at 38° C) and cultivars Azucena and Moroberekan the most susceptible (<8%) reported by Jagadish et al., 2008 and Moroberekan was the most heat-sensitive genotype (18% spikelet fertility at 38° C), while IR64 (48%) and N22 (71%) were moderately and highly heat tolerant reported by Jagadish et al., 2009 and there were significant differences among the genotypes in anther length and width, apical and basal pore lengths, apical pore area, and stigma and pistil length for spikelet fertility under heat stress reported by Jagadish et al., 2010. The purpose of the study was to evaluate yield, yield related traits, their assessment and association under heat stress and control conditions from 274 BILs progenies generated through a cross between IR58025B and O. meridionalis Ng. It has proved that O. meridionalis Ng. withstands abiotic stresses like it has heat and drought avoidance traits and better adaptation in adverse climate conditions than O. sativa L. and good source for root traits under moisture stress hence it has also chance to withstand
heat stress condition in adverse conditions, so that present population was developed and designed in such a way that to evaluate yield and its related traits to assessment and association under stress and control conditions.
MATERIAL AND METHODS
Experimental Location
The study was conducted at experimental farm of the Barwale Foundation, Maharajpet, Hyderabad, India, located at latitude 17024’ N and longitude 78012’ E and a altitude of 536 m above mean sea level. Details of the soil condition during the crop growth are presented in Table 1.
Plant material
Oryzameridionalis Ng. (IRGC101145) was used as donor
parent, it is an annual diploid (2n = 24) wild species of northern Australia with AA genome and having compatibility with O. sativa species (Lu et al.,., 1997, 1998). IR58025B, a popular maintainer line in hybrid breeding programs was used as recurrent parent in this study.
Population development
The mapping population was derived from a cross between O.
sativa IR58025B and O. meridionalis Ng. using advanced
backcross method, which is a strategy widely adopted in transferring favorable alleles from phenotypically poor wild/ weedy species to elite cultivars/ lines (Tanksley et al., 1996). F1 plants produced from the cross IR58025B X O. meridionalis
Ng. Were selected based on phenotype and confirmed genotypically by using simple sequence repeat (SSR) markers which showed polymorphism between the parents. The F1s
were backcrossed to IR58025B recurrent parent (RP) to derive BC1F1 plants, these lines were backcrossed with recurrent
parent to obtain BC2F1 seeds, from each BC1F1 plant were
backcrossed with recurrent parent and from that 274 BC2F1
individuals generated. All the plants were allowed to self to get BC2F2 plants. 274 BC2F2 families were advanced to BC2F6
generation by subsequent selfing without applying any selection pressure. All the 274 families of the population along with its RP and checks were evaluated for heat tolerance under stress as well as control conditions.
Trial management
In both stress and control trials, basal fertilizer was applied at the rate of 50-40-40 kg NPK per ha, and were top-dressed twice with 30 kg N per ha at 2 and 6 weeks after planting. Weeds and insect pests were controlled by chemically to ensure healthy crop. Randomized complete block design (RCBD) method of planting was used for both stresses as well as control conditions.
[image:2.595.77.510.76.109.2]25054 Kiran et al. Response to direct selection for grain yield in Interspecific population of Oryza sativa ir58025b x Oryza meridionalis Ng., mapping population under irrigated and stress conditions
Table 1. Details of meteorological conditions during the phenotypic evolution
Season Rainfall Evapotranspiration Temperature (°C) RH (%) Wind speed (Km/h)
(mm) (mm) Mean Min max
Stress Field experiments procedure
In Stress trials, all 274 BC2F6 progenies along with recurrent
parent seeds were sown in the nursery and 3-4 weeks old seedlings were transplanted to the main field. Staggered sowings and plantings were done in order to synchronize the flowering period of the crop at the same time and allow it to expose to maximum heat during the peak dry season. Each of the progenies and RP consisted of 30 plants in three rows of 10 plants each with spacing of 20 cm between plants and 30 cm between rows. After transplanting, standard agronomic practices were followed until the crop attains the reproductive stage, approximately 2-3 cm of standing water level was maintained in the field till the crop attained reproductive stage. Later in order to impose stress during the early flowering stage of the crop, complete standing water present in the field was drained out before taking the observations.
Control Field experiment procedure
In control trials, all 274 BC2F6 progenies along with recurrent
parent seeds were sown in the nursery and 3-4 weeks old seedlings were transplanted to the main filed. Staggered sowings and plantings were done in order to synchronize the flowering period of the crop at the same time and allow it to expose to maximum heat during the peak dry season. Each of the progenies and RP consisted of 30 plants in three rows of 10 plants each with spacing of 20 cm between the plants and 30 cm between rows. After transplanting, standard agronomic practices were followed until the crop attained maturity and approximately 3-4 cm standing water level maintained until crop was ready for harvest. At the time of reproductive stage all observations were recorded in the presence of standing water in the field.
Phenotypic evaluation of population
Five plants were selected from the center at random from recurrent parent and each of the 274 BC2F6 families and RP in
each replication and evaluated for the following 18 yield related traits: Plant height (ph) measured in centimeters (cm) from the soil surface to the tip of the tallest panicle (awns excluded), days to 50 per cent flowering (df) as number of days from sowing to panicle emergence in 50 percent of the plants, tiller number per plant (tn) was recorded as total number of tillers per plant at maturity, panicles per plant (pn) was recorded as total number of panicle bearing tillers in each plant at the time of harvest, panicle length (pl) was recorded as the length of the panicle measured from ciliate ring to the tip of the panicle excluding awns if any, flag Leaf Length (fll) was recorded as average of length of flag leaf from top to bottom from five plants, flag leaf width (flw) was recorded as the average of width of flag leaf approximately at its middle from five plants, grain number (GN) was calculated by counting number of filled spikelet’s per panicle averaged over five randomly chosen panicles in each plant. spikelet number per panicle (spp) was recorded as total number of filled grains calculated by counting number of filled spikelet’s per panicle over five randomly chosen panicles in each plant, spikelet fertility (sf) was total number of filled and unfilled grains recorded as counted from five randomly selected panicles and
mean of filled and unfilled grains per panicle calculated to estimate the percent fertile spikelet’s in a panicle, test weight (tw) weight of 1000 randomly selected dried grains from each plant was recorded and expressed in grams as test weight, grain yield per plant (gy) the weight of the dried and cleaned grains from five plants was measured and average is recorded and expressed in grams (g), biomass (bm) was calculated as the average weight of the five well-dried plants whose panicles had been removed, specific leaf area (sla) was measured from the length and width of blades multiplies with 0.725 (correction factor) gives the leaf area.Observations related to assessment of impact of rise in temperature or heat on the crop was recorded by a hand-held infrared sensor (Davis, USA). We adopted a modified method of Fischer et al., 1998, for recording observations related to heat tolerance screening. Readings were recorded from late morning to early afternoon during cloudless periods (10:00 to 14:00 h), flag leaf temperature (flt) was recorded manually by holding the infra- red sensor at a distance of approximately 15cm from the middle of flag leaf, panicle temperature (pt) was recorded using infrared sensor by holding it at a distance of approximately 15 cm from the middle of panicle at flowering stage, canopy temperature (ct) was recorded by using infrared sensor by holding it at a distance of approximately 15 cm from a plant.
Statistical analysis
The data collected from control and heat stress condition and were the mean data subjected to analysis of variance using CROPSTAT version 7.2.3. Analysis of variance and covariance for all traits were done according by Panse and Sukhatme 1985. The phenotypic and genotypic coefficients of variability were estimated as per the Burton 1952. Broad-sense heritability was calculated using formula suggested by Lush (1940). The Correlation coefficient analyses were done according to Dewey and Lu (1959).
RESULTS AND DISCUSSION
In the present study results from the analysis of variance revealed significant difference among genotypes for all traits studied under stress as well as control conditions, indicating presence of considerable amount of genetic variation among the population. The large genetic variability among the population between two different moisture conditions towards different characters indicates the scope for improving the heat tolerance and its attributing traits. The mean, range and LSD 5% of the population for the heat related and yield attributing traits are shown in Table 1. However several transgressive segregants observed for yield related traits under both the conditions, were significantly higher than RP. This suggests the influence of O. meridionalis Ng. alleles under both conditions.
Coefficient of variances
Table 2. Estimation of GCV, PCV, h2 and GA of the IR58025B/ O.
meridionalis Ng. population under stress and control conditions
Stress and Control-2012
TRAITS GCV PCV h2 GA
DFF (Stress) 15.86 18.83 0.77 25.36 DFF (Control) 10.06 11.57 0.85 16.51 FLT (Stress) 2.13 5.08 0.18 1.84 FLT (Control) 6.21 8.02 0.47 8.82 PT (Stress) 1.84 4.31 0.18 1.61 PT (Control) 4.91 8.47 0.34 5.87 CT (Stress) 1.57 4.55 0.12 1.12 CT (Control) 6.75 9.10 0.55 10.30 PHT (Stress) 13.60 16.26 0.66 23.43 PHT (Control) 10.55 14.12 0.86 13.24 TN (Stress) 17.37 23.45 0.46 26.70 TN (Control) 14.79 22.75 0.60 18.15 PN (Stress) 20.42 30.98 0.39 35.63 PN (Control) 14.41 19.39 0.55 18.10 FLL (STRESS) 12.50 17.03 0.38 11.56 FLL (CONTROL) 6.80 11.17 0.54 8.86 FLW (STRESS) 10.41 20.28 0.26 17.41 FLW (CONTROL) 6.80 11.17 0.37 8.86 SLA (STRESS) 17.13 27.05 0.40 20.94 SLA (CONTROL) 12.15 17.78 0.47 12.98 PL (Stress) 8.80 15.25 0.54 15.47 PL (Control) 6.35 9.71 0.62 10.07 SPY (STRESS) 23.06 49.12 0.22 43.37 SPY (CONTROL) 19.75 24.13 0.67 13.87 GN (Stress) 54.96 76.91 0.56 53.76 GN (Control) 21.74 30.76 0.70 29.98 TS (Stress) 16.12 22.26 0.26 13.01 TS (Control) 12.63 19.54 0.48 27.41 SF (Stress) 66.23 91.68 0.54 73.89 SF (Control) 14.89 17.89 0.68 27.20 TW (Stress) 62.46 92.16 0.37 64.42 TW (Control) 9.88 10.88 0.41 5.88 BM (Stress) 21.54 35.24 0.41 27.12 BM (Control) 18.77 22.06 0.72 18.92 LY (Stress) 77.29 93.20 0.57 78.55 LY (Control) 27.58 29.33 0.69 23.44 DFF: days to 50% flowering, FLT: flag leaf temperature (0 C), PT: panicle
temperature (0 C), CT: canopy temperature (0 C), PHT: plant height (cm), TN: tiller number, PN: panicle number, FLL: flag leaf length (cm), FLW: flag leaf width (cm), SLA: specific leaf area, PL: panicle length (cm), SPY: single plant yield (gr), GN: grain number, TS: total spikelet, SF: spikelet fertility (%), TW: 1000 seed weight (g), BM: biomass (g), LY: line yield (t ha-1).
The estimates of phenotypic coefficient of variation (PCV) were higher than those of genotypic coefficient variation for all the traits under control and heat stress conditions. GCV and PCV were higher in stress experiment when compared with control condition. The Genotypic coefficient of variation ranges from 1.57 for CT to 77.29 for line yield per plot, whereas phenotypic coefficient of variation ranged 4.31 for panicle temperature to 91.68 for spikelet fertility. Panicle temperature, flag leaf temperature, flag leaf length, flag leaf width, panicle length and days to 50% flowering showed low genotypic coefficient of variation. The highest genotypic coefficient of variation is for the line yield, spikelet fertility, 1000 grain weight and grain numbers. The lowest phenotypic coefficient of variation is for the panicle temperature, canopy temperature, flag leaf temperature, panicle temperature, flag leaf length, flag leaf width and days to 50% flowering. The highest phenotypic coefficient of variation was for the line yield, grain numbers, single plant yield, 1000 grain weight, spikelet fertility, biomass and panicle numbers. In this study difference indicated influence of environment and consequently greater genetic role of factors on the expression
of traits. All these observations are similar with the earlier reports by Mustafa and Elsheikh 2007 and Kole et al., 2008 in rice. These observations for coefficient of variation for GCV and PCV were similar to that of Akinwale et al., 2011 and Ullah et al., 2011. The GCV ranged from 6.35 (Panicle length) in control to 77.29 (line yield) in stress condition, the PCV ranged from 9.71 (panicle length) to 93.20 (line yield) in stress condition for yield related traits. Further physiological traits like flag leaf temperature, panicle temperature, canopy temperature and leaf area index from that GCV ranged from 1.57 (canopy temperature) in stress to 17.13 (leaf area index) in stress, the PCV ranged from 1.84 (panicle temperature) in stress to 27.05 (leaf area index) in stress condition.
Heritability and genetic advance
Broad sense heritability estimates varied from 0.34 (panicle temperature) to 0.86 (plant height) in control condition, and 0.12 (canopy temperature) to 0.77 (days to 50% flowering) in stress condition (Table-2). In the present study, high heritability is observed for days to 50% flowering (0.77), plant height (0.66). High to moderate heritability is observed for line yield (0.57), grain yield (0.56), panicle length (0.54) and spikelet fertility (0.53) and low heritability is observed for canopy temperature (0.12) in stress condition. Under control condition, heritability is high for plant height (0.86), days to 50% flowering (0.85), high to moderate for tiller number (0.60), panicle number (0.55), canopy temperature (0.55), flag leaf length (0.54) and low for panicle temperature (0.34), flag leaf width (0.37). High heritability reported in rice (Akhtar
et al., 2011, Seyoum et al., 2012, Saikumar et al., 2014)
suggests possibility of selection of superior genotypes on the basis of phenotypic performance. High to moderate heritability is reported for different quantitative traits studied in rice (Abarshahr et al., 2011, Akinwale et al., 2011, Berneir et al.,
2007, Sadeghi et al., 2011, Saikumar et al., 2014, Vikram
et al., 2011) and low heritability (Seyoum et al., 2012,
Saikumar et al., 2014) indicates greater role of environment (heat stress) on the expression of the traits.
Present observations revealed that all the traits were influenced by heat stress environment, which is evident from the lower values of heritability estimates in heat stress when compared to control condition. The study revealed very low estimate of heritability for traits such as Biomass (Saikumar et al., 2014), flag leaf temperature, line yield, canopy temperature and single plant yield were maximum extent by the environment, in comparison with the remaining traits. However, TW showed lower values of heritability in both conditions.
Correlation coefficients
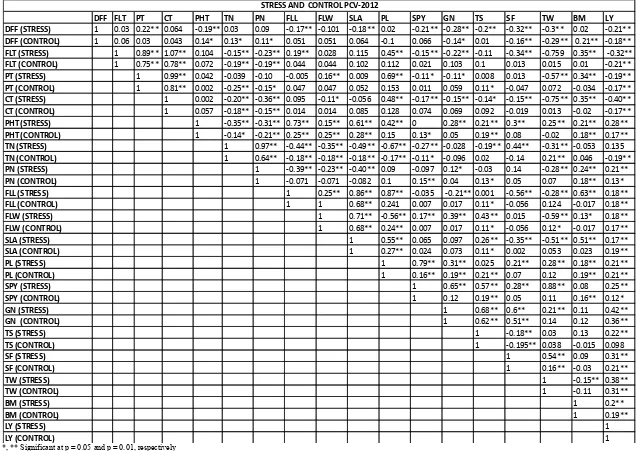
The genetic and phenotypic correlation coefficients among traits showed that the significant higher genotypic correlation (Table-4) coefficient level than corresponding phenotypic correlation coefficient (Table-3) because the relationship is affected by environment at phenotypic level in population, indicating the low phenotypic correlation coefficient (Chaubey and Singh 1994, Ojo et al., 2006).
Table 3. Phenotypic correlation coefficients between yield and its related traits of the IR58025B/ O. meridionalis Ng. population under stress and control conditions
*, ** Significant at p = 0.05 and p = 0.01, respectively
DFF FLT PT CT PHT TN PN FLL FLW SLA PL SPY GN TS SF TW BM LY DFF (STRESS) 1 0.03 0.22** 0.064 -0.19** 0.03 0.09 -0.17** -0.101 -0.18** 0.02 -0.21** -0.28** -0.2** -0.32** -0.3** 0.02 -0.21** DFF (CONTROL) 1 0.06 0.03 0.043 0.14* 0.13* 0.11* 0.051 0.051 0.064 -0.1 0.066 -0.14* 0.01 -0.16** -0.29** 0.21** -0.18** FLT (STRESS) 1 0.89** 1.07** 0.104 -0.15** -0.23** 0.19** 0.028 0.115 0.45** -0.15** -0.22** -0.11 -0.34** -0.759 0.35** -0.32** FLT (CONTROL) 1 0.75** 0.78** 0.072 -0.19** -0.19** 0.044 0.044 0.102 0.112 0.021 0.103 0.1 0.013 0.015 0.01 -0.21** PT (STRESS) 1 0.99** 0.042 -0.039 -0.10 -0.005 0.16** 0.009 0.69** -0.11* -0.11* 0.008 0.013 -0.57** 0.34** -0.19**
PT (CONTROL) 1 0.81** 0.002 -0.25** -0.15* 0.047 0.047 0.052 0.153 0.011 0.059 0.11* -0.047 0.072 -0.034 -0.17**
CT (STRESS) 1 0.002 -0.20** -0.36** 0.095 -0.11* -0.056 0.48** -0.17** -0.15** -0.14* -0.15** -0.75** 0.35** -0.40**
CT (CONTROL) 1 0.057 -0.18** -0.15** 0.014 0.014 0.085 0.128 0.074 0.069 0.092 -0.019 0.013 -0.02 -0.17**
PHT (STRESS) 1 -0.35** -0.31** 0.73** 0.15** 0.61** 0.42** 0 0.28** 0.21** 0.3** 0.25** 0.21** 0.28**
PHT (CONTROL) 1 -0.14* -0.21** 0.25** 0.25** 0.28** 0.15 0.13* 0.05 0.19** 0.08 -0.02 0.18** 0.17**
TN (STRESS) 1 0.97** -0.44** -0.35** -0.49** -0.67** -0.27** -0.028 -0.19** 0.44** -0.31** -0.053 0.135
TN (CONTROL) 1 0.64** -0.18** -0.18** -0.18** -0.17** -0.11* -0.096 0.02 -0.14 0.21** 0.046 -0.19**
PN (STRESS) 1 -0.39** -0.23** -0.40** 0.09 -0.097 0.12* -0.03 0.14 -0.28** 0.24** 0.21**
PN (CONTROL) 1 -0.071 -0.071 -0.082 0.1 0.15** 0.04 0.13* 0.05 0.07 0.18** 0.13*
FLL (STRESS) 1 0.25** 0.86** 0.87** -0.035 -0.21** 0.001 -0.56** -0.28** 0.63** 0.18**
FLL (CONTROL) 1 1 0.68** 0.241 0.007 0.017 0.11* -0.056 0.124 -0.017 0.18**
FLW (STRESS) 1 0.71** -0.56** 0.17** 0.39** 0.43** 0.015 -0.59** 0.13* 0.18**
FLW (CONTROL) 1 0.68** 0.24** 0.007 0.017 0.11* -0.056 0.12* -0.017 0.17**
SLA (STRESS) 1 0.55** 0.065 0.097 0.26** -0.35** -0.51** 0.51** 0.17**
SLA (CONTROL) 1 0.27** 0.024 0.073 0.11* 0.002 0.053 0.023 0.19**
PL (STRESS) 1 0.79** 0.31** 0.025 0.21** 0.28** 0.18** 0.21**
PL (CONTROL) 1 0.16** 0.19** 0.21** 0.07 0.12 0.19** 0.21**
SPY (STRESS) 1 0.65** 0.57** 0.28** 0.88** 0.08 0.25**
SPY (CONTROL) 1 0.12 0.19** 0.05 0.11 0.16** 0.12*
GN (STRESS) 1 0.68** 0.6** 0.21** 0.11 0.42**
GN (CONTROL) 1 0.62** 0.51** 0.14 0.12 0.36**
TS (STRESS) 1 -0.18** 0.03 0.13 0.22**
TS (CONTROL) 1 -0.195** 0.038 -0.015 0.098
SF (STRESS) 1 0.54** 0.09 0.31**
SF (CONTROL) 1 0.16** -0.03 0.21**
TW (STRESS) 1 -0.15** 0.38**
TW (CONTROL) 1 -0.11 0.31**
BM (STRESS) 1 0.2**
BM (CONTROL) 1 0.19**
LY (STRESS) 1
LY (CONTROL) 1
Table 4. Genotypic correlation coefficients between yield and its related traits of the IR58025B/ O. meridionalis Ng. population under stress and control conditions
*, ** Significant at p = 0.05 and p = 0.01, respectively
DFF FLT PT CT PHT TN PN FLL FLW SLA PL SPY GN TS SF TW BM LY
DFF (STRESS) 1 0 0.075 0.29** -0.05 0.127 0.13* -0.095 -0.034 -0.081 -0.14* -0.033 -0.36** -0.023 -0.39** -0.29** 0.01 -0.3**
DFF (CONTROL) 1 0.05 0.031 0.034 0.16** 0.15** -0.11* 0.12* 0.12* 0.12* -0.56** 0.043 -0.61** -0.13* -0.45** -0.56** 0.66** -0.67**
FLT (STRESS) 1 0.79** 0.88** 0.06 0.031 0.017 0.039 -0.069 -0.018 -0.068 -0.11* -0.095 -0.027 -0.072 -0.104 -0.081 -0.142*
FLT (CONTROL) 1 1.05** 0.95** 0.16** -0.064 -0.10* 0.044 0.044 0.23** 0.45** 0.11* 0.17** 0.102 -0.023 0.022 0.015 -0.27**
PT (STRESS) 1 0.83** 0.036 0.071 0.07 0.014 0.01 0.017 -0.056 -0.003 -0.018 -0.033 0.018 -0.11* 0.053 -0.111
PT (CONTROL) 1 1.07** 0.19** -0.006 -0.024 -0.25** -0.25** 0.24** 0.38** 0.12* 0.25** 0.15** -0.23** 0.029 0.048 -0.22**
CT (STRESS) 1 0.002 0.041 0.034 0.008 -0.023 -0.01 -0.062 -0.062 -0.063 -0.032 -0.032 -0.064 -0.045 -0.101
CT (CONTROL) 1 0.14* 0.008 -0.062 0.048 0.048 0.31** 0.38** 0.082 0.099 0.023 -0.065 -0.032 0.071 -0.18**
PHT (STRESS) 1 -0.19** -0.18** 0.55** 0.17** 0.45** 0.81** 0.066 0.38** -0.17** 0.31** 0.28** 0.02 0.29**
PHT (CONTROL) 1 -0.25** -0.51** 0.53** 0.36** 0.75** 0.12* 0.13* -0.04 0.042 -0.12* -0.03 0.38** 0.16**
TN (STRESS) 1 0.84** -0.22** -0.15** -0.23** -0.094 -0.15* -0.089 0.046 -0.053 0.16** 0.035 0.12
TN (CONTROL) 1 0.82** -0.21** -0.21** -0.26** -0.35** -0.096 -0.14* -0.011 0.012 0.24** 0.034 -0.24**
PN (STRESS) 1 -0.19** -0.055 -0.15** -0.21** -0.059 -0.61** 0.082 -0.45** -0.45** 0.41** 0.14*
PN (CONTROL) 1 -0.13* -0.13** -0.12* -0.13* -0.11* -0.26** 0.058 -0.21** 0.14* 0.16** 0.14*
FLL (STRESS) 1 0.23** 0.77** 0.26** 0.051 -0.11* -0.27** 0.027 0.31** 0.004 0.14*
FLL (CONTROL) 1 1 0.81** 0.48** -0.02 0.19** 0.27** -0.13* 0.034 -0.004 0.17**
FLW (STRESS) 1 0.77** 0.22** 0.35** 0.31** 0.066 0.087 0.056 0.21** 0.101
FLW (CONTROL) 1 0.81** 0.48** -0.02 0.19** 0.27** -0.13* 0.034 -0.004 0.17**
SLA (STRESS) 1 0.29** 0.26** 0.13* -0.13* 0.067 0.22** 0.13* 0.15**
SLA (CONTROL) 1 0.54** 0.057 0.19** 0.19** 0.019 0.02 0.003 0.14*
PL (STRESS) 1 0.19* 0.3** -0.095 0.26** 0.28** 0.03 0.11*
PL (CONTROL) 1 0.31** 0.31** 0.27** 0.14* 0.67** -0.36** 0.66**
SPY (STRESS) 1 0.89** 0.12* 0.13* -0.074 0.44** 0.19**
SPY (CONTROL) 1 0.81** -0.11* -0.049 -0.011 0.27** 0.19**
GN (STRESS) 1 0.63** 0.85** 0.76** -0.29** 0.76**
GN (CONTROL) 1 0.45** 0.76** 0.21** -0.24** 0.61**
TS (STRESS) 1 0.13* -0.074 0.44** 0.19**
TS (CONTROL) 1 0.26** -0.18** -0.054 0.15**
SF (STRESS) 1 0.86** -0.31** 0.81**
SF (CONTROL) 1 0.12* 0.2** 0.81**
TW (STRESS) 1 -0.31** 0.67**
TW (CONTROL) 1 -0.07 0.51**
BM (STRESS) 1 0.19**
BM (CONTROL) 1 0.21**
LY (STRESS) 1
LY (CONTROL) 1
STRESS AND CONTROL GCV-2012
Grain yield (GY) is significantly and positively correlated at both phenotypic (p) and genotypic (g) level with PH (P = 0.17 to 0.28, g = 0.16 to 0.29), PN (p = 0.13 to 0.21, g = 0.14), FLL (p = 0.18, g = 0.14 to 0.17), SLA (p = 0.17 to 0.19, g = 0.14 to 0.15), PL (p = 0.21, g = 0.11 to 0.66), SPY (p = 0.12 to 0.25, g = 0.19), GN (p = 0.36 to 0.42, g = 0.61 to 0.76), SF (p = 0.21 to 0.31, g = 0.81), TW (p = 0.31 to 0.38, g = 0.51 to 0.67), BM (p = 0.19 to 0.2, g = 0.19 to o.21), under which conditions whereas GY is significantly positive correlated with TN (p = 0.12, g = 0.14) under stress condition and significant negatively correlated with TN (p = -0.19, g = -0.24) under control condition and FLW (p = 0.17 to 0.18) of phenotypic correlation is significant with GY whereas genotypic correlation in stress conditions in non-significant with GY and TS (g = 0.15 to 0.19). Genotypic coefficient correlation is significant under both conditions whereas phenotypic correlation is non-significant with the GY under control conditions. DFF (p = -0.21 TO -0.18, G = -0.30 TO -0.67), FLT (p = 0.21 to 0.32, g = 0.14 to 0.27), PT (p = 0.17 to -0.19, g = -0.11 to -0.22) is negatively correlated with GY under both conditions. Canopy temperature (p = -0.17 to -0.40) phenotypic correlation is negatively correlated with GY under both conditions except genotypic correlation is non-significant with GY under stress condition.
Negative correlation between GY and DFF has been reported by Garrety and O’Toole et al., 1994, Lanceras et al., 2004, Abarshahr et al., 2011, Varma et al., 2012, Saikumar et al., 2014. The Positive correlation between GY and PH, GN, SF, TW, BM has been also previously reported by Lanceras et al., 2004, Bernier et al., 2007, Laffite et al., 2006, Vikram et al., 2011, Saikumar et al., 2014, for plant height and tiller number Nayak et al., 2001 and Shanthi and Singh 2001, Sawant et al., 1995, for panicle length Yolanda and Yoland and Vijendra Das LD 1995, DeepaSankar et al., 2006, Singh et al., 2006 and Venkata Lakshmi et al., 2014. Canopy temperature was negatively correlated with yield, similar results were reported by Hirayama et al., 2006, Talebi 2011, Saikumar et al., 2014, Grain yield positive correlation with the GN, TN, TW was earlier reported by Mohammed et al., 2007, M. G. Akinwale
et al., 2011.
Grain yield negative correlation with the tiller number under control condition was earlier reported by Zahid et al., 2006. Grain yield was found to be positively significantly correlated with plant height, panicle number per plant and biomass at both genotypic and phenotypic levels indicating the importance of these characters for yield improvement in this
population. The results are in agreement with Nayak
et al., 2001 and Chaudhary and Motiramani 2003 for panicle
number and Kole et al., 2008, and also grain yield positively correlated with biomass and 1000 grain weight. The results are in agreement with the Sokoto et al., 2012. Negative correlation coefficient of days to 50% flowering, flag leaf temperature, panicle temperature, canopy temperature with grain yield indicates the reduce yield due to increase in temperature.
Conclusion
The results from this investigation indicate that O.
meridionalis Ng. has not only yield-enhancing alleles under
normal, well-watered conditions, but also alleles which can
help withstand heat stress under increased temperature under stress condition. Hence, this species can be a novel source of natural genetic variation for the improvement of rice and simultaneously help in expansion of the cultivated gene pool of
Oryza sativa.
Acknowledgements
The authors are thankful to management of Barwale Foundation for all the encouragement and support provided during the project. We also thank Dr. M.S. Ramesha and Dr. S.V.K. Jagadish for providing instruments through BMZ-IRRI project during execution of this work.
REFERENCES
Abarshahr M, Rabiei B, Slahigi H. 2011. Genetic Variability, Correlation and Path Analysis in Rice under Optimum and Stress Irrigation Regimes. Not Sci Biol., 3(4):134-142. Abdus Salam Khan, Muhammad Imran and Muhammad
Ashfaq, 2009. Estimation of Genetic Variability and Correlation for grain yield components in rice (Oryza sativa L.). American-Eurasian J. Agric. & Eniron. Sci., 6(5): 585-590.
Ahmed Mustafa M. and M.A. Yasser Elsheikh. 2007. Variability, correlation and path co-efficient analysis for and its components in rice. Crop Science Journal., Vol. 15,
No. 4, pp. 183 – 189.
Akhtar N, Nazir M F, Rabnawaz A, Mahmood T, Safdar M.E, Asif M and Rehman A. 2011. Estimation of heritability, correlation and path coefficient analysis in fine grain rice.The Journal of Animal & Plant Sciences., 21 (4): 660-664.
Akiniwale A G, Gregorio G, Nwilene F, Akinyele B O, Ogunbayo S A, Odiyo A C. 2011. Heritability and correlation coefficient analysis for yield and its components in rice (Oryza sativa L.). Afr J Plant Sci., 5:207-212. Akinwale M G, Gregorio G, Nwilene1 F, Akinyele B O,
Ogunbayo S A andOdiyi A C. 2011. Heritability and correlation coefficient analysis for yield and its components in rice (Oryza sativa L.).African Journal of Plant Science., Vol. 5 (3), pp. 207-212.
Andrew P S, Paul A H, Brian J, Atwell. 2009. Physiological and molecular changes in Oryzameridionalis Ng. a heat-tolerant species of wild rice. J. Exp. Bot., 61: 191-202. Bernier J, Kumar A, Venuprasad R, Spaner D, Atlin GN. 2007.
A large-effect QTL for grain yield under reproductive-stage drought stress in upland rice. Crop Sci., 47:507-516. Brar D S, Kush G S. 1997. Alien introgression in rice. Plant
Mol. Biol., 35: 35-47.
Chaubey P K and Singh R P. 1994. Genetic variability, correlation and path analysis of filled components in rice.Madras Agri. J., 81: 438-470.
Chaudhary M and Motiramani N K. 2003. Variability and association among yield attributes and grain quality in traditional aromatic rice accessions. Crop Improv., 30: 84-90.
DeepaSankar P, Sheeba A and Anbumalarmathi J. 2006. Variability and character association studies in rice. Agric.
Easterling, D R, Horton B, Jones P D, Peterson T C, Karl T R, Parker D E, Salinger M J, Razuvayev V, Plummer N, Jamason P, Folland C K. 1997. Maximum and Minimum trends for the globe.Science., 277, 364±367.
Fischer R A, Rees D, Sayre K D, Lu, Z M, Condon, A G, Larque Saavedra A. 1998. Wheat yield progress associated with higher stomatal conductance and photosynthetic rate, and cooler canopies. Crop Sci., 38, 1467–1475.
Garrety D P, O’Toole J C. 1994.Screening rice for drought resistance at the reproductive phase.Field Crop Res., 39(2-3):99-100.
Guendouz A. 2012. Canopy Temperature Efficiency as Indicators for Drought Tolerance in Durum Wheat (Triticum Durum Desf.) in Semi Arid Conditions.Journal
of Agriculture and Sustainability., Volume 1 (2012),
Number 1, 23-38.
Hirayama M, Wada Y and Nemoto H. 2006. Estimation of drought tolerance based on leaf temperature in upland rice breeding. Breed. Sci., 56: 47-54.
Jagadish J V K, Cairns J, Lafitte R, wheeler T R, Price A H and Craufurd P Q. 2010. Genetic analysis of heat tolerance at anthesis in rice.Crop Science., 50, 1633-1641.
Jagadish J V K, Craufurd P Q, Wheeler T R. 2008. Phenotyping parents of mapping populations of rice (Oryza sativa L.) for heat tolerance during anthesis. Crop Science., 48, 1140-1146.
Jagadish J V K, Muthurajan R, Oane R, Wheeler T R, Heuer S, Bennett J and Craufurd. 2009. Physiological and proteomic approaches to address heat tolerance during anthesis in rice (Oryza sativa L.). Jour. Expr.Bot., 61, 143-156.
Kole P C, Chakraborty N R and Bhat J S. 2008. Analysis of variability, correlation and path coefficients in induced mutants of aromatic non-basmati rice. Trop. Agric. Res.
Exten., 113:60-64.
Lafitte H R, Li Z K, Vijayakumar C H M, Gao Y M, Shi Y, Xu J L, Fu B Y, Ali A J, Domingo J, Maghirang R, Torres R, Mackill D. 2006. Improvement of rice drought tolerance through backcross breeding: Evaluation of donors and selection in drought nurseries. Field Crops Res, 97:77-86. Lanceras J, Pantuwan G, Jongdee B, Toojinda T. 2004.
Quantitative trait loci associated with drought tolerance at reproductive stage in rice. Plant Physiol., 135: 384-399. Lee D, Ahsan N B, Lee S, Kang K, Bahk J, Lee I, Lee B. 2007.
Proteomic approach in analyzing heat-responsive proteins in rice leaves.Proteomics., 7(18):3369-3383.
Lu B R, and T S Silitonga. 1999. Wild rice
Oryzameridionaliswas first found in Indonesia (notes from
field). International Rice Research Notes., 24: 28.
Lu C, Shen L, Tan Z, Xu Y, He P, Chen Y, Zhu L. 1997. Comparative mapping of QTLs for agronomic traits of rice
across environments by using a doubled-haploid
population.Theoretical Applied Genetics., 94: 145–150.
Mackill D, W Coffman and J Rutger. 1982. Pollen shedding and combining ability for high temperature tolerance in rice. Crop Sci., 22, 730-733.
Matsui T and Omasa K. 2002. Rice cultivars tolerant to high temperature at flowering: Anther characteristics. Ann. Bot., 89, 683-687.
Matsui T, Namuco O, Ziska L and Horie T. 1997b.Effect of high temperature and CO2 concentration on spikelet sterility in Indica rice.Field Crops Res., 51, 213-219.
Matsui T, Omasa K and Horie T. 1997a. High temperature induced spikelet sterility of japonica rice at flowering in relation to air humidity and wind velocity conditions. Jpn.
J. Crop Sci., 66, 449-455.
Matsui T, Omasa K and Horie T. 2001. The differences in sterility due to high temperature during the flowering period among japonica rice varieties. Plant Prod. Sci., 4, 90-93.
Matsushima S, Ikewada H, Maeda A, Honda S and Niki H. 1982.Studies on rice cultivation in the tropic. I yielding and ripening responses of the rice plant to the extremely hot and dry climate in Sudan. Jpn. J. Trop. Agric., 26, 19-25. Meehl G, Washington W, Collins W, Arblaster J, Hu A, Buja
L, Strand W and Teng H. 2005. How much more global warming and sea level rise? Science., 307, 1769-1722. Muhammed B, Asif A K, Anjuman A, Yusuf Z, Muhammad
A. 2007. Path analysis of some leaf and panicle traits affecting grain yield in doubled haploid lines of rice (Oryza sativa l.). J. Agric. Res., 45(4): 248-252.
Nayak A R, Chaudhury D and Reddy J N. 2001.Correlation and path analysis in scented rice (Oryza sativa L.).Indian J.
Agric. Res., 35: 186-189.
Ojo D K, Omikunle O A, Ajala M O and Ogunbayo S A. 2006. Heritability, character correlation and path coefficient analysis among six-linked of maize. World J. Agri. Sci.,2: 352-358.
Osada A, Saciplapa V, Rahong M, Dhammanuvong S and Chakrabandho H. 1973. Abnormal occurrence of empty grains of indica rice plants in dry, hot season in Thailand,
Proc. Crop. Sci. Jpn., 42:103-109.
Peng S, Huang J, Sheehy J E, Laza R C, Visperas R M, Grace X Z, Centeno S, Khush G S, Cassman K G. 2004. Rice yields decline with higher night temperature from global warming. PNAS., 27: 9971-9975.
Prasad P, Boote K, Allen L, Sheehy J and Thomas J. 2006. Species, ecotype and cultivar differences in spikelet fertility and harvest index of rice in response to high temperature stress. Field Crops Res., 95, 398-411.
Root T, Price J, Hall K, Schneider S, Rosenzweig C and Pounds J. 2003. Fingerprints of global warming on wild animals and plants.Nature., 421, 57-60.
Sadeghi T. 2011. Heritability, phenotypic correlation and path coefficient studies for some agronomic characters in landrace varieties. World Applied Sci J., 13:1229-1233. Saikumar S, Saiharini A, Ayyappa D, Padmavathi G, Vinay
Shenoy V. 2014. Heritability, Correlation and Path Analysis among yield and yield attributing traits for drought tolerance in an interspecific cross derived from Oryza sativa x O. glaberrima introgression line under contrasting moisture regimes. Not. Sci.Biol., 6(3):338-348. Satake T and Yoshida S. 1978. High temperature induced
sterility in Indica rice at flowering. Jpn.J.Crop Sci.,47,6-17. Sato K, Inaba K and Tosawa M. 1973.High temperature injury of ripening in rice plant. I The effects of high temperature treatment at different stages of panicle development on the ripening. Proc. Crop Sci. Soc. Jpn., 42, 207-213.
Sawant D S, Patil S L, Sadhar B B and Bhare S G. 1995.Genetic divergence, character association and path analysis in rice.J. Maharashtraagric. Univ., 20: 412-414.
Scafaro A P, Haynes P A, Atwell B J. 2010. Physiological and molecular changes in Oryzameridionalis Ng. a heat-tolerant species of wild rice. J Exp Bot., 61(1):191-202.
Second, G. 1988. Field notes and observations on, a collection of wild rice species in Australia., 3-31 May 1987.
Seyoum M, Alamerew S, Bantte K. 2012. Genetic variability, heritability, correlation coefficient and path analysis for yield and yield related traits in rice (Oryza sativa L.). J
Plant Sci., 1-10.
Shanthi P and Singh J. 2001. Genetic divergence for yield and its components in induced mutants of Mahsuri rice (Oryza
sativa L.). Res. Crops., 2: 390-392.
Singh P K, Mishra M N, Hore D K and Verma M R. 2006.Genetic divergence in lowland rice of north eastern region of India.Communications inBiometry and Crop
Science., 1 (1): 35-40.
Sokoto M B, Abubakar I U andDikko A U. 2012. Correlation analysis of some growth, yield, yield components and grin quality of wheat (Triticumaestivum L.).Nigerian Journal of
Basic and Applied Science., 20(4): 349-356.
Somanthri I H. 2001. Wild rice (Oryzaspp.): their existence and research in Indonesia. Bull. Agro Bio., 5, 14-20Tan et
al., 2008.
Tanksley S D, McCouch S R. 1997. Seed banks and molecular maps: Unlocking genetic potential from the wild. Science., 277:1063-1066
Tanksley S D, Nelson J C. 1996. Advanced backcross QTL analysis: A method for the simultaneous discovery and transfer of valuable QTLs from unadaptedgermplasm into elite breeding lines. Theor. Appl. Genet., 92: 191-203 Ullah, M Z, Bashar M K, Bhuiyan M S R, Khalequzzman M
and Hasan M J. 2011. Interrelationship and cause-effect analysis among morpho-physiological traits in biroin rice of Bangladesh. Int. J. Plant Breed. Gene.t, 5:246-254. Varma C M K, Kalmeshwer G P, Saikumar S, Shenoy V,
Shashidhar H E, Sarla N. 2012. Transgressive Segregation
for Yield Traits in Oryza sativa IR58025B X
OryzameridionalisNg. BC2F3 Population under Irrigated
and Aerobic Conditions.J Crop Sci Biotech., 15(3):231-238.
Venkata Lakshmi M, Suneetha Y, Yuandhar G, Venkata Lakshmi N. 2014. Correlation studies in rice (Oryza sativa L). International research publication house.,Volume(5), Number 2, 121-126
Vikram P, Swamy B P M, Dixit S, Sta Cruz T, Ahmed H U, Singh A K, Kumar A. 2011. qDTY1.1, a major QTL for rice grain yield under reproductive-stage drought stress with a consistent effect in multiple elite genetic backgrounds.BMC Genet., 12:89.
Vuuren D, Meinshausen M, Plattner G, Joos F, Strassmann K, Smith S, Wigly M, Raper S, Riahi K, Chesnaye F, Elzen M, Fujino J, Jiang K, Nakicenovic N, Paltsev S and Reilly J. 2008. Temperature increase of 21st century mitigation scenarios.Proc. Natl Acad. Sci. USA., 105, 1528-15262. Wang Z Y, Second G, Tanksley S D. 1992. Polymorphism and
phylogenetic relationships among species in the genus
Oryzaas determined by analysis of nuclear RFLPs. Theoretical Applied Genetics., 83: 565-581.
Yolanda J L and Vijendra Das L D. 1995.Correlation and path analysis in rice (Oryzasativa ). Madras Agric. J., 82: 576-578.
Zahid MA, Akhtar M, Sabir M, Manzoor Z and Awan T. 2006. Correlation and path analysis studies of yield and economic traits in Basmati rice (Oryza sativa L.). Asian J, Sci., 5(4): 643-645.
Zhong L, Cheg F, Wen X, Sun X and Zhang G. 2005.The deterioration of eating and cooking quality caused by high temperature during grain filling in early-season indica rice cultivars.J. Agron. Crop Sci., 191, 218-225.
Zhu Q, Ge S. 2005. Phylogenetic relationships among A-genome species of the genus Oryzarevealed by intron sequences of four nuclear genes. New Phytol., 167: 249-265