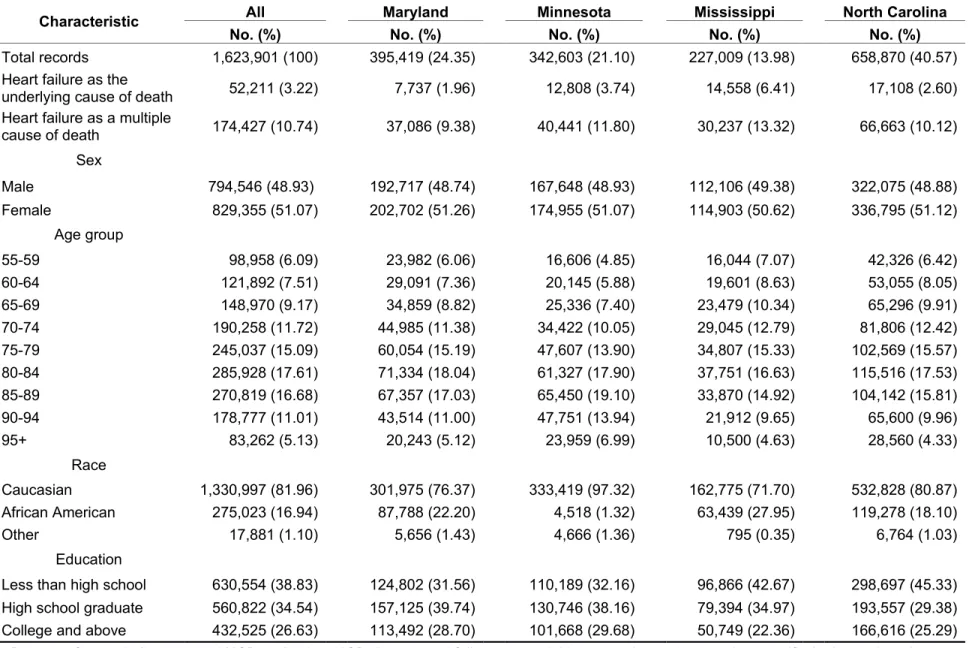
Table S1. Characteristics of decedents from 1999 to 2010
aCharacteristic All Maryland Minnesota Mississippi North Carolina
No. (%) No. (%) No. (%) No. (%) No. (%)
Total records 1,623,901 (100) 395,419 (24.35) 342,603 (21.10) 227,009 (13.98) 658,870 (40.57) Heart failure as the
underlying cause of death 52,211 (3.22) 7,737 (1.96) 12,808 (3.74) 14,558 (6.41) 17,108 (2.60) Heart failure as a multiple
cause of death 174,427 (10.74) 37,086 (9.38) 40,441 (11.80) 30,237 (13.32) 66,663 (10.12)
Sex
Male 794,546 (48.93) 192,717 (48.74) 167,648 (48.93) 112,106 (49.38) 322,075 (48.88)
Female 829,355 (51.07) 202,702 (51.26) 174,955 (51.07) 114,903 (50.62) 336,795 (51.12)
Age group
55-59 98,958 (6.09) 23,982 (6.06) 16,606 (4.85) 16,044 (7.07) 42,326 (6.42)
60-64 121,892 (7.51) 29,091 (7.36) 20,145 (5.88) 19,601 (8.63) 53,055 (8.05)
65-69 148,970 (9.17) 34,859 (8.82) 25,336 (7.40) 23,479 (10.34) 65,296 (9.91)
70-74 190,258 (11.72) 44,985 (11.38) 34,422 (10.05) 29,045 (12.79) 81,806 (12.42)
75-79 245,037 (15.09) 60,054 (15.19) 47,607 (13.90) 34,807 (15.33) 102,569 (15.57)
80-84 285,928 (17.61) 71,334 (18.04) 61,327 (17.90) 37,751 (16.63) 115,516 (17.53)
85-89 270,819 (16.68) 67,357 (17.03) 65,450 (19.10) 33,870 (14.92) 104,142 (15.81)
90-94 178,777 (11.01) 43,514 (11.00) 47,751 (13.94) 21,912 (9.65) 65,600 (9.96)
95+ 83,262 (5.13) 20,243 (5.12) 23,959 (6.99) 10,500 (4.63) 28,560 (4.33)
Race
Caucasian 1,330,997 (81.96) 301,975 (76.37) 333,419 (97.32) 162,775 (71.70) 532,828 (80.87) African American 275,023 (16.94) 87,788 (22.20) 4,518 (1.32) 63,439 (27.95) 119,278 (18.10)
Other 17,881 (1.10) 5,656 (1.43) 4,666 (1.36) 795 (0.35) 6,764 (1.03)
Education
Less than high school 630,554 (38.83) 124,802 (31.56) 110,189 (32.16) 96,866 (42.67) 298,697 (45.33) High school graduate 560,822 (34.54) 157,125 (39.74) 130,746 (38.16) 79,394 (34.97) 193,557 (29.38) College and above 432,525 (26.63) 113,492 (28.70) 101,668 (29.68) 50,749 (22.36) 166,616 (25.29)
a
Dataset after excluding external UCD and select UCD due to renal failure, essential hypertension and general unspecified atherosclerosis
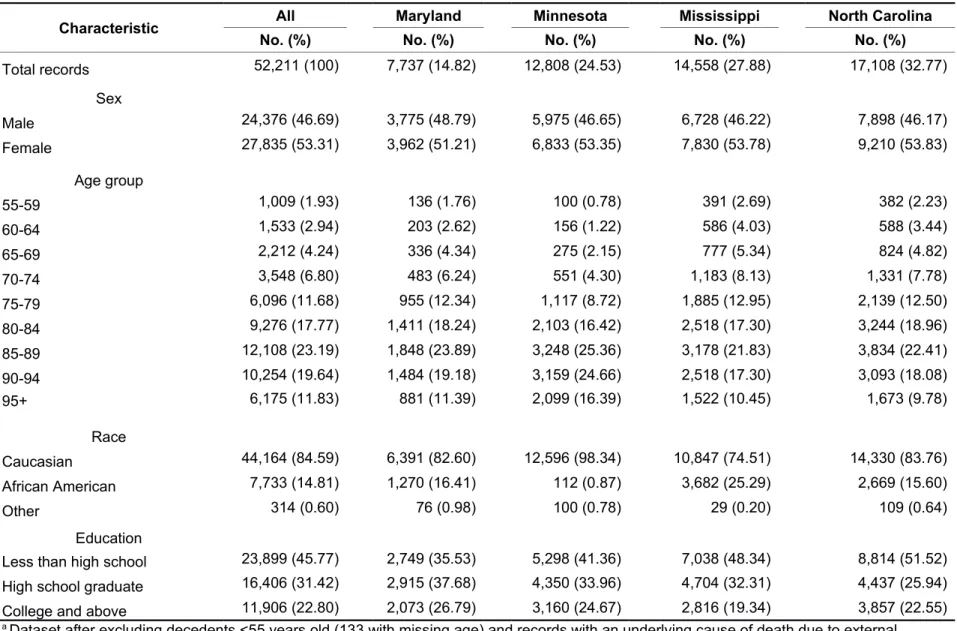
Table S2. Characteristics of decedents with heart failure listed as the underlying cause of death from 1999 to 2010
aCharacteristic All Maryland Minnesota Mississippi North Carolina
No. (%) No. (%) No. (%) No. (%) No. (%)
Total records 52,211 (100) 7,737 (14.82) 12,808 (24.53) 14,558 (27.88) 17,108 (32.77)
Sex
Male 24,376 (46.69) 3,775 (48.79) 5,975 (46.65) 6,728 (46.22) 7,898 (46.17)
Female 27,835 (53.31) 3,962 (51.21) 6,833 (53.35) 7,830 (53.78) 9,210 (53.83)
Age group
55-59 1,009 (1.93) 136 (1.76) 100 (0.78) 391 (2.69) 382 (2.23)
60-64 1,533 (2.94) 203 (2.62) 156 (1.22) 586 (4.03) 588 (3.44)
65-69 2,212 (4.24) 336 (4.34) 275 (2.15) 777 (5.34) 824 (4.82)
70-74 3,548 (6.80) 483 (6.24) 551 (4.30) 1,183 (8.13) 1,331 (7.78)
75-79 6,096 (11.68) 955 (12.34) 1,117 (8.72) 1,885 (12.95) 2,139 (12.50)
80-84 9,276 (17.77) 1,411 (18.24) 2,103 (16.42) 2,518 (17.30) 3,244 (18.96)
85-89 12,108 (23.19) 1,848 (23.89) 3,248 (25.36) 3,178 (21.83) 3,834 (22.41)
90-94 10,254 (19.64) 1,484 (19.18) 3,159 (24.66) 2,518 (17.30) 3,093 (18.08)
95+ 6,175 (11.83) 881 (11.39) 2,099 (16.39) 1,522 (10.45) 1,673 (9.78)
Race
Caucasian 44,164 (84.59) 6,391 (82.60) 12,596 (98.34) 10,847 (74.51) 14,330 (83.76)
African American 7,733 (14.81) 1,270 (16.41) 112 (0.87) 3,682 (25.29) 2,669 (15.60)
Other 314 (0.60) 76 (0.98) 100 (0.78) 29 (0.20) 109 (0.64)
Education
Less than high school 23,899 (45.77) 2,749 (35.53) 5,298 (41.36) 7,038 (48.34) 8,814 (51.52) High school graduate 16,406 (31.42) 2,915 (37.68) 4,350 (33.96) 4,704 (32.31) 4,437 (25.94)
College and above 11,906 (22.80) 2,073 (26.79) 3,160 (24.67) 2,816 (19.34) 3,857 (22.55)
a
Dataset after excluding decedents <55 years old (133 with missing age) and records with an underlying cause of death due to external
causes (ICD-10 V00-Y89) and ill-defined causes of death (ICD-10 R00-R99, N17-N19, C76, C80, C97, I10, I46, I472, I490, I514, I515, I516,
I519, I709).
1999 2000 2001 2002 2003 2004 2005 2006 2007 2008 2009 2010 0
100 200 300 400 500 600 700 800 900 1000
MD Pre MD Post MN Pre MN Post MS Pre MS Post NC Pre NC Post
Year
R at e pe r 10 0, 00 0 po pu la tio n
Figure S1. Age-adjusted mortality rate of coronary heart disease by state pre- and post-redistribution of heart failure deaths. Rates
are among U.S adults ≥55 years old age-standardized to the 2000 U.S. standard population. MD, Maryland; MN, Minnesota; MS,
Mississippi; NC, North Carolina.
Rate per 100,000 population Rate per 100,000 population
a. Male b. Female
Year Year
Figure S2. Age-adjusted mortality rate of coronary heart disease pre and post-redistribution of heart failure deaths by sex and state.
Rates are per 100,000 population among US adults ≥55 years old age-adjusted and standardized to the 2000 US standard
population. MD, Maryland; MN, Minnesota; MS, Mississippi; NC, North Carolina.
a. Caucasian b. African American
Rate per 100,000 population Rate per 100,000 population
Figure S3. Age-adjusted mortality rate of coronary heart disease pre and post-redistribution of heart failure deaths by race and state.
Rates are per 100,000 population among US adults ≥55 years old age-adjusted and standardized to the 2000 US standard
population. Data for African Americans in Minnesota were suppressed because numbers for were too small for a meaningful
analysis. MD, Maryland; MN, Minnesota; MS, Mississippi; NC, North Carolina.
Table S3. ARIC community coronary heart disease surveillance decedent characteristics of records listing heart failure as the underlying cause of death
aCharacteristic Weighted N (%)
Sex
Male 348 (52.8)
Female 312 (47.2)
Race
White 417 (63.3)
Black/African American 236 (35.9)
Asian 4 (0.7)
American Indian/Native Alaskan 1 (0.2) Center
Forsyth County, NC 227 (34.5)
Jackson, MS 262 (39.7)
Minneapolis, MN 104 (15.7)
Washington County, MD 67 (10.2)
Place of Death
In-Hospital 235 (35.6)
Out of Hospital 425 (64.4)
Year of Death
1999 35 (5.3)
2000 37 (5.7)
2001 29 (4.4)
2002 42 (6.4)
2003 33 (5.0)
2004 29 (4.4)
2005 108 (16.5)
2006 82 (12.4)
2007 87 (13.1)
2008 75 (11.4)
2009 48 (7.3)
2010 53 (8.1)
a
Decedents age >=55, years 1999-2010; Weighted N=660; Note: the
numbers were rounded down
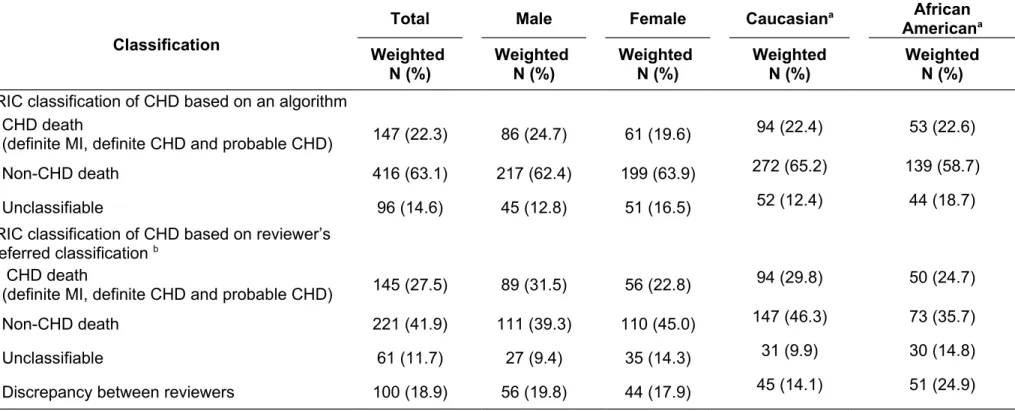
Table S4. ARIC community surveillance coronary heart disease classification of records listing heart failure as the underlying cause of death, decedents age >=55, years 1999-2010, weighted N=660
Classification
Total Male Female Caucasian
aAfrican
American
aWeighted
N (%)
Weighted N (%)
Weighted N (%)
Weighted N (%)
Weighted N (%) ARIC classification of CHD based on an algorithm
CHD death
(definite MI, definite CHD and probable CHD) 147 (22.3) 86 (24.7) 61 (19.6) 94 (22.4) 53 (22.6)
Non-CHD death 416 (63.1) 217 (62.4) 199 (63.9) 272 (65.2) 139 (58.7)
Unclassifiable 96 (14.6) 45 (12.8) 51 (16.5) 52 (12.4) 44 (18.7)
ARIC classification of CHD based on reviewer’s preferred classification
bCHD death
(definite MI, definite CHD and probable CHD) 145 (27.5) 89 (31.5) 56 (22.8) 94 (29.8) 50 (24.7)
Non-CHD death 221 (41.9) 111 (39.3) 110 (45.0) 147 (46.3) 73 (35.7)
Unclassifiable 61 (11.7) 27 (9.4) 35 (14.3) 31 (9.9) 30 (14.8)
Discrepancy between reviewers 100 (18.9) 56 (19.8) 44 (17.9) 45 (14.1) 51 (24.9)
Abbreviations: CHD, coronary heart disease; MI, myocardial infarction
a
excluding other race
b
86 records did not get reviewed and were not included in the weighted N
Note: the numbers were rounded down
Table S5. ARIC community surveillance coronary heart disease classification of records listing heart failure as the underlying cause of death by field center, decedents age >=55, years 1999-2010, weighted N=660
Classification
Forsyth County,
NC Jackson, MS Minneapolis,
MN
Washington County, MD Weighted
N (%)
Weighted N (%)
Weighted N (%)
Weighted N (%) ARIC classification of CHD based on
an algorithm
CHD death (definite MI, definite CHD
and probable CHD)
51 (22.5) 74 (28.1) 16 (15.2) 6 (9.6)
Non-CHD death 152 (67.0) 133 (50.8) 78 (74.9) 54 (80.1)
Unclassifiable 24 (10.5) 55 (21.0) 10 (9.9) 7 (10.3)
ARIC classification of CHD based on reviewer’s preferred classification
aCHD death (definite MI, definite CHD
and probable CHD)
48 (29.6) 75 (31.3) 13 (17.4) 9 (17.3)
Non-CHD death 74 (46.1) 83 (34.4) 36 (49.1) 28 (53.8)
Unclassifiable 15 (9.1) 35 (14.4) 9 (12.0) 3 (6.6)
Discrepancy between reviewers 25 (15.2) 48 (19.9) 16 (21.6) 12 (22.3)
Abbreviations: CHD, coronary heart disease; MI, myocardial infarction
a