TRENDS IN THE ALLOCATION OF U.S. PREVENTIVE SERVICES TASK FORCE RECOMMENDATION GRADES AND THE DIRECTIONALITY OF TOPIC UPDATES
OVER TIME
Garrett Thompson
A Master’s Paper submitted to the faculty of the University of North Carolina at Chapel Hill in partial fulfillment of the requirements for the degree of Master of Public Health in the Public
Health Leadership Program
Chapel Hill 2017
Approved by:
Date
Date
ii
© 2017 Garrett Thompson ALL RIGHTS RESERVED
iii ABSTRACT
Garrett Thompson: Trends in the Allocation of U.S. Preventive Services Task Force Recommendation Grades and the Directionality of Topic Updates over Time
(Under the direction of Russell Harris)
Background: The U.S. Preventive Services Task Force has provided evidence-based recommendations to primary care clinicians on the use of preventive services for almost 30 years. In the past, the Task Force has been criticized for being too conservative in issuing recommendations in favor of the use of preventive services. Several recent criticisms, however, have focused on recommendations considered too liberal in the promotion of services.
Objective: To identify trends in the overall allocation of recommendation grades and in the frequency of positive changes (i.e. the issuance of more favorable recommendations) and negative changes (i.e. the issuance of less favorable recommendations) made to
recommendations when updating topics.
Methods: All recommendations issued by the Task Force from January 1996 to June 2017 were collected. Point-based and categorization-based methods were used to evaluate the directionality of change for recommendations issued on updated topics.
Results: The proportion of negative recommendations issued over the past several years has substantially decreased (to 10.1% of recommendations issued from 2013 to 2017 compared to 22.4% from 2006 to 2012 and 23.8% from 2001 to 2005), while the proportion of “I” statements has increased (to 46.1% from 2013 to 2017 compared to 33.7% from 2006 to 2012 and 36.6%
from 2001 to 2005). The proportion of recommendations assigned positive letter grades has slightly increased over time (to 38.2% of recommendations issued from 2013 to 2017 compared to 36.7% from 2006 to 2012 and 33.7% from 2001 to 2005). Furthermore, negative changes (resulting in the decreased promotion and/or increased discouragement of preventive services)
iv
made to recommendations issued on updated topics have become less common over time (as assessed by two different methods). Conversely, positive changes (resulting in the increased promotion and/or decreased discouragement of preventive services) have become more common over the past several years. Finally, the Task Force has increasingly chosen not to update
negative recommendations for previously evaluated interventions or populations (6 out of 8 of these dropped negative recommendations have occurred since 2013).
Conclusions: Several potential factors may have contributed to the longitudinal changes in the issuance of Task Force recommendations observed in this study. These factors include changes in evidence for evaluated services, changes in the methodology for assigning recommendations, political pressures, the link between coverage policy and recommendations, and changes in the thresholds used to delineate recommendation grades. Further research is needed to assess the extent to which each of these factors has influenced the overall issuance of recommendations.
v
TABLE OF CONTENTS
ABSTRACT ... iii
INTRODUCTION ... 1
METHODS ... 9
RESULTS ... 20
DISCUSSION ... 32
CONCLUSIONS ... 43
APPENDIX A: Additional methodological considerations and illustrative examples of the assignment of letter scores and intensity scores ... 44
APPENDIX B: Supplementary results ... 80
REFERENCES ... 92
1
INTRODUCTION
The U.S. Preventive Services Task Force (USPSTF) is an independent panel of experts in primary care and prevention that develops recommendations for clinical preventive services based on systematic reviews of evidence related to their effectiveness. First convened in 1984, the Task Force has provided guidance to clinicians on the use of preventive services for nearly 30 years since it published the first edition Guide to Clinical Preventive Services in 1989 (hereafter referred to as the Guide).1 Today, the mission of the Task Force remains unchanged:
“to improve the health of all Americans by making evidence-based recommendations about clinical preventive services and health promotion.”2 Its recommendations cover a wide range of preventive services offered in the primary care setting or referable by a primary care clinician such as screenings, counseling services, and preventive medications. Evidence reviews form the scientific basis for assessing the certainty and magnitude of benefits and harms associated with the routine provision of a preventive service in a particular population. Depending on the certainty of evidence regarding this balance for a service, the Task Force may issue a recommendation for or against its use. In other instances, the Task Force may deem that the existing evidence base is not sufficient to make a recommendation.
The Task Force, thus, has a tripartite set of responsibilities in providing guidance to primary care clinicians about which preventive services to routinely offer their patients. First, it has the responsibility of making recommendations in favor of routinely offering services likely to yield net health benefit. Secondly, it has the responsibility of making recommendations against the routine provision of services from which patients are unlikely to benefit or may even be harmed. Finally, when the cumulative evidence related to a preventive service is insufficient to evaluate its balance of harm and benefits with certainty, the Task Force has the responsibility
2
of stating as such. In these cases, a summary of what is known about the service is important for informing clinical practice and for guiding future research efforts.
The current system of assigning grades to specific recommendations addresses these responsibilities. For each recommendation, the Task Force evaluates both the certainty and strength of evidence for or against the intervention.3,4 To evaluate the magnitude of net benefit, the Task Force considers both the magnitude of benefit and the magnitude of harm that would result from implementing the preventive service in a primary care population or subpopulation.
While metrics such as the “number needed to treat” or “number needed to harm” may be considered in this estimation, the Task Force does not use specific criteria to differentiate between levels of net benefit.4 Specific criteria, however, are used to evaluate the certainty that the assessment of the magnitude of net benefit is correct.
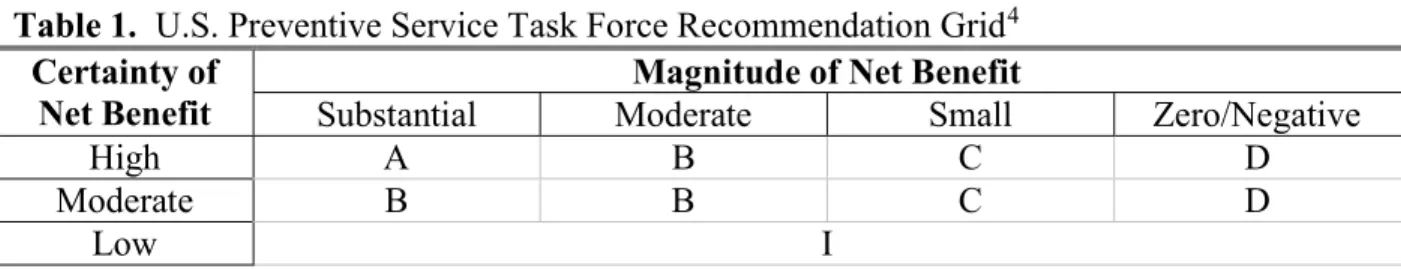
A recommendation grid guides the selection of the appropriate grade for a given recommendation based on both the certainty and magnitude of net benefit (Table 1).
Standardized language accompanies each grade.5 For both “A” and “B” recommendations, the Task Force recommends that clinicians offer or provide the service. For “C” recommendations, the Task Force recommends that clinicians offer or provide the service to selected patients based on professional judgment and patient preferences. For “D” recommendations, the Task Force discourages the use of the service. Finally, for services where the certainty of the magnitude of net benefit is low, the Task Force issues an “I” statement and recommends that if the service is offered, patients be informed about the uncertainty regarding its balance of benefits and harms.
3
Table 1. U.S. Preventive Service Task Force Recommendation Grid4 Certainty of
Net Benefit
Magnitude of Net Benefit
Substantial Moderate Small Zero/Negative
High A B C D
Moderate B B C D
Low I
Historically, the Task Force has been criticized for a perception that its evidence threshold is too high for issuing recommendations in favor of the routine use of services.6 Recently, however, the Task Force has faced a different criticism for not being strict enough in issuing positive recommendations. One critic has argued that several recommendations issued over the past few years have been “far more liberal in promoting interventions.”7
In late 2016, for instance, the Task Force updated its recommendations for depression screening in adults, adolescents, and children.8,9 Previously, the Task Force had issued “B”
recommendations for routinely screening adults and adolescents (ages 12 to 18) for depression when support systems are in place to ensure accurate diagnosis, effective treatment, and follow- up.10,11 Despite concern from critics who argued that these recommendations should be
reconsidered, in part, because no randomized controlled trials have directly demonstrated that depression screening benefits primary care patients12, the USPSTF reaffirmed them.
Furthermore, the Task Force expanded its recommendations in favor of depression screening in adults to include pregnant and post-partum women and omitted its “C” recommendations for the selective screening of patients when depression care supports are not in place. These updated recommendations have received similar criticisms, including charges that the Task Force did not adequately consider the harms associated with screening and that it relied too heavily on indirect evidence to evaluate the benefits of screening.13
Similarly, other USPSTF recommendations issued within the past few years have been
4
criticized for expanding the endorsement of preventive services on the basis of evidence deemed inadequate to estimate the magnitude of benefit with sufficient certainty. In 2013, for instance, the “B” recommendation for low-dose CT screening in high-risk current and former smokers generated significant dissent.14 This recommendation represented a new endorsement of this service in comparison to the “I” statement the Task Force had previously issued for all
asymptomatic patients.14 Among the criticisms lodged against the recommendation included an assertion that its reliance on a single study and simulation models introduced significant
uncertainty in the overall estimate of the magnitude net benefit.15 Furthermore, critics argued that because of the significant harms associated with low-dose CT screening, even small differences in screening conditions outside a trial setting could alter the fine balance between harms and benefits in an unfavorable direction.15
The 2016 recommendation statement on statins for the prevention of cardiovascular disease in adults has also faced criticism.16 These updated recommendations included a “B”
recommendation for the initiation of statins in a set of high-risk adults, expanding upon the prior recommendations in favor of screening for lipid disorders in adults at increased risk of coronary heart disease.17 Detractors of the updated recommendations argue that the lack of access to primary data from statin clinical trials may have led to an overestimation of the benefits of statin use.18 Furthermore, they argue that the evidence regarding the harms from statins is incomplete, particularly because many of the trials included in the USPSTF evidence review did not report on common statin side effects such as muscle pains and weakness.18 They additionally contend that potential harms associated with statin use in healthy persons, such as those related to the increased caloric and fat intake among statin users over time19, did not receive sufficient consideration.
5
While substantial attention has been drawn to updated recommendations made in favor of the routine provision of preventive services, growing concern has also been directed toward the overuse of services associated with net harm. Based on a call for U.S. medical specialty societies to identify the top overused tests and treatments with little meaningful benefit or potential net harm20, the Choosing Wisely campaign had been at the forefront of an international discussion about the overuse of medical services.21 Since 2012, over 70 medical specialty societies have created lists of the top medical services in their specialty for which there is strong evidence of overuse and significant potential for harm.22
Despite the widespread publicity the Choosing Wisely campaign has brought to the concept of medical overuse, the recommendations included on these lists are not necessarily based on rigorous evidence assessments. One study, for instance, concluded that a majority of primary care–relevant Choosing Wisely recommendations are based on expert consensus or disease-oriented evidence.23 Admittedly, the Choosing Wisely campaign notes that these recommendations are intended “to spur conversation about what is appropriate and necessary treatment” and should not be used to establish coverage decisions.24 Thus, there is a need for the development of evidence-based recommendations against the use medical services shown to have no benefit or cause significant harm. For preventive services, the USPSTF addresses this need by assigning a “D” grade to services evaluated, with at least moderate certainty, to have zero or negative net benefit.5
In 2012, the USPSTF issued perhaps its most publicized “D” recommendation when it expanded its recommendation against the use of PSA-based screening for prostate cancer to include men of all ages.25 An editorial published alongside the USPSTF recommendation statement vehemently critiqued the recommendation arguing that the Task Force had
6
underestimated the benefits and overestimated the harms of prostate cancer screening.26 The debate surrounding the recommendation even entered the political realm when former Senator Jeff Sessions (R-AL) introduced S.Res. 251 to the Senate in 2013.27 The resolution contended that the USPSTF “should reevaluate its recommendation against PSA-based screening for prostate cancer men in all age groups … and seriously engage with specialists, including urologists and oncologists, as it reevaluates its recommendation.”27 Although the resolution did not make it out of committee, its introduction to the Senate highlights the considerable
controversy this recommendation generated among both the medical community and the general public.
The recently issued draft recommendation statement for prostate cancer screening
rescinds the “D” recommendation against PSA-based screening in men ages 55 to 69 years old.28 Instead, the Task Force has proposed a “C” recommendation advocating that clinicians inform these men about the benefits and harms of screening, including a small potential mortality benefit and potential harms such as false-positive results, overdiagnosis and overtreatment, and treatment complications. This change, coupled with several other recent recommendation changes, including those discussed above, adds credence to the supposition that Task Force recommendations over the past several years have tended to move in a direction toward promoting the increased use of preventive services and away from discouraging the use of services.
This potential trend, however, has not been formally assessed. In this report, I aim to evaluate the hypothesis that USPSTF recommendations have trended toward promoting the increased use of preventive services and away from discouraging the use of preventive services, particularly over the past several years. Two primary questions are addressed. First, how has the
7
overall allocation of recommendation grades changed over time? Second, have updated recommendations for previously evaluated topics trended in a particular direction? More specifically, how frequently has the directionality of change been in a positive direction, either recommending in favor of the use of more preventive services or recommending against the use of fewer services? Correspondingly, how frequently has the directionality of change been in a negative direction, either recommending in favor of the use of fewer preventive services or recommending against the use of more services?
Table 2. Definitions for key terms used throughout paper
Term Definition
Topic
An evaluated preventive service or set of preventive services evaluated together, usually for a single condition or disease. Evaluated preventive services may include screening tests, counseling services, preventive
medications, or a combination of services.
Recommendation statement
Structured statement covering a preventive services topic and including one or more individual recommendations with associated letter grades. In
addition to recommendations, recommendation statements include the rationale for each recommendation, guidance for clinicians who want to
use the recommendations, and a discussion of the evidence.
Individual Recommendation
Single recommendation regarding the use of a preventive service in a specific population with an associated letter grade.
Letter grade
Grade assigned to each individual recommendation. Indicates the strength of the recommendation for or against the routine use of the preventive service. Each letter grade (A, B, C, D, I) has a standard definition and
suggestions for practice (see Table 3).
Updated topic /
topic update Updated set of recommendations for a previously evaluated topic (or topics if the services were previously evaluated separately).
New topic Preventive service or set of preventive services evaluated by the Task Force for the first time.
Inactive topic Topic the Task Force has chosen not to update. Topics may be inactivated if they are no longer relevant to clinical practice, as a result of changes in
technology, or for other reasons.
Referred topic
Topic previously evaluated by the Task Force, but since referred to another organization. The Task Force, for instance, now refers to the Advisory
Committee on Immunization Practices for recommendations on immunizations.
8
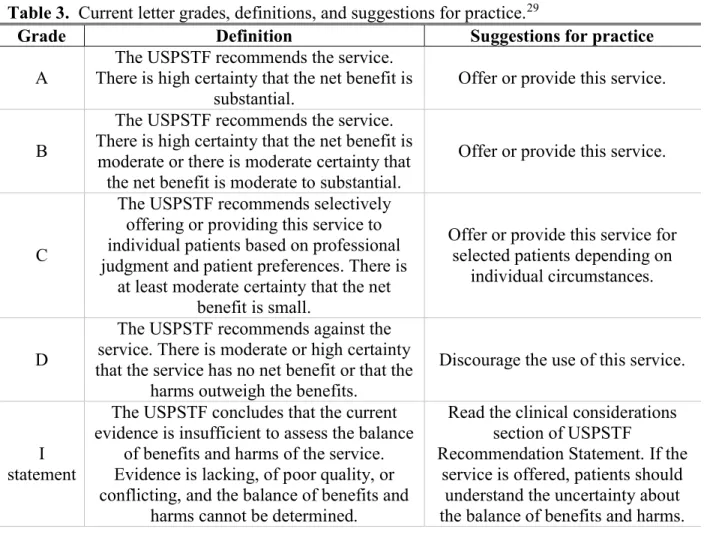
Table 3. Current letter grades, definitions, and suggestions for practice.29
Grade Definition Suggestions for practice
A The USPSTF recommends the service.
There is high certainty that the net benefit is substantial.
Offer or provide this service.
B
The USPSTF recommends the service.
There is high certainty that the net benefit is moderate or there is moderate certainty that the net benefit is moderate to substantial.
Offer or provide this service.
C
The USPSTF recommends selectively offering or providing this service to individual patients based on professional judgment and patient preferences. There is
at least moderate certainty that the net benefit is small.
Offer or provide this service for selected patients depending on
individual circumstances.
D
The USPSTF recommends against the service. There is moderate or high certainty that the service has no net benefit or that the
harms outweigh the benefits.
Discourage the use of this service.
I statement
The USPSTF concludes that the current evidence is insufficient to assess the balance
of benefits and harms of the service.
Evidence is lacking, of poor quality, or conflicting, and the balance of benefits and
harms cannot be determined.
Read the clinical considerations section of USPSTF
Recommendation Statement. If the service is offered, patients should
understand the uncertainty about the balance of benefits and harms.
9 METHODS
Collection of current and historical USPSTF recommendation statements
On its official website, the USPSTF lists the set of preventive services topics for which it has published specific recommendations.30 For each topic, the USPSTF website provides
hyperlinks to the most recently published recommendation statement and to additional supporting documents such as the final research plan, the final evidence review, an evidence summary, and a one-page clinical summary. Using these hyperlinks, I obtained the most
recently published recommendation statement for each listed topic. I last consulted the USPSTF website on June 1, 2017.
While the USPSTF website archives older versions of recommendation statements for many topics, not all historical recommendation statements are referenced or available for download. For this reason, I used the most recently issued recommendation statement for each topic to identify the previously issued recommendation statement (or statements) on the same topic. In most cases, the abstract of the recommendation statement referenced the year in which the previous recommendation statement had been issued. For recommendation statements published in 2010 and later, a specific section within each statement compares the updated recommendations with the previously issued recommendations on the same topic. Using this information, I searched PubMed to identify historical recommendation statements when they were not available on the USPSTF website. In most instances, I was able to retrieve
recommendation statements that had been published in peer-reviewed academic journals. In a few cases, however, I could only obtain recommendation statements that had been released directly by the Agency for Healthcare Research and Quality (AHRQ). I collected
recommendation statements in reverse chronological order, mapping them back either to
10
recommendation statements issued on new topics or to recommendations included in the second edition of the Guide (published in 1996).31
Data extraction
I extracted data from each identified recommendation statement and from the topic chapters and tables of ratings in the second edition of the Guide. For each recommendation statement or chapter, I documented its title, its publication date, the status of the recommendation statement (historical or current), a determination of whether the topic had previously been
evaluated (updated topic or new topic), and the current topic status (active, inactive, or referred).
For each individual recommendation, I extracted the text of the recommendation summary, its associated letter grade, and the targeted population.
Considerations for recommendations included in the second edition of the Guide Extracting data from recommendations published in the second edition of the Guide presented several unique challenges (see Appendix A for full discussion). First, the chapters written for each topic included in the Guide do not always clearly outline the individual recommendations and their associated letter grades. For this reason, I used the tables of ratings (included in Appendix A of the second edition of the Guide) to delineate the individual
recommendations issued on each topic. I referenced the chapter associated with each table to further interpret individual recommendations. Second, several topics included in the second edition of the Guide have not been updated by the Task Force (for a list of these topics, see Appendix B, Table B15). I only extracted data for recommendations issued on topics that have since been updated. Third, the methodology for assigning recommendation grades to counseling
11
interventions has substantially evolved over time. The second edition of the Guide, however, provided sufficient information to interpret its recommendations on counseling interventions in the context of the current grading system (see Appendix A). Finally, prior to issuing its first recommendations in 2001, the third Task Force significantly updated the recommendation grading system.32 These changes included the establishment of the “I” letter grade and an update of the “C” letter grade definition. For “C” recommendations issued in the second edition of the Guide, the Task Force concluded that current evidence was insufficient to recommend for or against the routine inclusion of a preventive service in the periodic health exam, but that recommendations for the service could be made on other grounds.33 Unless the text associated with a “C” recommendation issued in the second edition of the Guide clearly indicated
otherwise, I interpreted it as a recommendation neither for nor against the routine use of a service when comparing it to updated recommendations.
Summary of active USPSTF recommendations
I tabulated the current number of active topics and individual recommendations listed on the USPSTF website as of June 1, 2017. I then calculated the number and proportion of active recommendations assigned each letter grade. I further calculated the number and proportion of active topics with at least one negative (“D”) recommendation, positive (“A” or “B”)
recommendation, “C” recommendation, or “I” statement. Finally, I compiled a summary of all active recommendations published within the past five years (from June 1, 2012 to June 1, 2017), roughly the set of recommendations eligible for inclusion in the National Guidelines
Clearinghouse.34
12
Assessing changes in the allocation of USPSTF recommendation grades over time I calculated the number and proportion of USPSTF recommendations issued by letter grade for each year from 2001 to 2017. Given the small number of recommendations issued in any single year and the high variability seen between years, I aggregated individual
recommendations into three time periods based on their publication date: January 2001 to
December 2005, January 2006 to December 2012, and January 2013 to June 2017. I chose these time periods to roughly divide the number of individual recommendations published in each time period into thirds. I used these same time periods for subsequent analyses, as described below.
In all cases, I varied the boundaries of the time periods by one to two years in either direction and evaluated how doing so affected key observations.
Mapping topic updates to previously issued recommendation statements
For each recommendation statement issued on an updated topic, I compared the updated recommendations to the most recent previously issued recommendations on the topic. The topic covered by an updated recommendation statement, however, does not always precisely
correspond to the topic covered by a single previously issued recommendation statement. For cases in which the topic covered by an updated recommendation statement diverged from a previously reviewed topic, I only compared the relevant previously issued recommendations to the updated recommendations on the topic. Similarly, for cases in which the topic covered by an updated recommendation statement included recommendations covered by two or more
previously issued recommendation statements, all relevant previously issued individual
recommendations were used for making comparisons. Illustrative examples of this strategy are
13 provided in Appendix A.
Point-based method for assessing the directionality of topic updates
When recommendations for a topic are updated, the specific interventions and
subpopulations covered by individual recommendations frequently change. As a consequence, one-to-one relationships between updated individual recommendations and previously issued individual recommendations do not always exist. For this reason, I used a point-based method to measure the directionality of changes made to recommendations at the topic level. For every recommendation statement issued on an updated topic, I assigned each individual
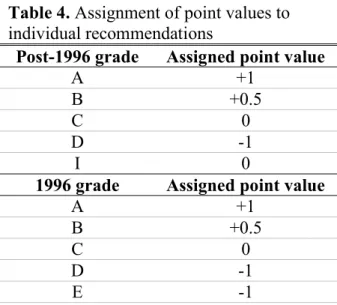
recommendation a point value ranging from -1 to +1 based on its letter grade (Table 4).
The method for assigning points to individual recommendations was chosen for its simplicity. While the recommendation grading system has undergone significant revisions since the publication of the second edition of the Guide, the essence of the grade definitions for “A”,
“B”, and “D” recommendations has remained relatively stable over time.5 Similarly, while the standard recommendation language and suggestions for practice associated with “C”
recommendations have undergone periodic revisions, the requirement of at least “moderate certainty” (or at least “fair evidence” prior to May 2007) of small net benefit in the assignment of a “C” letter grade has remained stable since the third Task Force significantly updated the
methods for assigning letter grades.3,5 In the grading system used by the second Task Force, a
“C” letter grade was assigned when insufficient evidence was available to determine whether or not the routine use of an intervention would improve clinical outcomes.33 Given that “I”
statements and have consistently indicated that the Task Force either found insufficient evidence to make a judgment about the effectiveness of an intervention or sufficient evidence that
14
magnitude of net benefit of routinely offering a service is small, all “I” statements and “C”
recommendations were assigned a point value of zero. For negative recommendations, the second Task Force issued one of two letter grades (“D” or “E”) based on the level of evidence against the routine use of the preventive service. In the current grading system, however, only a single negative letter grade (“D”) exists. For this reason, all “D” and “E” recommendations across time were assigned a score of -1.
For each topic update, I calculated two different “directionality scores” reflective of the overall change in the letter grades assigned to individual recommendations on a topic compared to the most recent previously issued recommendations on the same topic (Figure 1). Based on publication date, I aggregated topic updates into three time periods as specified above. For each time period and method for calculating the directionality score, I tabulated the number and proportion topic updates assigned positive, neutral, and negative directionality scores.
Table 4. Assignment of point values to individual recommendations
Post-1996 grade Assigned point value
A +1
B +0.5
C 0
D -1
I 0
1996 grade Assigned point value
A +1
B +0.5
C 0
D -1
E -1
15
Figure 1. Calculation of point-based directionality scores for topic updates
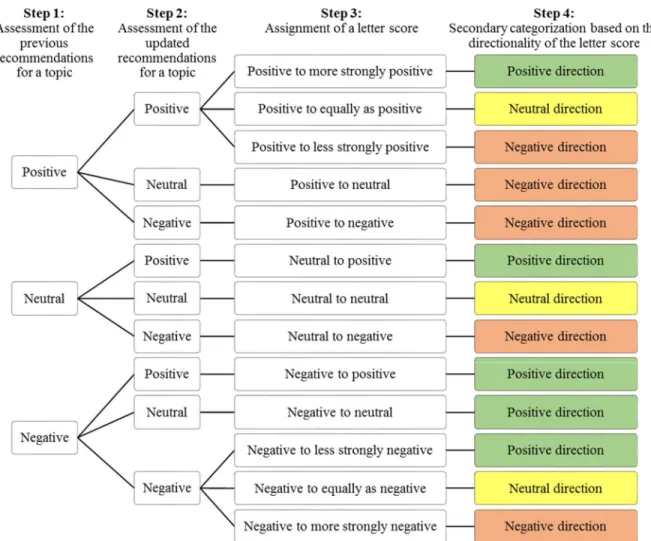
Classification-based method for assessing the directionality of topic updates
To supplement the point-based directionality scores, I additionally used a classification- based system to assess the directionality of topic updates. For these assessments, I only
considered recommendations that applied to interventions and populations covered by both the updated and previously issued sets of recommendations on a topic. For each topic update, I individually categorized both the updated and prior sets of recommendations based on whether the Task Force had recommended in favor of (“positive”), against (“negative”), or neither for nor against (“neutral”) the use of the preventive services under consideration (Figure 2, Step 1 and Step 2). In making these assessments, “C” recommendations were considered “neutral”, even though the definition of this letter grade has changed over time. A set of recommendations only received a “neutral” overall assessment if it included no positive or negative recommendations.
When a set of recommendations included both positive and negative recommendations, I prioritized the positive recommendations in making an overall assessment (see Appendix A for examples).
Based on these assessments, I assigned a “letter score” to each topic update reflective of the change in letter grades assigned to recommendations for preventive services covered by both
Directionality score (Method 1)
= Mean point value of updated recommendations – Mean point value of previously issued recommendations
Directionality score (Method 2)
= Sum of points for updated recommendations – Sum of points for previously issued recommendations
16
the updated and prior sets of recommendations (Figure 2, Step 3). If both the updated and prior set of recommendations for a topic received a “positive” overall assessment, I evaluated whether the letter grades for the considered recommendations became more positive, less positive, or remained equally as positive. Similarly, if both the updated and prior set of recommendations received a “negative” overall assessment, I evaluated whether the letter grades for the considered recommendations became more negative, less negative, or remained equally as negative.
Finally, I secondarily categorized each topic update based on the directionality of its assigned letter score (Figure 2, Step 4).
Specific rules were developed for issuing letter scores in special cases, such as when linkages between prior and updated recommendations could not be easily inferred. These rules and illustrative examples are provided in Appendix A. In general, however, when the change in recommendations was unclear, I assigned a neutral letter score. Furthermore, I did not consider a previously issued individual recommendation on a topic if the Task Force chose not to update it.
Similarly, I did not consider individual recommendations for newly evaluated interventions or populations. On two occasions, however, I assigned a letter score of “negative to positive” when the Task Force issued a single positive recommendation for an intervention in a high-risk
population after having previously issued a single negative recommendation for its use in a low- risk population (without this exception, these topic updates could not be assigned a score).
17
Figure 2. Approach to assigning letter scores to recommendation statements for updated topics.
For topic updates assigned a variant of a “positive to positive” letter score, I additionally assigned an “intensity score.” The intensity score reflects the change in the breadth of preventive services issued a positive recommendation for a given topic irrespective of the strength of the letter grades assigned to the recommendations. Recommendations for screening interventions, for instance, can apply to populations of different sizes, suggest varying screening intervals, and/or specify screening modalities of differing sensitivities. In many cases, the Task Force does not specifically recommend a single intervention, screening interval, or other characteristic of a preventive service related to its intensity, but does discuss clinical considerations relevant to these characteristics within the text of the recommendation statement. For the purposes of
18
assigning an intensity score to a topic update, I only considered clearly recommended characteristics of a preventive service. The criteria used to assign each of the three possible intensity scores are outlined in Table 5. Several examples of the assignment of intensity scores to topic updates are included in Appendix A. For a subset of topic updates, a second researcher (RH) independently assigned letter scores and intensity scores. Differences in the assignment of these scores were resolved through discussion. This process secondarily led to the refinement of the classification system.
For all topic updates issued from 2001 to 2017, I calculated the number and proportion issued each of the possible letter scores. I then aggregated topic updates into three time periods as specified above. I calculated the number and proportion of topic updates assigned positive, neutral, and negative letter scores for each time period. For topic updates issued intensity scores, I similarly calculated the number and proportion topic updates assigned each of the possible intensity scores stratified by time period.
Table 5. Non-exhaustive list of criteria used to assign intensity scores to topic updates (only changes in positive recommendations considered)
Same intensity (all criteria must apply)
• Recommendations apply to same population
• Recommended screening or counseling intervals remain unchanged
• Recommended ages for starting or stopping provision of preventive service remain the same
• For preventive medications, the recommended dosing remains unchanged Increased intensity (at least one criterion must apply)
• Recommendations apply to larger population
• Recommended screening or counseling intervals decrease (i.e. more frequent)
• Recommended ages for starting or stopping provision of preventive service become broader
• For preventive medications, the recommended dosing is increased Decreased intensity (at least one criterion must apply)
• Recommendations apply to smaller population
• Recommended screening or counseling intervals increase (i.e. less frequent
• Recommended ages for starting or stopping provision of preventive service become narrower
• For preventive medications, the recommended dosing is decreased
19
Tracking dropped and new “D” recommendations against the use of preventive services The Task Force sometimes chooses not to update a previously issued individual
recommendation for a specific intervention or subpopulation. Occasionally, a previously issued negative recommendation is not updated. The 2016 recommendation statement on breast cancer screening, for instance, did not issue a recommendation for teaching women how to perform the breast self-examination.35 In the previously issued 2009 recommendation statement on breast cancer screening, this intervention received a “D” recommedation.36 I reviewed all
recommendation statements to identify other dropped “D” recommendations. For comparison purposes, I also reviewed all recommendation statements to identify new “D” recommendations for interventions or populations that had not previously been issued a recommendation.
20 RESULTS
Summary of active USPSTF recommendations
As of June 1, 2017, the USPSTF lists 98 topics on its website, including 84 active topics.30 For each active topic, the Task Force has published one or more individual
recommendations with associated letter grades. The currently active topics cover 132 unique recommendations. The number and proportion of active recommendations stratified by grade is depicted in Table 6. Notably, “I” statements constitute the greatest proportion and “C”
recommendations constitute the smallest proportion of letter grades assigned to individual recommendations. Approximately twice as many recommendations endorse the routine use of a preventive services (“A” or “B” recommendations) compared to those that recommend against the routine use of a service (“D” recommendations).
In order for the National Guidelines Clearinghouse to accept a submitted clinical practice guideline, the guideline must have been developed, reviewed, or revised within the past five years.34 A total of 98 currently active recommendations have been issued within the past five years covering 63 topics (75% of active topics). Similar to the entire set of active
Table 6. Number and proportion of active recommendations by grade (as of June 1, 2017) Grade All active recommendations Active recommendations issued between
June 1, 2012 and June 1, 2017
Number Proportion Number Proportion
A 14 10.6% 8 8.2%
B 33 24.8% 27 27.6%
A or B 47 35.6% 35 35.7%
C 7 5.3% 6 6.1%
D 25 18.9% 13 13.3%
I 53 40.2% 44 44.9%
Total 132 n/a 98 n/a
21
recommendations, positive (“A” or “B”) recommendations outnumber negative recommendations, while “I” statements are the most common.
Of all current recommendations statements issued on active topics, half include at least one positive recommendation; whereas, less than a quarter include at least one negative
recommendation (Table 7). Few recommendation statements include a “C” recommendation, while a majority include at least one “I” statement.
Table 7. Number and proportion of active recommendation statements with individual recommendations of certain grades (as of June 1, 2017); total number of active topics = 84
Recommendation statement includes: Number of topics
Proportion of topics
At least one “A” recommendation 12 14.3%
At least one “B” recommendation 31 36.9%
At least one “A” or “B” recommendation 42 50.0%
At least one “C” recommendation 7 8.3%
At least one “D” recommendation 20 23.8%
At least one “I” statement 45 53.6%
Allocation of USPSTF recommendation grades over time
The number of individual recommendations issued by year and grade is depicted is Figure 3. Since 2001, the USPSTF has issued 164 recommendation statements covering 288 individual recommendations. On a year to year basis, significant heterogeneity exists in both the total number of issued recommendations and the proportion of recommendations issued by grade (for a detailed breakdown, see Appendix B, Table B5). In 2010, for instance, the Task Force issued only a single recommendation compared to 23 in the previous year.
22
Figure 3. Number of individual USPSTF recommendations issued by letter grade per year (as of June 1, 2017).
When recommendations are grouped into three time periods based on publication date, trends in the allocation of recommendation grades can be observed (Figure 4). While the proportion of all positive recommendations published during each of these time periods has remained relatively stable, the proportion of “B” recommendations has increased relative to recommendations published in earlier time periods. Conversely, the proportions of published
“A” recommendations and “D” recommendations have decreased. Across time periods, relatively few “C” recommendations have been issued. Finally, since 2013, the proportion of issued “I” statements has increased compared to previous time periods. These trends are generally preserved when adjusting the boundaries of the time periods by one to two years in
6 26
11 24 22
19
7
1 23 26
11 11 19 29
24
14 15
0 5 10 15 20 25 30
2017 2016 2015 2014 2013 2012 2011 2010 2009 2008 2007 2006 2005 2004 2003 2002 2001
Number of Recommendations Issued
A B C D I
Recommendation Grade:
23
either direction (see Appendix B, Table B6). Including 2012 in the most recent time period, however, substantially decreases the observed decline in the proportion of issued “D”
recommendations compared to earlier time periods. This finding can be explained by the high proportion of “D” recommendations issued in 2012 (9 of 19 recommendations; 47.4%).
Time period
Recommendation grade
Total
A B A or B C D I
2001-2005 16 (15.8%) 18 (17.8%) 34 (33.7%) 6 (5.9%) 24 (23.8%) 37 (36.6%) 101 2006-2012 18 (18.4%) 18 (18.4%) 36 (36.7%) 7 (7.1%) 22 (22.4%) 33 (33.7%) 98 2013-2017 8 (9.0%) 26 (29.2%) 34 (38.2%) 5 (5.6%) 9 (10.1%) 41 (46.1%) 89 Total 42 (14.6%) 62 (21.5%) 104 (36.1%) 18 (6.3%) 55 (19.1%) 111 (38.5%) 288 Figure 4. The number and proportion of recommendations issued by grade stratified into three time periods. Data included for all individual recommendations issued from 2001 to 2017 (as of June 1, 2017).
0.0%
20.0%
40.0%
60.0%
2013-2017 2006-2012
2001-2005
A B A or B
"A" or "B" Recommendations
0.0%
20.0%
40.0%
60.0%
2013-2017 2006-2012
2001-2005
"C" Recommendations
0.0%
20.0%
40.0%
60.0%
2013-2017 2006-2012
2001-2005
"D" Recommendations
0.0%
20.0%
40.0%
60.0%
2013-2017 2006-2012
2001-2005
"I" Statements
Allocation of USPSTF recommendation grades by topic status: new versus updated Of the 164 recommendation statements published by the Task Force since 2001, 142 statements issued updated recommendations for previously evaluated topics. The remaining 22 statements issued recommendations for new topics. While a majority of all recommendation statements issued a single recommendation for the evaluated topic, 43% issued more than one recommendation (see Appendix B, Figure B2). A majority of recommendation statements included at least one positive recommendation (Table 8). A slightly larger majority of recommendation statements included at least one “I” statement. Smaller proportions of recommendation statements included at least one “D” or at least one “C” recommendation.
Notably, greater proportions of recommendation statements issued on new topics included at least one “D” recommendation or at least one “I” statement compared to recommendation statements for updated topics.
Allocation of USPSTF recommendation grades by topic over time
When grouping recommendation statements into three time periods based on publication date, similar findings can be observed compared to those seen for all individual
recommendations (Figure 5). Since 2013, a greater proportion of published recommendation statements have included at least one “B” recommendation compared to earlier time periods.
Smaller proportions of recommendation statements have included at least one “A” or at least one Table 8. Number and proportion of recommendation statements containing at least one
individual recommendation of particular grades. Data tabulated for all recommendation statements issued from 2001 to 2017 (as of June 1, 2017).
Topic
status Total Contains at least one recommendation of the following grades:
A B A or B C D I
Updated 142 34 (23.9%) 53 (37.3%) 81 (57.0%) 17 (12.0%) 38 (26.8%) 77 (54.2%) New 22 0 (0.0%) 4 (18.2%) 4 (18.2%) 0 (0.0%) 9 (40.9%) 17 (77.3%) Total 164 34 (20.7%) 57 (34.8%) 85 (51.8%) 17 (10.4%) 47 (28.7%) 94 (57.3%)
25
“D” recommendation. For all three time periods, a majority of published recommendation statements have included at least one “I” statement. A small uptick in this proportion has
occurred over the past several years. Adjusting the boundaries of the time periods by one to two years in either direction preserves these findings (see Appendix B, Table B7).
Time period
Contains at least one recommendation of the following grades:
Total
A B A or B C D I
2001-2005 13 (24.5%) 17 (32.1%) 26 (49.1%) 5 (9.4%) 21 (39.6%) 33 (62.3%) 53 2006-2012 15 (27.3%) 16 (29.1%) 29 (52.7%) 7 (12.7%) 17 (30.9%) 28 (50.9%) 55 2013-2017 6 (10.7%) 24 (42.9%) 30 (53.6%) 5 (8.9%) 9 (16.1%) 33 (58.9%) 56 Total 34 (20.7%) 57 (34.8%) 85 (51.8%) 17 (10.4%) 47 (28.7%) 94 (57.3%) 164 Figure 5. The number and proportion of recommendation statements containing at least one individual recommendation of a particular grade stratified into three time periods. Data for all recommendations statements issued from 2001 to 2017 is included (as of June 1, 2017).
0.0%
20.0%
40.0%
60.0%
80.0%
2013-2017 2006-2012
2001-2005
A B A or B
At least one "A" or "B"
recommendation
0.0%
20.0%
40.0%
60.0%
80.0%
2013-2017 2006-2012
2001-2005
At least one "C"
recommendation
0.0%
20.0%
40.0%
60.0%
80.0%
2013-2017 2006-2012
2001-2005
At least one "D"
recommendation
0.0%
20.0%
40.0%
60.0%
80.0%
2013-2017 2006-2012
2001-2005
At least one "I"
statement
Point-based assessment of the directionality of topic updates over time
Of the 142 recommendation statements issued on updated topics since 2001, a neutral directionality score was the most commonly assigned score (Table 9) using both point-based assessment methods. A larger proportion of topic updates were assigned a positive directionality score compared to a negative score using method 1. For method 2, however, similar proportions of topic updates were assigned positive and negative directionality scores.
Table 9. Number and proportion of topic updates by directionality assessed using two point- based assessment methods; n = 142. Data tabulated for all recommendation statements issued on updated topics from 2001 to 2017 (as of June 1, 2017).
Point-based directionality score
Positive Neutral Negative
Method 1 45 (31.7%) 63 (44.4%) 34 (23.9%)
Method 2 31 (21.8%) 81 (57.0%) 30 (21.1%)
Grouping topic updates into three time periods reveals trends in the directionality topic updates over time using both point-based assessment methods (Figure 6). The proportion of topic updates assigned positive directionality scores is greater for updates issued from 2013 to 2017 compared to those issued from 2006 to 2012. Conversely, the proportion of topics updates assigned negative directionality scores is smaller. The proportion of topic updates issued neutral scores is greater for updates issued from 2006 to 2012 compared to updates issued from 2001 to 2005, but is similar when comparing the most recent time period to 2006 to 2012. Adjusting the boundaries of the time periods by one to two years in either direction does not affect these findings (see Appendix B, Table B9).
27 Time
period
Point-based directionality score
Total
Method 1 Method 2
Positive Neutral Negative Positive Neutral Negative
2001-2005 14 (29.8%) 18 (38.3%) 15 (31.9%) 11 (23.4%) 22 (46.8%) 14 (29.8%) 47 2006-2012 11 (23.9%) 22 (47.8%) 13 (28.3%) 6 (13.0%) 28 (60.9%) 12 (26.1%) 46 2013-2017 20 (40.8%) 23 (46.9%) 6 (12.2%) 14 (28.6%) 31 (63.3%) 4 (8.2%) 49 Total 45 (31.7%) 63 (44.4%) 34 (23.9%) 31 (21.8%) 81 (57.0%) 30 (21.1%) 142 Figure 6. The number and proportion of topic updates assigned positive, neutral, and negative directionality scores using two point-based assessment methods stratified into three time periods.
Data included for all recommendations statements issued on updated topics from 2001 to 2017 (as of June 1, 2017).
Classification-based assessment of the directionality of topic updates over time
A letter score of neutral directionality was assigned to a majority of the 142 topic updates issued from 2001 to 2017 (Table 10). Of these, a letter score of “positive to equally as positive”
was most common. Smaller proportions of updated topics were assigned letter scores of positive directionality and negative directionality. Of the topic updates assigned letter scores of positive directionality, a majority (22 of 27, 81.5%) included a recommendation in favor of routinely offering a preventive service (letter scores of “positive to more strongly positive”, “neutral to positive”, or “negative to positive”).
0.0%
20.0%
40.0%
60.0%
80.0%
2013-2017 2006-2012
2001-2005
Positive Neutral Negative
Method 1
0.0%
20.0%
40.0%
60.0%
80.0%
2013-2017 2006-2012
2001-2005
Positive Neutral Negative
Method 2
28
Table 10. Number and proportion of topic updates by letter score and letter score directionality; n = 142. Data tabulated for all recommendation statements issued on updated topics from 2001 to 2017 (as of June 1, 2017).
Letter score Number
(proportion)
Letter score directionality
Number (proportion) Positive to more strongly positive 6 (4.2%)
Positive 27 (19.0%) Neutral to positive 14 (9.9%)
Negative to positive 2 (1.4%) Negative to neutral 5 (3.5%) Negative to less strongly negative 0 (0.0%) Positive to equally as positive 44 (31.0%)
Neutral 85 (59.9%) Neutral to neutral 27 (19.0%)
Negative to equally as negative 14 (9.9%) Positive to less strongly positive 15 (10.6%)
Negative 30 (21.1%) Positive to neutral 5 (3.5%)
Positive to negative 2 (1.4%) Neutral to negative 5 (3.5%) Negative to more strongly negative 3 (2.1%)
When topics updates are grouped into three periods based on the directionality of their assigned letter scores, similar findings result in comparison to those seen using the point-based methods (Figure 7). For topics updates issued from 2013 to 2017, the proportion assigned a letter score of positive directionality is slightly greater compared to topic updates issued from 2006 to 2012, but slightly smaller compared to topic updates issued from 2001 to 2005. The proportion of topic updates assigned a letter score of negative directionality has decreased across each of these periods, while the proportion of topic updates assigned a letter score of neutral directionality has increased.
29
Figure 7. The number and proportion of topic updates issued letter scores of positive, neutral, and negative directionality. Data included for all recommendations statements issued on updated topics from 2001 to 2017 (as of June 1, 2017).
A total of 65 (45.8%) topic updates received a variant of a “positive to positive” letter score which made them eligible for the additional assignment of an intensity score. Overall a majority of these updates received an intensity score of “same intensity,” while smaller proportions received scores of “increased intensity” and “decreased intensity” (Figure 8).
Notably, over the most recent time period (2013 to 2017), a greater proportion of updates
received a score of “increased intensity” and a smaller proportion received a score of “decreased intensity” compared to the previous time periods. The proportion of topic updates receiving a score of “same intensity” increased across time periods. Varying the time periods by one to two
Time period
Directionality of Letter Score
Total Positive Neutral Negative
2001-2005 11 (23.4%) 23 (48.9%) 13 (27.7%) 47 2006-2012 6 (13.0%) 28 (60.9%) 12 (26.1%) 46 2013-2017 10 (20.4%) 34 (69.4%) 5 (10.2%) 49 Total 27 (19.0%) 85 (59.9%) 30 (21.1%) 142
0.0%
20.0%
40.0%
60.0%
80.0%
100.0%
2013-2017 2006-2012
2001-2005
Positive Neutral Negative Directionality of Letter Score
30
years in either direction preserves the trends observed for letter scores and intensity scores (see Appendix B, Tables B10 and B11).
Figure 8. The number and proportion of topic updates issued for each of the possible intensity scores stratified in three time periods from 2001 to 2017 (as of June 1, 2017).
Dropped and new “D” recommendations against the use of preventive services
The Task Force chose not to update a “D” recommendation for a previously evaluated intervention or population on eight identified occasions (Appendix B, Table B11). A majority of these dropped “D” recommendations occurred in the past several years (6 of 8 since 2013). They include instances when the Task Force dropped a recommendation against the use of a
preventive service in a low-risk population37–40, a recommendation against the use of a service in a particular age group41, and a recommendation against the use of a screening-related
Time period
Intensity Score Total Increased Same Decreased
2001-2005 2 (11.1%) 11 (61.1%) 5 (27.8%) 18 2006-2012 1 (4.2%) 17 (70.8%) 6 (25.0%) 24 2013-2017 5 (21.7%) 17 (73.9%) 1 (4.3%) 23 Total 8 (12.3%) 45 (69.2%) 12 (18.5%) 65
0.0%
20.0%
40.0%
60.0%
80.0%
100.0%
2013-2017 2006-2012
2001-2005
Increased Same Decreased Intensity Score
31 intervention.35
On 14 occasions, the Task Force issued a new “D” recommendation for a previously unevaluated intervention or population (Appendix B, Table B12). A majority of these
recommendations were issued for new topics (9 of 14). Only one of these recommendations has been issued since 2013. The number of new and dropped “D” recommendations stratified by time period is depicted in Table 11 below.
Table 11. Number of dropped “D” recommendations and new “D” recommendations stratified by time period since 2001 (through June 1, 2017)
Time period
Number of dropped “D”
recommendations
Number of new “D” recommendations (intervention or population not previously evaluated)
New topics Updated topics All topics
2001-2005 2 5 3 8
2006-2012 0 3 2 5
2013-2017 6 1 0 1
Total 8 9 5 14
32 DISCUSSION
Primary study findings
In this study, I sought to address the recent allegation that the Task Force has become increasingly generous in issuing recommendations in favor of the use of preventive services.7 If true, I hypothesized that this change could have an observable effect on the allocation of
individual recommendation grades, the directionality of topic updates, or both. The results of this study, however, indicate that the proportion of recommendations assigned positive letter grades has only slightly increased over time. Instead, the proportion of negative
recommendations issued over the past several years has substantially decreased, while the proportion of “I” statements has increased. Furthermore, the study findings consistently indicate that negative changes in the overall set of recommendations issued for updated topics have become less common over time, while neutral changes (no change in the updated set of recommendations for a topic) have become more common. More recently, positive changes have become increasingly common. Each of these main findings is discussed in greater detail below.
Changes in the allocation of recommendation grades over time
If the Task Force is increasingly promoting preventive services, such a shift should result in a greater proportion of recommendations issued positive letter grades. Instead, the overall proportion of recommendations issued “A” or “B” letter grades has only slightly increased over time. Furthermore, the proportion of recommendations issued “A” letter grades has decreased.
Similar trends have occurred for the proportions of recommendation statements including at least one “A” or “B” recommendation. Taken together, these findings indicate that the proportion of
33
recommendations issued positive letter grades has not substantially increased over time, and conversely, that “A” recommendations have become less common.
While the proportion of positive recommendations issued by the Task Force has remained relatively stable over time, both the proportion of recommendations issued “D” letter grades and the proportion of recommendation statements including at least one “D” recommendation have markedly decreased. These observed reductions have at least three potential contributors. First, the number of new topics including a “D” recommendation has decreased over time. Second, the Task Force has increasingly chosen not to update several “D” recommendations for previously evaluated interventions and/or populations. Finally, the observed increase in “I” statements could be reflective of an increase in the evidence threshold necessary for issuing “D”
recommendations.
Changes in the directionality of topic updates over time
An increase in the promotion of preventive services could result from changes in recommendations made when updating previously evaluated topics. In this study, both a point- based and a classification-based method were used to measure the overall directionality of these changes for updated topics. The point-based method considered all recommendations issued on a topic, regardless of whether they covered interventions or populations evaluated by both the updated and previously issued sets of recommendations. The classification-based system, on the other hand, only considered recommendations for interventions and populations covered by both the prior and updated set of recommendation. Despite this difference, both methods yielded similar results. First, regardless of how the directionality of topic updates is assessed, neutral changes (no change in the updated set of recommendations for a topic) have become
34
progressively more common. Second, there has been a recent increase in positive changes and a sustained decrease in negative changes made when issuing updated recommendations. While these findings could be explained by changes in evidence for evaluated services, they could also indicate that the Task Force has become less hesitant to promote the use of preventive services and/or more reluctant to discourage the use of services.
Limitations
The small number of recommendations issued by the Task Force on an annual basis limits the ability to draw strong inferences about the presence or absence of trends in the allocation letter grades and the directionality of topic updates over time. Because of the substantial heterogeneity in both the total number of recommendations and proportion of recommendations assigned specific letter grades in any individual year, such trends are only observable when grouping recommendations into time periods of longer duration. While most of the key findings of this study are preserved when adjusting the boundaries of the selected time periods, the possibility that some of these findings could be explained by random variability in the issuance of recommendations cannot be excluded. Despite this limitation, the consistency of the findings serves as a strength of the study. Furthermore, since all issued recommendations are included in the analyses, there is no uncertainty in the values reported in the study.
Each of the methods used to evaluate the directionality of topic updates also has distinct limitations. The first point-based method for assessing the directionality of topic updates
provides insight into how the average recommendation letter grade issued for individual
recommendations for a topic changes when the recommendations issued on a topic are updated.
The second method provides insight into the how the quantity of individual recommendations in
35
favor and against the use of preventive services for a topic change when the recommendations on the topic are updated. Any updated individual recommendation, however, may differ in the specific populations or interventions it covers compared to the previously issued
recommendation(s). The point-based methods for assessing the directionality of topic updates do not take these potential changes into account. As such, these scores may not always reflect how the breadth of preventive services recommended by the Task Force on a topic change.
In contrast, the classification-based system for evaluating topic updates only considers recommendations for interventions and populations covered by both the prior and updated set of recommendations on the topic. The letter score reflects changes in the strength of
recommendations for interventions in populations covered by both sets of recommendations, while the intensity score reflects changes in the breadth of interventions issued positive recommendations. Unlike the point-based methods for measuring the directionality of topic updates, however, recommendations for interventions or populations evaluated only in the updated or previous set of recommendations on a topic do not factor into the assignment of these scores. Thus, the point-based and classification-based methods for evaluating topic updates are complementary, each offering a different characterization of how the set of recommendations issued on a topic change when updated.
Finally, only a single researcher (GT) assigned letter scores and intensity scores to topic updates. The inter-rater reliability of these scores was not assessed. A second researcher (RH), however, evaluated a selected subset of topic updates, with differences in the assignment of scores resolved through discussion.
36
Possible explanations of the primary study findings and their implications
Several possible factors could have contributed to the longitudinal changes in the
issuance of Task Force recommendations observed in this study. These potential factors include changes in evidence for evaluated services, changes in the methodology for assigning
recommendations, political pressures, the link between coverage policy and recommendations, and changes in the thresholds used to delineate recommendation grades. As opposed to one single factor, some combination of these factors (or others) likely explain the findings of this study. The possible influence of each suggested factor is discussed more fully below.
Changes in evidence. A change in the letter grade for a previously issued
recommendation may result from a change in the evidence base used to assess the certainty and magnitude of net benefit of the evaluated preventive service. Changes in evidence may also make the issuance of a recommendation less relevant or may justify the issuance of new recommendation for a specific subpopulation or intervention. Across time, several
uncontentious changes have been made to recommendations based on new evidence widely deemed sufficient to justify the changes. On other occasions, however, recommendation changes have faced criticism for relying on new evidence considered insufficient to merit such changes.
These criticisms raise the question of whether other factors, beyond changing evidence, could be responsible for the broad changes in the allocation of recommendation grades and the
directionality of topic updates suggested by this study.
Methodological changes. The methodology used by the Task Force to evaluate evidence, its process for assigning recommendation letter grades, and the standard language associated with letter grades have all significantly evolved over time. Changes in any of one these domains could have broadly affected the issuance of recommendations and contributed to the findings of
37
this study. Across time, however, the fundamental approach used to develop recommendations has remained stable. The Task Force assesses both the sufficiency of available evidence and the balance of harms and benefits for a preventive service in making a recommendation for or against its use. Thus, while the findings of this study could, in part, be explained by longitudinal changes in the methodology used by the Task Force to issue recommendations, other factors are also likely to be at play.
Political pressures. As amended by the PPACA42, the Public Health Service Act asserts that “all members of the Task Force …, and any recommendations made by such members, shall be independent and, to the extent practicable, not subject to political pressure.”43 Despite this requisite, the Task Force has not always been able to avoid the political spotlight. The most prominent example of Task Force recommendations entering the political realm occurred during the height of health reform deliberations in 2009. In November of that year, the Task Force published an updated set of recommendations on breast cancer screening, including a
controversial “C” recommendation “against routine screening mammography” in women aged 40 to 49 years.36 While the previously issued recommendation had “made a similar point in different words,” the media portrayed this change as a new recommendation against
mammography for all women in this age group.44,45 The Task Force quickly faced a bevy of criticism, including public calls for its dissolution.46 In December 2009, Senator David Vitter (R-LA) proposed an amendment to the Senate health care bill which required health care legislation and any other provision of law to refer to the previously issued 2002
recommendations on breast cancer screening.47 The Senate immediately accepted the amendment by unanimous consent agreement. A few days later, the Task Force voted to update the language of its “C” recommendation to clarify its original intent by omitting the widely misinterpreted first