Munich Personal RePEc Archive
Schumpeter vs. Keynes Redux: "Still
Not Dead"
Dalton, John and Gaeto, Lillian
14 December 2018
Online at
https://mpra.ub.uni-muenchen.de/90543/
Schumpeter vs. Keynes Redux: “Still Not Dead”
∗
John T. Dalton
†Wake Forest University
Lillian R. Gaeto
‡Vanderbilt University
First Version: December 2018
Abstract
Diamond (2009) compares the citation time series for Schumpeter and Keynes from 1956 to 2006. Citations to Schumpeter steadily increase throughout the period, whereas citations to Keynes begin to level off and then trend slightly downward beginning in the 1990s. As a result, citations to Schumpeter begin to outstrip those to Keynes. This paper replicates Diamond (2009) and extends the analysis to 2017, which incorporates citations since the onset of the Great Recession. The replication confirms the results in Diamond (2009). The analysis beyond 2006 shows citations to Schumpeter remain larger than to Keynes, but citations to Keynes undergo a resurgence. The paper argues the Great Recession helped renew interest in Keynes. Google Trends data for Schumpeter and Keynes are compared and provide evidence showing the heightened interest in Keynes during the Great Recession. For example, in the United States, the peak of Keynes’s search interest occurs in February 2009, five months after Lehman Brothers declared bankruptcy.
JEL Classification: B30, B20, B00
Keywords: Joseph Schumpeter, John Maynard Keynes, citations, Web of Sci-ence, Google Trends
∗The paper we replicate is entitled “Schumpeter vs. Keynes: “In the Long Run Not All of Us Are Dead”,”
hence our title.
†Contact: Department of Economics, Kirby Hall, Wake Forest University, Box 7505, Winston-Salem, NC
27109. Email: daltonjt@wfu.edu
‡Contact: Department of Economics, Vanderbilt University, VU Station B 351819, 2301 Vanderbilt Place,
1
Introduction
With foundational contributions to the study of entrepreneurship, innovation, and creative
de-struction on the one hand and aggregate demand and the use of fiscal and monetary policy to
manage crises on the other, the ideas of Joseph Schumpeter and John Maynard Keynes remain
relevant to scholars and policy-makers today. But, which author is more influential, as, say,
measured by annual citations? We wager most respondents to this question would guess Keynes
and many, mostly policy-makers, would not even know of Schumpeter.1
Yet Diamond (2009)
shows citations to Schumpeter began to outstrip those to Keynes beginning in the 1990s.
The sample period in Diamond (2009) is 1956-2006, which does not cover the years of the
Great Recession and its aftermath, years which saw many scholars and policy-makers reach into
the past for answers to deal with contemporary problems. Indeed, one of the central policy
debates during the Great Recession was austerity versus stimulus, or what the optimal level
of government intervention should be in the face of crisis, a debate, in one sense, between the
defenders and detractors of the ideas put forth in Keynes’sThe General Theory of Employment,
Interest, and Money. Robert Skidelsky, a biographer of Keynes, for example, left nothing to the
reader’s imagination by entitling his salvo into the debate asKeynes: The Return of the Master,
a book which includes the following statement on its cover: “Why, Sixty Years After His Death,
John Maynard Keynes Is the Most Important Economic Thinker for America” (Skidelsky 2009).
In light of the Great Recession, we return to Diamond (2009)’s contribution and compare the
citation time series of Schumpeter and Keynes from the Web of Science database. Our sample
period covers the years 1956-2017, which includes more than a decade’s worth of new data since
the publication of Diamond (2009). Our analysis is as follows: First, we replicate Diamond
(2009) and extend the analysis to 2017. Second, given possible citation inflation in recent years,
we analyze the data in the form of ratios, which gives us a sharper comparison between the two
authors and allows us to more cleanly compare the two time series. Third, we provide evidence
from Google Trends data suggesting heightened interest in Keynes during the Great Recession.
1
Our analysis reveals a number of significant results. In our replication, all of our results
for the period up to 2006 are broadly consistent with those in Diamond (2009), so no results
from Diamond (2009) have been overturned. Extending the data to 2017 shows total annual
citations to Schumpeter continue to outstrip those to Keynes. The main point of Diamond
(2009) still stands, i.e. Schumpeter’s influence, as measured by citations, has grown over time,
even surpassing that of Keynes. However, whereas the citation time series for Keynes in
Dia-mond (2009) shows a clear plateauing or possibly even a slight downward trend beginning in
the mid 1980s, our updated series shows a clear reversal of fortune for Keynes. Total annual
citations to Keynes have been increasing since the mid 2000s. The same patterns hold true
when comparing the total annual citations of Capitalism, Socialism and Democracy and The
General Theory. Capitalism, Socialism and Democracy continues to have more citations than
The General Theory, as documented in Diamond (2009), but citations to The General Theory
have undergone a resurgence, which was not present in the data in Diamond (2009). The
pro-portion of Schumpeter’s citations coming from Capitalism, Socialism and Democracy show an
upward trend in Diamond (2009), but extending the data to 2017 now reveals a clear downward
trend beginning in 2003. Capitalism, Socialism and Democracy is becoming less important as a
source of Schumpeter’s influence.
To complete the replication, we next turn to total annual citations in economics publications
only and consider the same three cuts of the data. Here too we benefit from extending the time
series to 2017, as the results differ in important ways from those in Diamond (2009)’s sample. In
Diamond (2009)’s sample, total citations to Schumpeter and Capitalism, Socialism and
Democ-racy are steadily increasing, whereas those to Keynes andThe General Theory experience the
same change in trend beginning in the mid 1980s. For economics publications only, however,
total citations to Keynes andThe General Theory do not simply level off but experience a clear
and significant downward trend. As a result, by the end of Diamond (2009)’s sample, total
citations to Schumpeter and Keynes and their two magna opera appear fairly even. Extending
the data to 2017 shows the resurgence in citations to Keynes andThe General Theory holds for
economics publications as well. Total citations to Schumpeter and Keynes are fairly even, with
Schumpeter having a slight edge, whereas citations to The General Theory clearly dominate
the Great Recession created a renewed interest in the ideas in The General Theory. The
pro-portion of Schumpeter’s citations coming from Capitalism, Socialism and Democracy exhibits
similar patterns as in the data for all publications. Capitalism, Socialism and Democracy is
becoming less important for Schumpeter’s citations.
Moving beyond our replication exercise and, thus, beyond the analysis presented in Diamond
(2009), we calculate four citation ratios: the Schumpeter-to-Keynes and Capitalism, Socialism
and Democracy-to-The General Theory ratios for all publication and for publications in
eco-nomics only. We interpret the trends in the ratios through the lens of the history of economic
thought. For example, the Schumpeter-to-Keynes citation ratio for economics publications only
shows four distinct periods: 1) an initial period of slight dominance by Keynes, 1956-1972, 2) a
period of heightened dominance by Keynes, 1973-1988, 3) a period of growth in the ratio,
1989-2005, during which Schumpeter becomes more influential relative to Keynes, and 4) a period in
which the growth of the ratio comes to a halt but Schumpeter remains slightly dominant. We
argue these trends match well with what is happening in the field of economics, 1956-2017. In
the first period, Keynesian economics is the dominant paradigm in macroeconomics. The second
period coincides with the stagflation of the 1970s and the emergence of freshwater
macroeco-nomics as an alternative paradigm. Keynes is being cited heavily as researchers wrestle with his
ideas and formulate new ideas. At the same time, this is setting the stage for the plateauing
of Keynes’s citations already mentioned in the underlying citation data. In the third period,
with Keynes’s citations reaching a plateau, the Schumpeter-to-Keynes ratio begins to grow, as
Schumpeter’s citations are steadily increasing. This period coincides with a renewed interest in
Schumpeter’s work, as the literature on growth theory explodes. At the same time, this period
coincides with the onset of the Great Moderation, which means business cycle fluctuations and
how to manage them become less of a concern, keeping down the citations to Keynes. This, of
course, ends with the Great Recession, and there is a renewed interest in Keynes in the fourth
period. Another advantage to using citation ratios is their simplicity, and we think they provide
a useful empirical tool for historians of economic thought interested in comparative analysis of
different economists.
Our last set of results provides empirical evidence from a different source, Google Trends,
the Great Recession and the renewed interest in Keynesian thought on the part of academics
and policy-makers. Search interest in Schumpeter and Keynes has been trending downward in
both the U.S. and the world as a whole over the period 2004-2017. The Great Recession is
correlated with a temporary spike in search interest for both economists in the U.S. but only for
Keynes worldwide. Comparing search interest in Schumpeter and Keynes directly shows Keynes
is searched more heavily than Schumpeter both in the U.S. and the world and especially during
the Great Recession. We think these results show the enduring value of the history of economic
thought and its relevance for current policy debates. Schumpeter and Keynes are still not dead.
Or, as Keynes wrote, “Practical men, who believe themselves to be quite exempt from any
intellectual influences, are usually the slaves of some defunct economist” (Keynes 1936, p.383).
2
Replicating and Extending Diamond (2009)
The developers of the Web of Science citation data continually update the data with new sources,
so replication exercises will rarely yield quantitatively exact results compared to the originals.
However, it seems reasonable to expect the original qualitative results to hold up under
repli-cation. This is precisely what we find when replicating the results in Diamond (2009): all of
our qualitatively results over the period corresponding with the sample in Diamond (2009),
1956-2006, are the same, but some of the magnitudes differ. Of course, we also extend
Dia-mond (2009)’s original sample to include the Great Recession and as many years afterwards as
currently available. Our sample covers the years 1956-2017.
In order to make as clear a comparison as possible, we present our results in the same order
as those in Diamond (2009).2
Figure 1 shows the total citations per year for both Schumpeter
and Keynes. The vertical dotted line at 2006 marks the end of Diamond (2009)’s sample period.
We keep the vertical dotted line in the other figures but choose to suppress the label to reduce
clutter. The results in figure 1 closely match those in Diamond (2009) but for one exception.
Total citations to Schumpeter and Keynes remain close to one another from 1956-72, Keynes
outstrips Schumpeter from 1973-1986, and Schumpeter begins to dramatically outpace Keynes
2
Figure 1: Citations Per Year to Schumpeter and Keynes (All Publications)
0 200 400 600 800 1000 1200 1400 1600 1800 2000 2200 2400
1956 1961 1966 1971 1976 1981 1986 1991 1996 2001 2006 2011 2016
Nu
mb
er
o
f C
ita
tion
s
Year of Citation
Schumpeter
Keynes 2006: Last Year in
Diamond (2009)'s Sample
beginning in 1988. These qualitatively features in the data match those in Diamond (2009) with
slight variation in the timing of the movements. The only noticeable difference between our
results and those in Diamond (2009) comes towards the very end of Diamond (2009)’s sample
period. The magnitudes for both Schumpeter and Keynes become a lot larger. For example,
in 2006, Diamond (2009) shows Schumpeter and Keynes with approximately 400 and 200 total
citations, respectively, whereas our results are nearly double: 744 for Schumpeter, and 435 for
Keynes.
Three main results emerge in the post-Diamond (2009) period. First, Schumpeter continues
to be cited more heavily than Keynes. This means Diamond (2009)’s central point, that
Schum-peter’s influence remains strong long after his death, continues to hold true as measured by
total citations.3
Second, citations to Keynes have undergone a resurgence after a long period of
3
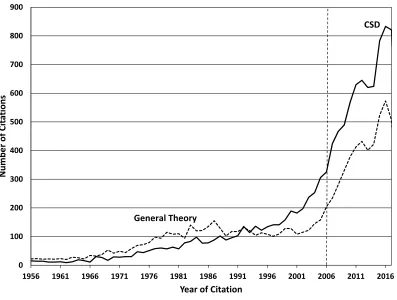
Figure 2: Citations Per Year toCapitalism, Socialism and Democracy andThe General Theory (All Publications)
0 100 200 300 400 500 600 700 800 900
1956 1961 1966 1971 1976 1981 1986 1991 1996 2001 2006 2011 2016
Number of Cit
ations
Year of Citation
CSD
General Theory
stagnation roughly corresponding with the mid 1980s until the mid 2000s. Although the results
in Diamond (2009) show citations to Keynes increasing in 2005 and 2006, there is no way to
discern a change in the trend. Indeed, quite the opposite appears to be the case. A striking
subplot emerging from Diamond (2009)’s results is the plateau or, even, slight decline in the
time series for citations to Keynes. This evidence likely points towards the rise of freshwater
macroeconomics and the declining influence of Keynes among economists, macroeconomists in
particular, during Diamond (2009)’s sample period. In terms of total citations, our results show
Keynes’s influence is again on the rise after 2006, which we think is most likely attributable to
the interest in Keynesian thought in response to the Great Recession. Third, the magnitude of
the increase in citations since 2006 appears quite large, which may suggest citation inflation.
We explore the two issues of the resurgence of Keynes and possible citation inflation in more
detail in section 3. Before doing so, we complete the rest of the replication results.
Schum-Figure 3: Proportion of All of Schumpeter’s Citations that Are Citations toCapitalism, Social-ism and Democracy (All Publications)
0 0.1 0.2 0.3 0.4 0.5 0.6
1956 1961 1966 1971 1976 1981 1986 1991 1996 2001 2006 2011 2016
Ra
tio
of CSD Cit
ations
to All
Cit
ations
Year of Citation
peter’s and Keynes’s most prominent works, Capitalism, Socialism and Democracy and The
General Theory. In figure 2, The General Theory has strictly more citations per year than
Capitalism, Socialism and Democracy until 1992 when the advantage switches to Capitalism,
Socialism and Democracy. Citations to Capitalism, Socialism and Democracy continue to
out-strip those toThe General Theorythroughout the rest of the period. Just like citations to Keynes
undergo a resurgence, though, citations toThe General Theoryalso pick up again when
extend-ing the sample to 2017. Although the difference in citations betweenCapitalism, Socialism and
Democracy and The General Theory remains, the average annual growth rates in citations are
nearly identical after 2006 at 9.3% and 9.2% for Capitalism, Socialism and Democracy andThe
General Theory, respectively. Both books are still gaining prominence.
In the next figure, we look specifically at the composition of Schumpeter’s citations. The
proportion of all Schumpeter’s citations that are to Capitalism, Socialism and Democracy is
[image:9.612.97.495.118.416.2]Figure 4: Citations Per Year to Schumpeter and Keynes (Economics Publications Only)
0 50 100 150 200 250 300 350 400 450 500 550 600 650 700
1956 1961 1966 1971 1976 1981 1986 1991 1996 2001 2006 2011 2016
Number of Cit
ations
Year of Citation Schumpeter Keynes
for the 1956-2006 time period. The data seem to follow a general upward linear trend until
2003 when the proportion reaches a maximum of 0.52. From 2003 to the end of our sample,
however, a downward trend emerges, which is a noticeable difference from the results in Diamond
(2009). Capitalism, Socialism and Democracy is becoming a less important source of citations
for Schumpeter relative to his other works.
Now we focus specifically on the popularity of the two authors within economics publications
only. We filter the citations to include just the citations in publications that fall under the
Economics and Business Finance categories defined by the Web of Science database. Note,
this method differs slightly from Diamond (2009), but this is due to the fact that the Web of
Science database has changed and been updated. Nevertheless, the results we obtain for the
1956-2006 period qualitatively align with those in Diamond (2009), and, thus, we argue the data
are capturing the same effect.
Figure 4 parallels figure 1 by showing total citations per year for Schumpeter and Keynes
Figure 5: Citations Per Year toCapitalism, Socialism and Democracy andThe General Theory (Economics Publications Only)
0 50 100 150 200 250 300 350 400
1956 1961 1966 1971 1976 1981 1986 1991 1996 2001 2006 2011 2016
Number of Cit
ations
Year of Citation
CSD General Theory
(2009). For 1956-2006, citations to Keynes dominate those to Schumpeter with Schumpeter
only reaching parity towards the end of the period. This differs from figure 1 where Schumpeter
dominates Keynes starting in 1988 and continues to do so for the rest of the sample. In economics
publications only, it is not until 2002 that Schumpeter has more citations than Keynes at 145 and
130, respectively. Afterwards, the citations to the two authors move in tandem with Schumpeter
maintaining a slight lead. The contrast between figure 1 and figure 4 tells us that Schumpeter’s
rise in citations is driven by publications that do not fall into the Economics or Business Finance
categories of the Web of Science database. When it comes to each author’s effect on the current
field of economics, the authors appear to be influencing the discipline in a similar magnitude.
The resurgence in citations to Keynes is also evident after extending the data to 2017.
Figure 5 compares the citations per year for Capitalism, Socialism and Democracy and The
General Theory for economics publications only. The results until 2006 again closely match
Figure 6: Proportion of All of Schumpeter’s Citations that Are Citations toCapitalism, Social-ism and Democracy (Economics Publications Only)
0 0.1 0.2 0.3 0.4 0.5 0.6
1956 1961 1966 1971 1976 1981 1986 1991 1996 2001 2006 2011 2016
Ra
tio
of C
SD C
ita
tion
s t
o
All C
ita
tion
s
Year of Citation
only catching up toThe General Theory at the very end of the Diamond (2009)’s sample period.
The upward trend in citations to Capitalism, Socialism and Democracy continues after 2006.
Whereas Diamond (2009) concludes The General Theory is trending moderately downwards
in economics publications, the updated sample clearly shows a resurgence in citations to The
General Theory. Although citations to Schumpeter and Keynes in economics publications are
similar in magnitude after 2006 (figure 4), figure 5 showsThe General Theory being cited much
more frequently than Capitalism, Socialism and Democracy. This result is consistent with our
interpretation that the Great Recession played a role in the resurgence in citations to Keynes.
The General Theory and the ideas and policies it spawned create a framework for responding
to crises in the short run, whereas the focus in terms of the economics in Capitalism, Socialism
and Democracy is much more on the long run, e.g. growth and innovation.
Our last replication result looks at the ratio ofCapitalism, Socialism and Democracycitations
those for all publications in figure 3. As a proportion of all of Schumpeter’s citations, citations
toCapitalism, Socialism and Democracy match the upward trend seen in Diamond (2009), but
that trend seems to have reversed in the post-Diamond (2009) period. Although citations to
Capitalism, Socialism and Democracy continue to increase (figure 5), citations to other works
by Schumpeter are increasing at a faster rate in economics only publications.
3
Schumpeter vs. Keynes Beyond Diamond (2009)
In this section, we extend our analysis beyond just replicating and updating the data in Diamond
(2009) by providing some additional analysis to more thoroughly interpret the results in both
papers. As mentioned in section 2, two issues emerging from our results are 1) the magnitude
of the increase in citations relative to the citations reported in Diamond (2009) and 2) the
resurgence of citations to Keynes in the post-Diamond (2009) period, which we now address in
sections 3.1 and 3.2.
3.1
Schumpeter vs. Keynes Citation Ratios
Citations are not a perfect measure of intellectual influence. One potential problem discussed
by Diamond (2009) is so-called citation inflation, the idea that average citations per paper trend
upwards over time. Citation inflation is one possible reason why the magnitude of the increase
in citations after 2006 appears so large in our figures. For example, for figure 1 showing the
total citations per year for Schumpeter and Keynes, the average annual growth rate in total
citations is 7.5% for Schumpeter and 6% for Keynes, 1957-2006, and 11% for both Schumpeter
and Keynes, 2006-2017. Of course, another possibility is that both Schumpeter and Keynes are
becoming more influential over time. However, the Google Trends data, which is a different
metric of influence, presented in section 3.2 suggest otherwise. In either case, one practical
problem for the reader after including data after 2006 is that clearly identifying the variation
across years and comparing Schumpeter to Keynes becomes difficult. The figures in Diamond
(2009), for example, are much clearer and simpler to interpret on a year by year basis because
the magnitude in the change of the time series across the sample period is much smaller. Since
Figure 7: Schumpeter-to-Keynes Citation Ratio (All Publications)
0 0.5 1 1.5 2 2.5
1956 1961 1966 1971 1976 1981 1986 1991 1996 2001 2006 2011 2016
Ra
tio
of Sch
um
pe
te
r C
ita
tion
s t
o K
ey
ne
s C
ita
tion
s
Year of Citation
looking at the ratio of citations controls for the possibility of inflation and makes for a clean
comparison of the two economists relative to one another.
Figures 7 - 10 present the citation ratios comparing Schumpeter and Keynes: figure 7 shows
the Schumpeter-to-Keynes citation ratio for all publications, figure 8 shows theCapitalism,
So-cialism and Democracy-to-The General Theory citation ratio for all publications, figure 9 shows
the Schumpeter-to-Keynes citation ratio for economics publications only, and figure 10 shows
the Capitalism, Socialism and Democracy-to-The General Theory citation ratio for economics
publications only.
In terms of citations in all publications, the Schumpeter-to-Keynes ratio averages 0.91 from
1956 to 1987. After 1988, the ratio permanently passes 1 and steadily grows thereafter. The ratio
does not dip significantly below this upward trend even after the onset of the Great Recession,
and Schumpeter is currently being cited twice as much as Keynes. Figure 8 shows both some
similarities and differences for the case of the Capitalism, Socialism and Democracy-to-The
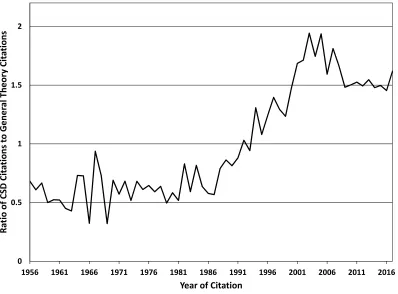
Figure 8: Capitalism, Socialism and Democracy-to-The General Theory Citation Ratio (All Publications)
0 0.5 1 1.5 2
1956 1961 1966 1971 1976 1981 1986 1991 1996 2001 2006 2011 2016
Ra
tio
of CSD Cit
ations
to Gener
al
Theory Cit
ations
Year of Citation
to the Schumpeter-to-Keynes ratio with an initial period ofThe General Theorybeing cited more
frequently followed by Capitalism, Socialism and Democracy being cited more frequently. The
timing for when Capitalism, Socialism and Democracy surpasses The General Theory occurs
later, 1994 compared to 1988. However, after the ratio passes 1, the upward trend clearly
comes to a pronounced halt in the latter period, which is noticeably different compared to
the Schumpeter-to-Keynes ratio. The quantities in figures 7 and 8 also differ. Comparing
over the same period 1956 to 1987, the Capitalism, Socialism and Democracy-to-The General
Theory citation ratio averages 0.61, which is considerably smaller than the 0.91 average for the
Schumpeter-to-Keynes ratio. Whereas the Schumpeter-to-Keynes ratio exhibits a good amount
of parity between the two authors in the first half of our sample, the same cannot be said when
comparing each author’s magnum opus.
The Schumpeter-to-Keynes ratio for economics publications only (figure 9) shows some major
Figure 9: Schumpeter-to-Keynes Citation Ratio (Economics Publications Only)
0 0.2 0.4 0.6 0.8 1 1.2 1.4 1.6
1956 1961 1966 1971 1976 1981 1986 1991 1996 2001 2006 2011 2016
Ra
tio
of Schumpe
te
r Cit
ations
to K
eynes Cit
ations
Year of Citation
1 until 2002, which shows Schumpeter’s influence surpasses Keynes’s much later in economics
publications. There also now appears to be four qualitative moves in the series: 1) an initial
period of slight dominance by Keynes, 1956-1972, when the ratio averages 0.84, 2) a period of
heightened dominance by Keynes, 1973-1988, when the ratio averages 0.59, 3) a period of growth
in the ratio, 1989-2005, during which Schumpeter becomes more influential relative to Keynes,
and 4) a period in which the growth of the ratio comes to a halt, mirroring the period identified
in figure 8, but Schumpeter remains slightly dominant (from 2006-2017, the ratio averages 1.11).
We think the following interpretation helps explain what might be driving the changes in
the relative influence of the two economists across these four periods: In the first period,
Key-nesian economics is a reigning and fashionable paradigm, e.g. “We are all KeyKey-nesians now.”
The second period coincides with the stagflation of the 1970s and the emergence of freshwater
macroeconomics as an alternative paradigm to the Keynesian approach. Keynes is being cited
heavily as researchers wrestle with his ideas and formulate new ideas. At the same time, this is
Figure 10: Capitalism, Socialism and Democracy-to-The General Theory Citation Ratio (Eco-nomics Publications Only)
0 0.2 0.4 0.6 0.8 1 1.2
1956 1961 1966 1971 1976 1981 1986 1991 1996 2001 2006 2011 2016
Ra
tio
of CSD Cit
ations
to Gener
al
Theory Cit
ations
Year of Citation
the underlying citation data. In the third period, with Keynes’s citations reaching a plateau, the
Schumpeter-to-Keynes ratio begins to grow, as Schumpeter’s citations are steadily increasing.
This period also coincides with a renewed interest in Schumpeter’s work, as the literature on
growth theory explodes after the publication of papers such as Romer (1986), Lucas (1988), and
Romer (1990).4
One of the strands of literature emerging from the work on growth theory during
this period is the so-called Schumpeterian growth theory, which operationalizes Schumpeter’s
idea of creative destruction.5
At the same time, this period coincides with the onset of the
Great Moderation, which means business cycle fluctuations and how to manage them become
less of a concern, keeping down the citations to Keynes. This, of course, ends with the Great
Recession, and there is a renewed interest in Keynes in the fourth period. This interpretation
is also consistent with the underlying data in figure 4.
4
Warsh (2006) provides a detailed narrative describing these discoveries and the history of growth theory in general.
5
Figure 10 presents theCapitalism, Socialism and Democracy-to-The General Theorycitation
ratio for economics publications only. This ratio also differs when only looking at economics
publications but only quantitatively. The qualitatively patterns in the series look quite similar,
but all the data are just shifted down in magnitude. For example, the ratio only exceeds 1
during a single period, which is a big difference compared to the ratio for all publications seen
in figure 8.
3.2
Schumpeter vs. Keynes in the Google Trends Data
In this section, we introduce an additional metric by which to measure the relative influence of
the two authors over time. Figures 11 through 16 present monthly data on the popularity of
the economists in terms of how often they were searched on Google from January of 2004 to
December of 2017. The data are standardized on a 0 to 100 scale where the numbers represent
search interest relative to the highest point on the chart for the given region and time. The
maximum value of 100 is the peak popularity for the term, and a score of 50 means that the
term was half as popular and so on. A value of 0 means that there was not enough data for
this term. Google searches are clearly a much broader measure of influence than the citation
counts in the Web of Science data, as any individual with internet access can potentially affect
the measure.
First, we look at the search results in the U.S. and then we extend the data to worldwide
searches. Because of the way the peak popularity is standardized to be 100, it makes sense to
compare the search data for Schumpeter and Keynes separately in figures 11 through 14 and
then to combine and standardize their results in figures 15 and 16. We use the recommended
search term feature on Google Trends to define our search.6
Figure 11 presents the Google Trends data for Schumpeter in the U.S. Two features of the
data are worth noting. The first, and perhaps most surprising, feature of the data is that
Schumpeter achieves peak popularity at the initial data point and actually has adeclining trend
over time. This contrasts markedly with the Web of Science citation data. Since January 2004,
6
Figure
11:
G
o
ogle
Searc
hes
for
Sc
h
ump
eter
(U.S.)
0 20 40 60 80 100 120
Relative Search Interest (100 = Peak Popularity)
Mo
nth
Figure
12:
G
o
ogle
Searc
hes
for
Keynes
(U.S.)
0 20 40 60 80 100 120
Relative Search Interest (100 = Peak Popularity)
Mon
th
[image:19.612.57.698.91.499.2] [image:19.612.56.370.92.496.2]Figure 13: Google Searches for Schumpeter (Worldwide)
0 20 40 60 80 100 120
Re
la
tiv
e Sear
ch In
ter
es
t (100 = P
eak P
opularity)
Month
Schumpeter’s popularity, as measured by Google Trends, has been falling, albeit somewhat
unevenly. The second feature of the data worth noting is the spike in interest shortly after the
onset of the Great Recession. Search interest in Schumpeter reaches 88 in October 2008, one
month after Lehman Brothers declared bankruptcy. After this peak, however, search interest
steadily declines, reaching its lowest point of 12 towards the end of the sample period in August
2017.7
Google searches for Keynes in the U.S. reach a peak much later than Schumpeter according to
the data in figure 12. Keynes receives the maximum score of 100 in February of 2009, five months
after Lehman Brothers declared bankruptcy and when the U.S. economy was in the midst of
the Great Recession, which officially ended in June of 2009 according to the NBER’s dating.
Following this month of peak popularity, Keynes’s relative search interest trends downward just
7
Figure 14: Google Searches for Keynes (Worldwide)
0 20 40 60 80 100 120
Re
la
tiv
e Sear
ch In
ter
es
t (100 = P
eak P
opularity)
Month
like Schumpeter and reaches a low of 10 in August 2017. Thus, the Google Trend data for both
authors differ from the results obtained from the Web of Science citation counts.
Comparing search interest for Schumpeter and Keynes worldwide to that of the previous
results for the U.S. shows some important differences. First, Schumpeter’s popularity trends
downward over time, just like in the U.S., but does not experience a spike during the Great
Recession (figure 13). Second, figure 14 shows search interest in Keynes also trends downward
but experiences a spike during the Great Recession, as in the U.S. But, the results for Keynes’s
popularity in the U.S. and worldwide are still markedly different in that the intensity of the
search interest during the Great Recession is much higher in the U.S. than worldwide. Whereas
figure 12 for the U.S. shows a peak of 100 in February 2009, the data in figure 14 only reach
80 in February 2009. These results suggest Schumpeter and Keynes were more popular in the
U.S. during the Great Recession, which makes sense given the origins of the financial crisis in
the subprime mortgage market based primarily in the U.S.
Figure 15: Google Searches for Schumpeter Compared to Keynes (U.S.)
0 20 40 60 80 100 120
Re
la
tiv
e Sear
ch In
ter
es
t (100 = P
eak P
opularity)
Month Keynes
Schumpeter
Figure 16: Google Searches for Schumpeter Compared to Keynes (Worldwide)
0 20 40 60 80 100 120
Re
la
tiv
e Sear
ch In
ter
es
t (100 = P
eak P
opularity) Keynes
[image:22.612.98.497.438.734.2]and Keynes at the same time. This allows us to see which economist was more popular at a
particular time. Figures 15 and 16 present the results for the U.S. and worldwide, respectively.
The patterns in both figures are similar. Search interest in Keynes is higher than Schumpeter
with significant spikes during the Great Recession.
4
Conclusion
Schumpeter and Keynes are still not dead. Their ideas live on through their many seminal
con-tributions, including those in Capitalism, Socialism and Democracy and The General Theory
of Employment, Interest, and Money. At the time of their deaths, Keynes would have been
considered the more influential economist of the two. Yet Diamond (2009) documents
Schum-peter’s influence, as measured by citations, steadily increased since the 1950s and eventually
surpassed that of Keynes. Since the publication of Diamond (2009), however, much has
hap-pened in the economics profession in the aftermath of the Great Recession, including an ongoing
period of soul-searching in macroeconomics. With the availability of another decade’s worth of
citation data, we revisit Diamond (2009)’s research question by comparing the time series of
total citations for Schumpeter and Keynes.
Our replication shows the results in Diamond (2009) continue to hold. Extending the data
to 2017 shows Schumpeter continues to outpace Keynes in citations, but Keynes has clearly
undergone a resurgence, which we argue in part must be due to the interest in his ideas after the
Great Recession. Documenting the ratio of citations between Schumpeter and Keynes allows
us to more sharply and cleanly compare the two economists, and we find the patterns in the
data consistent with major trends in macroeconomic research since the 1950s. Our analysis of
the Google Trends data lends additional support to the idea of the Great Recession’s impact on
reviving Keynes’s influence.
Although our contribution to the literature focuses on the comparative influence of
Schum-peter and Keynes measured by citations, our results have a wider significance in that they clearly
show the relevance of the history of economic thought and the ideas of particular economists to
the public at large. The Google Trends data show searches for Schumpeter and Keynes spiking
which policies to support as a response. As the keepers of these particular flames, economists
have a responsibility to articulate and pass on the lessons of the past. To that end, Dalton and
References
Aghion, P., U. Akcigit, and P. Howitt(2014): “What Do We Learn From Schumpeterian
Growth Theory?,” in P. Aghion and S. N. Durlauf, editors, Handbook of Economic Growth,
Volume 2, 515-563.
Dalton, J. T., and A. J. Logan (2018): “Teaching and Learning Schumpeter: A Dialogue
Between Professor and Student,” working paper.
Davis, W. L., B. Figgins, D. Hedengren, and D. B. Klein (2011): “Economics
Profes-sors’ Favorite Economic Thinkers, Journals, and Blogs (along with Party and Policy Views),”
Econ Journal Watch, 8(2), 126–146.
Diamond, Jr., A. M.(2007): “Thriving at Amazon: How Schumpeter Lives in Books Today,”
Econ Journal Watch, 4(3), 338–344.
(2009): “Schumpeter vs. Keynes: “In the Long Run Not All of Us Are Dead”,”Journal
of the History of Economic Thought, 31(4), 531–541.
Keynes, J. M. (1936): The General Theory of Employment, Interest, and Money. New York,
NY: Harcourt, Brace and Company.
Lucas, Jr., R. E.(1988): “On the Mechanics of Economic Development,”Journal of Monetary
Economics, 22(1), 3–42.
Romer, P. M.(1986): “Increasing Returns and Long-Run Growth,”Journal of Political
Econ-omy, 94(5), 1002–1037.
(1990): “Endogenous Technological Change,” Journal of Political Economy, 98(5),
S71–S102.
Skidelsky, R. (2009): Keynes: The Return of the Master. New York, NY: PublicAffairs.
Warsh, D. (2006): Knowledge and the Wealth of Nations: A Story of Economic Discovery.