Munich Personal RePEc Archive
Multi-dimensional poverty among adults
in Central America and gender
differences in the three I’s of poverty:
Applying inequality sensitive poverty
measures with ordinal variables
Espinoza-Delgado, José and Silber, Jacques
31 August 2018
Online at
https://mpra.ub.uni-muenchen.de/88750/
Multi-dimensional poverty among adults in Central America and gender differences in
the three I’s of poverty: Applying inequality sensitive poverty measures with ordinal
variables
By José Espinoza-Delgado
and Jacques Silber
August 2018
Abstract
The Alkire and Foster (2011) methodology, as the mainstream approach to the measurement of dimensional poverty in the developing world, is insensitive to inequality among the multi-dimensionally poor individuals and does not consider simultaneously the concepts of efficiency and distributive justice. Moreover, the vast majority of empirical indices of multi-dimensional poverty in the literature overlook intra-household inequalities, an issue that is crucial to a better understanding of gender inequalities, because they equate the poverty status of the household with the poverty status of all individuals in the household. Consequently, using the general framework proposed by Silber and Yalonetzky (2013) and Rippin’s ideas on multi-dimensional poverty measurement (2013, 2017), we propose in this paper to depart somehow from the mainstream approach and take an individual-based and inequality sensitive view of multi-dimensional poverty when only ordinal (dichotomized) variables are available. We use such an approach to estimate multi-dimensional poverty among individuals aged 18 and 59 years living in Guatemala, El Salvador, Honduras, Nicaragua, and Costa Rica, shedding thus some light on gender differences in poverty and inequality in those countries. Overall, we find that individuals living in Guatemala have the highest probability of being multi-dimensionally poor, followed by the ones from Nicaragua; people living in Costa Rica, by contrast, have by far the lowest probability of being poor. In the middle appears Honduras and El Salvador, Hondurans having a larger probability of being multi-dimensionally poor than the Salvadorians. Regarding the gender gaps, the overall estimates suggest that the incidence and the intensity of multi-dimensional poverty in Central America are higher among females; inequality, however, is somewhat higher among males.
JEL Codes: I3, I32, D1, D13, D6, D63, O5, O54
Keywords: multi-dimensional poverty measurement, inequality, gender inequality, Latin America, Central America
Previous versions of this paper were presented at the ZIF Summer School 2017, University of Bielefeld, and at the Goettingen Development Economics Seminars. We are grateful to participants in these academic events for helpful comments and discussions on the topic, especially to Achille Lemmi and Stephan Klasen. We would also like to thank Nicole Rippin for clarifications and useful discussions on the Correlation Sensitive Poverty Index.
Department of Economics, University of Goettingen, Platz der Göttinger Sieben 5, Blue Tower, Office 8.120. 37073 Goettingen, Germany. Phone: +49-551-39-21672, Fax: +49-551-39-7302, [email protected].
Department of Economics, Bar-Ilan University, Office 330; Building: 504, Ramat-Gan, 5290002 Israel,
1. Introduction
The removal of poverty remains one of the most important aims of economic policy in
many countries of the world (Chakravarty, 2018; Chakravarty & Lugo, 2016; Chakravarty &
Silber, 2008); it continues to be one of the greatest global challenges and is an essential
“requirement for sustainable development” (UN, 2017, p. 1). In consequence, given that there
is no meaningful development without the elimination of that source of unfreedom (Sen,
2000a), Goal 1 of the Sustainable Development Goals (SDGs) calls for ending “poverty in all
its forms everywhere” (UN, 2015, p. 15). In this context, specifying how poverty is
characterized, what its determinants are, and finding appropriate poverty measures become
crucial elements for the design and assessment of policies aimed at the alleviation of this
social problem (Ray, 1998).
As argued by Stiglitz, Sen, and Fitoussi (2009a), the well-being of a population is
multi-dimensional. Poverty therefore may be considered as a manifestation of the
insufficiency of accomplishments in different domains of well-being (Chakravarty, 2006,
2018; Chakravarty & Lugo, 2016). It is a multi-dimensional phenomenon characterized by
deprivations in multiple dimensions of the individuals’ well-being (Ferreira, 2011). As
observed by Sen (2000b, p. 18), “human lives are battered and diminished in all kinds of
different ways”. As a result, nowadays, the multi-dimensional nature of poverty enjoys a
widespread consensus (Chakravarty, 2018; Kakwani & Silber, 2008a; Silber & Yalonetzky,
2014; Stiglitz, Sen, & Fitoussi, 2009a, 2009b), grounded, mainly, on the capability approach
proposed by Sen (1985, 1992, 1997, 2000a, 2010), which is regarded as the most
comprehensive approach to grasp the concept of poverty (Thorbecke, 2008). Such a
consensus is reflected in Target 1.2 of the SDGs, which demands by 2030, the reduction “at
least by half of the proportion of men, women and children of all ages living in poverty in all
its dimensions according to national definitions” (UN, 2015, p. 15).
In this regard, multi-dimensional approaches to the measurement of poverty
1, as well
as multi-dimensional poverty indices, have become increasingly popular in recent years
(Duclos & Tiberti, 2016). Currently, the most influential and dominating methodology in
developing countries, particularly in Latin America and the Caribbean, is the counting
1
approach proposed by Alkire and Foster (2011) (AF hereafter). It is an axiomatic family of
multi-dimensional poverty measures that employs a “dual cutoff method” for the
identification of the poor (Alkire & Foster, 2011, p. 478), and it has been applied in a
considerable number of studies (Duclos & Tiberti, 2016)
2. The most famous application of
this approach is the household-based multi-dimensional poverty index or “global MPI”
(Alkire et al., 2015, p. 177). Developed originally by the Oxford Poverty and Human
Development Initiative (OPHI) in collaboration with the United Nations Development
Program (UNDP) (Alkire & Santos, 2010, 2014), the global MPI has been included in the
Human Development Report since 2010 (UNDP, 2010) and has become very popular
(Duclos & Tiberti, 2016, p. 696).
More recently, Duryea and Robles (2017), as part of the report “Social Pulse in Latin
America and the Caribbean 2017”, published by the Inter-American Development Bank
(IDB), and Santos and Villatoro (2018), who proposed a multi-dimensional poverty index for
Latin America (MPI-LA, hereafter), have also suggested adopting the AF method to estimate
household-based multi-dimensional poverty in Latin America and the Caribbean. Likewise,
several Governments, especially from Latin American countries, for instance Chile
(Ministerio de Desarrollo Social, 2016), Colombia (DANE-DIMPE, 2014), Costa Rica
(INEC, 2015), Ecuador (Castillo & Jácome, 2015), El Salvador (STPP &
MINEC-DIGESTYC, 2015), Honduras (SCGG-INE, 2016), Mexico (CONEVAL, 2011), and Panama
(MEF, 2017), have adopted such an approach to produce their official multi-dimensional
poverty measure.
The AF methodology has certainly the advantage of simplicity, flexibility, and clarity
when compared to other multi-dimensional approaches, which is indeed what makes it
extremely appealing (Silber, 2011; Thorbecke, 2011); it has also a number of attractive
properties (see Alkire & Foster, 2011; Alkire et al., 2015). Yet, this approach has also several
methodological shortcomings that have often been ignored in the literature (see, Duclos &
Tiberti, 2016). Let us focus on two of them, perhaps the most critical weaknesses of the
methodology.
Firstly, the identification method of the AF methodology assumes implicitly that up to
the second (intermediate) cutoff ( ), which is used to identify the multi-dimensionally poor
2
(Alkire & Foster, 2011), the variables (attributes) are “perfect substitutes”, whereas the same
variables are “perfect complements” from such a cutoff onwards (Rippin, 2017, p. 37), an
assumption difficult to justify theoretically. Choosing between substitutability and
complementarity between attributes when there are more than two of them is certainly not an
easy task. This issue, however, is of great significance within a dynamic framework and
cannot be ignored (Thorbecke, 2008), would it be only because of its important policy
implications (Silber, 2011; Thorbecke, 2011)
3.
Secondly, as emphasized by Rippin (2013, 2017), any index based on the AF
approach is completely insensitive to inequality among the multi-dimensionally poor,
particularly with ordinal or dichotomized variables (attributes), a serious shortcoming
according to Sen (1976, 1979). In addition, the AF approach does not satisfy the strongest as
well as the weakest form of the axiom of “Sensitivity to Inequality Increasing Switch (SIIS)”
(Rippin, 2013, p. 26), a property that is assumed to capture the interaction between allocation
efficiency and distributive justice (see, Sen, 1992)
4. For instance, an inequality increasing
switch that reduces the weighted deprivation score of the less multi-dimensionally poor
individual below the threshold will always lead to a reduction of the poverty rates, no
matter what the relationship between the variables (attributes) is (Rippin, 2017). Such a flaw
may lead to biased assessments of the extent of poverty and hence have an impact on social
policies, and targeting.
Another issue that has generally been ignored in the literature is that in the vast
majority of studies, empirical indices of multi-dimensional poverty have been computed at
the level of the household (Bessell, 2015; Chiappori, 2016; Pogge & Wisor, 2016). In other
words, these studies used the household as the unit of analysis to determine who is
multi-dimensionally poor and who is not, equating the poverty condition of the household with the
3 “For instance, for a poverty analysis in the dimensions of education and nutritional status of children, there are
production complementarities because better-nourished children learn better. If this complementarity is strong enough, it may overcome the usual ethical judgement that favors the multiply-deprived, so that overall poverty would decline by more if we were to transfer education from poorly nourished to the better nourished, despite the fact that it increases the correlation of the two measures of well-being. Similarly, one might argue that human capital should be granted to those with a higher survival probability (because these assets would vanish following their death). Increasing the correlation of deprivations, and increasing the incidence of multiple deprivations, would then be good for poverty reduction” (Duclos, Sahn, & Younger, 2006, p. 950).
4 The considerations behind SIIS have been clearly stated by Rippin (2017, p. 33-34): “Poverty measures can
poverty condition of all individuals belonging to the household (Espinoza-Delgado & Klasen,
2018). Such an assumption, however, disregards intra-household inequalities that are known
to exist
5, and it may also hide inequalities between different generations living in the
household (Atkinson, Cantillon, Marlier, & Nolan, 2002), leading thus to biased estimates of
poverty and inequality in society (Deaton, 1997; Espinoza-Delgado & Klasen, 2018;
Rodríguez, 2016). Given that the ultimate objective of poverty analysis is the welfare of
individuals (Chiappori, 2016) and that poverty is a characteristic of individuals, not
households (Deaton, 1997), limiting the empirical analysis to the household level “is simply
unacceptable” (Chiappori, 2016, p. 840).
It is also worth noting that a gender analysis cannot be conducted by using
household-based multi-dimensional poverty measures that are incapable of revealing gender differences
within the household since they are gender-blind (Bessell, 2015; Espinoza-Delgado &
Klasen, 2018; Pogge & Wisor, 2016). Gender equality, however, is an objective of global
development as well (ECLAC, 2016, 2018a), as required by Goal 5 of the SDGs (“Achieve
gender equality and empower all women and girls”) (UN, 2015, p. 14). Individual-based
poverty measures are therefore indispensable to track progress in reaching Goals 1 (especially
Target 1.2) and 5 of the SDGs.
This is why, adopting the general framework proposed by Silber and Yalonetzky
(2014)
6and Rippin’s methodology (2013, 2017), we propose in this paper to use an
inequality sensitive multi-dimensional poverty approach, with ordinal (dichotomized)
variables, that overcomes the problems discussed previously
7. The approach suggested is
based on a “fuzzy” identification function that specifies explicitly the kind of relationship
existing between the ordinal variables considered in the analysis, eliminating thus the
ambiguity of the AF approach. The class of multi-dimensional poverty measures that is
adopted has the advantage of taking into account efficiency and distributive justice
considerations (Rippin, 2013, 2017), and it can be decomposed into the three I’s of poverty,
incidence, intensity, and inequality (Jenkins & Lambert, 1997). We implement such an
approach by looking at poverty data in five Central American countries, namely Guatemala,
El Salvador, Honduras, Nicaragua, and Costa Rica. Note that the first four countries are
5
See, for instance, Asfaw, Klasen, & Lamanna, 2010; Bradshaw, 2002, 2013; Bradshaw, Chant, & Linneker, 2017a, 2017b; Chant, 2008; Klasen & Wink, 2002; 2003; Rodríguez, 2016.
6
Some of the ideas raised by Silber and Yalonetzky (2014) appear already in Yalonetzky (2012, 2014).
7
among the five multi-dimensionally poorest countries in Latin America and the Caribbean
(Duryea & Robles, 2017; Santos & Villatoro, 2018). Our approach allows us estimating
multi-dimensional poverty among adults in that region, shedding some light on gender
differences in multi-dimensional poverty and inequality, testing whether there are
discrepancies between these countries regarding the impact of gender on multi-dimensional
poverty and exploring the determinants of multi-dimensional poverty in Central America on
the basis of logit regression models.
As far as we know, there is no study of individual-based multi-dimensional poverty in
the literature similar to this. The rest of the paper is organized as follows. Section 2 explains
the framework proposed to measure multi-dimensional poverty; section 3 introduces the data
and justifies the dimensions, indicators, and deprivation cuttoffs, as well as the weighting
structure used; section 4 discusses the main results and displays the results of the logit
regression models while section 5 provides some concluding remarks.
2.
A framework for the measurement of multi-dimensional poverty
Notations and definitions:
Let
1, … ,
⊂
denote the set of
individuals, and let
1, … ,
⊂
represent the set of ordinal variables measuring various aspects of individual well-being.
Let
be the
attainments matrix, where
∈
represents the attainment
of the th individual for the th variable. In this matrix, each row vector
., … ,
gives the achievements of the th individual, while each column vector
., … ,
provides the distribution of the th variable across the population. Let
, … ,
be a
row vector defining the variable-specific deprivation thresholds and
, … ,
the
vector of variable-specific weights with
0 ∀ ∈ 1,
and
∑
1
. Finally
denotes the real-valued scalar cutoff, with
0
1
.
k
is the minimal deprivation score an
individual needs to have in order to be considered as multi-dimensionally poor (“the poverty
cutoff”) (Alkire & Foster, 2011, p. 478).
2.1.
The individual multi-dimensional poverty function
The construction of the individual multi-dimensional poverty function entails two
deprived by comparing the individual’s achievement
with the deprivation threshold
. If
, individual is said to be deprived in variable . From the
matrix and the
vector, a dichotomous deprivation matrix
is obtained, such that
1
if
,
and
0
if
, for all
1, … ,
and for
1, … ,
. A weighted deprivations score
is then computed for each individual as the weighted sum of the deprivations suffered
by each of them. This score is called the “(real-valued) counting function” (Silber &
Yalonetzky, 2014, p. 11) and represents the final output of the first step. Formally, the
individual’s counting function is defined as
; ;
∑
≡ ∑
.
When individual does not suffer from any deprivation,
0
; conversely, when the th
individual is deprived in all the variables considered in the analysis
1
.
2.1.1. The identification function
The focus of the second stage of the analysis is on the identification of the
multi-dimensionally poor individuals. Here the counting function
is compared with the poverty
cutoff . If
, then the individual is considered as multi-dimensionally poor. The
choice of is evidently arbitrary and Alkire and Foster (2011) propose to use an
“intermediate cutoff” that lies somewhere between 0 and 1 (p. 478). Let
; ; ;
be
the identification function suggested by Alkire and Foster (2011), then:
; ; ;
1
0
(1)
Note that
is a discrete identification function; consequently, it violates the
continuity axiom: A small change in or in can change from 0 to 1 or from 1 to 0 the
contribution of any individual to the overall multi-dimensional poverty (Duclos & Tiberti,
2016). Note also that the
comprises as particular cases the two conventional methods of
identification introduced by Atkinson (2003) in the context of multi-dimensional poverty
analysis: the union and the intersection approaches. Under the union approach, individuals
are considered to be multi-dimensionally poor if they suffer from deprivation in at least one
variable: In other words,
min
, , … ,
. Such an approach leads clearly to a high
proportion of multi-dimensionally poor people but it has been widely adopted in the literature
on multi-dimensional poverty (Silber & Yalonetzky, 2014). The other extreme case is that of
multi-dimensionally poor if they are deprived in each variable
1
. This approach considers as
poor only “the most indigent” individuals in the society and yields evidently the lowest
poverty rate. These two approaches to identification are extreme cases based on a strong
assumption regarding the relationship between the variables (attributes). The former assumes
that the variables are perfect complements while the latter supposes that the variables are
perfect substitutes (Rippin, 2013, 2017)
8. This is why Alkire and Foster (2011, p. 478)
proposed an intermediate approach as “a natural alternative” to the two extreme methods of
identification. However, as emphasized by Rippin (2013, 2017), the AF approach not only
implies an arbitrary selection of the intermediate poverty cutoff ; it also implicitly supposes
that up to the variables are perfect substitutes while beyond they are perfect
complements, a questionable and rather hard to justify assumption.
In this paper, we prefer to adopt the “fuzzy” identification function, suggested by
Rippin (2013, 2017), that makes explicit the relationship between the variables (attributes)
considered in the analysis and does not introduce any kind of discontinuities when identifying
the multi-dimensionally poor individuals. Let be an indicator of inequality aversion, a
parameter describing the relationship between the attributes (Rippin, 2013, p. 27). The fuzzy
identification function is then defined as
; ; ;
(2)
where
satisfies the conditions of being decreasing in and of having a
non-decreasing (non-increasing) marginal if the variables are assumed to be substitutes
(complements) (Rippin, 2013, 2017)
9.
8 Here, the concepts of “substitutability” and “complementarity” follow the Auspitz-Lieben-Edgeworth-Pareto
(ALEP) definition and not the well-known approach proposed by Hicks and Allen (1934a, 1934b) (Silber, 2007, p. 59). The ALEP definition considers that two attributes are substitutes (complements) if their second cross-partial derivatives are larger (less) than zero and independent if they are equal to zero (Rippin, 2013, 2017). Intuitively, on the basis of the ALEP definition, if two attributes are substitutes, poverty will decrease less with a rise in attribute 1 for individuals with larger quantities of attribute 2. The contrary is evidently true when the two attributes are supposed to be complements (Silber, 2007). For instance, assuming that income and education are substitutes, the reduction in poverty due to a unit increase in income is less important for individuals who have an educational level close to the education deprivation cutoff than for individuals with very low education. Conversely, the drop in poverty would be more substantial for individuals with a larger level of education if income and education were considered to be complements (Bourguignon & Chakravarty, 2003).
9 “A function has a non-decreasing marginal if 1 1 whenever
Therefore, instead of dichotomizing the distribution of the weighted deprivations
scores, as proposed by Alkire and Foster (2011), the fuzzy identification function
distinguishes between the multi-dimensionally non-poor, on one hand, and “different degrees
of poverty severity”, on the other hand (Rippin, 2017, p. 42). Hence, it is considered to be
fuzzy, because unless
1
or
0
, each individual is “somewhat” multi-dimensionally
poor (Silber & Yalonetzky, 2014, p. 13): Individuals suffer different degrees of
multi-dimensional poverty severity, depending on i) the number of variables (attributes) in which
they are simultaneously deprived, and ii) the type of relationship that exists among these
variables. The shape of the function depends on the value of . If is between 0 and 1, the
curve describing has a concave shape, while if is greater than 1, this curve has a convex
shape. The choice between these two options depends on whether it is assumed that the
variables (attributes) are substitutes or complements. If they are considered as complements,
the increase in poverty severity is marginally decreasing in as the loss in even one variable
(attribute) can hardly be compensated (Rippin, 2013). In other words, as soon as an
individual suffers from deprivation in one variable, he/she must suffer from some degree of
poverty. If the variables are perfect complements, there is no compensation, and we obtain
the union case; but if they are imperfect complements, we get the more general case
approximated by a concave identification function. If, on the contrary, the variables are
substitutes, there is compensation, and then the shortage in only one variable leads to a rather
low degree of poverty severity as other variables can compensate for the deprivation.
However, overall, the compensation capacity decreases as the number of deprivation
increases; consequently, the poverty severity level is marginally increasing in . Therefore, if
they are imperfect substitutes, we obtain the more general case of a convex identification
function; but, if they are perfect substitutes, there is full compensation: as long as an
individual is not deprived in all variables his/her overall score will be equal to zero, which
corresponds to the intersection case discussed previously.
Selecting a particular relationship between the variables is certainly not a simple task.
There does not seem to be an algorithm by which we can ascertain the degree of
substitutability and/or complementarity between them. It is hard to determine such degree on
a pair-wise basis, a fortiori among combinations of variables taken 3, 4, up to at a time.
Furthermore, the variables may be substitutes in the short term but complements in the long
term (Thorbecke, 2008). This issue may have very significant policy implications (Silber,
2011, p. 486). This why in this paper, we assume different degrees of substitutability
1.25, 1.50, 1.75, 2.00
and complementarity
0.25, 0.50, 0.75
among the variables
when estimating multi-dimensional poverty in Central America. We then test the robustness
of our conclusions to these assumptions.
2.1.2. The function defining the multi-dimensional poverty breadth
In line with the poverty measurement literature, the individual multi-dimensional
poverty function must not only identify the multi-dimensionally poor people but also capture
the intensity of the multi-dimensional poverty experience (Silber & Yalonetzky, 2014).
However, since with ordinal (binary or dichotomized) variables the multi-dimensional
poverty depth cannot be estimated as no poverty gap between the individual achievement in a
given variable and the deprivation threshold for this variable may be calculated (Bérenger,
2017), to consider the poverty breadth we make the individual multi-dimensional poverty
function depend on the number of deprivations. The individual multi-dimensional poverty
function is then defined as the product of the identification function introduced previously
and a function that captures the breadth of multi-dimensional poverty. Let
; ;
be the
function that measures the dimensional poverty breadth. The individual
multi-dimensional poverty is then expressed as
; ; ;
; ; ;
; ;
(3)
where
; ;
is a real-valued function that maps into the interval
0,1
. This function
; ;
is assumed not to rise when any achievement (e.g.,
) increases and it is strictly
decreasing when a rise,
0
, in a given variable cancels the deprivation in this variable, i.e.,
(Silber & Yalonetzky, 2014). As multi-dimensional poverty breadth
function we adopted the one proposed by Alkire and Foster (2011):
; ;
(4)
2.2.
The social multi-dimensional poverty function
In the last stage of the analysis we derive a social multi-dimensional poverty function
by aggregating the individual multi-dimensional poverty functions. In the literature there are
multi-dimensional poverty function as the average of the individual poverty functions (Silber &
Yalonetzky, 2014). Let
; ; ;
be the social multi-dimensional poverty function. Then
; ; ;
∑
∑
; ; ;
∑
∑
; ; ;
; ;
(5)
which leads to the “Multi-dimensional Correlation-Sensitive Class of Poverty Measures” with
ordinal (dichotomized) variables proposed by Rippin (2017, p. 46)
∑
(6)
This class of multi-dimensional poverty indices satisfies the following axioms: Anonymity
(AN), Monotonicity (MN), Principle of Population (PP), Strong Focus (SF), Normalization
(NM), Subgroup Decomposability (SD), Factor Decomposability (FD), and Sensitivity to
Inequality Increasing Switches (SIIS) (Rippin, 2013, 2017). It is the only one in the literature
that satisfies not only SD and FD but also SIIS (Bérenger, 2016, 2017; Rippin, 2013, 2017).
Following Bérenger (2017, p. 148), the Multi-dimensional Correlation-Sensitive Class
of Poverty Measures may be decomposed into the three I’s of multi-dimensional poverty
(Jenkins & Lambert, 1997):
1
1
1
∑1
(7.1)
1
1
1
(7.2)
where
⁄
(the dimensional headcount ratio) measures the incidence of
multi-dimensional poverty,
∑
⁄
(“the average deprivation score across the poor”)
(Alkire et al., 2015, p. 157) the multi-dimensional poverty intensity, and
(“the
generalized entropy inequality index among the poor”) (Bérenger, 2017, p. 148) the
inequality among the multi-dimensionally poor people.
It is worth mentioning that the adjusted headcount ratio (
) proposed by Alkire and
Foster (2011) and adopted by the global MPI (Alkire & Santos, 2014; UNDP, 2010), and the
MPI-LA (Santos & Villatoro, 2018), as well as, officially, by several countries in Central
the incidence (
and the intensity (
of multi-dimensional poverty. As a consequence, the
measure
can also be expressed as
1
1
1
(8)
Therefore,
1
1
1
represents substantive
information that measures based on
disregard. Such complementary information is
particularly important in the context of the SDGs, and its targets, and for gender inequality
assessments. In other words, the neglect of such information may lead to wrong conclusions
concerning multi-dimensional poverty and its trend in a country or region, especially when
inequality is an important issue.
3.
Data sources, deprivation dimensions, indicators and cut-offs, and weighting
structure
3.1. Data
The data used in this paper are drawn from the most recent available household
surveys, in the Central American countries under scrutiny, that have been conducted by the
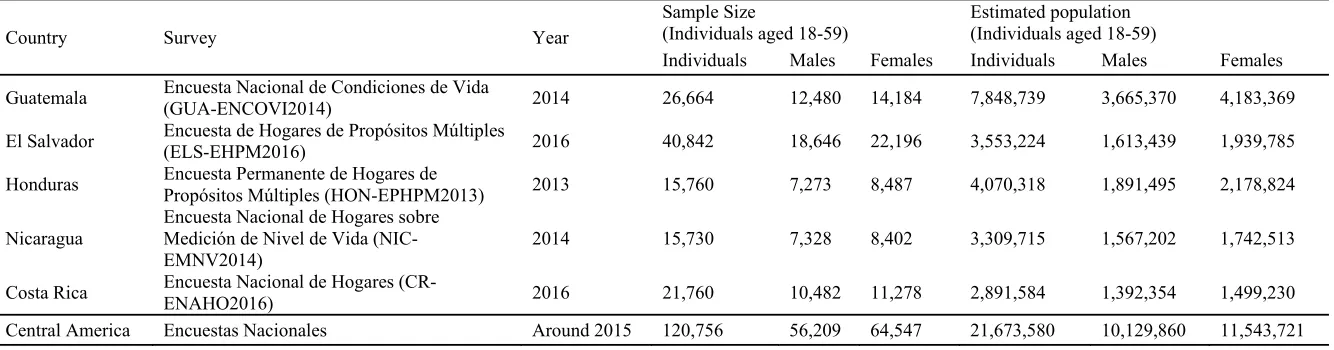
corresponding National Institutes of Statistics. Table 1 shows for each country the name and
the year of the survey, which is nationally representative, the sample size, and the estimated
population size, computed by employing the sample weights of the survey. In our assessment,
the unit of analysis is the individual. These individuals are between 18 and 59 years old, were
considered as household members and completed a full interview. The age limits selected
follow the definition of children in the Convention on the Rights of the Child: “Every human
being below the age of eighteen years” (UN, 1989, p. 2) and the general practice in Latin
America and the Caribbean to define “older people” as those individuals aged 60 or more
(Gasparini et al., 2010, p. 177). In other words in this paper, we focus on the adult members
of the households, males and females, of working and reproductive ages, when “gender
tensions” are the largest (ECLAC, 2016, p. 127). It is worth mentioning that in Central
America, this age group represents more than 50% of the population (from a low of 47.7% in
13 Table 1. Surveys used, samples size, and estimated population.
Source: Authors' estimates based on GUA-ENCOVI2014, ELS-EHPM2016, HON-EPHPM2013, NIC-EMNV2014, and CR-ENAHO2016.
Country Survey Year
Sample Size
(Individuals aged 18-59)
Estimated population (Individuals aged 18-59)
Individuals Males Females Individuals Males Females
Guatemala Encuesta Nacional de Condiciones de Vida
(GUA-ENCOVI2014) 2014 26,664 12,480 14,184 7,848,739 3,665,370 4,183,369 El Salvador Encuesta de Hogares de Propósitos Múltiples
(ELS-EHPM2016) 2016 40,842 18,646 22,196 3,553,224 1,613,439 1,939,785 Honduras Encuesta Permanente de Hogares de
Propósitos Múltiples (HON-EPHPM2013) 2013 15,760 7,273 8,487 4,070,318 1,891,495 2,178,824
Nicaragua
Encuesta Nacional de Hogares sobre Medición de Nivel de Vida (NIC-EMNV2014)
2014 15,730 7,328 8,402 3,309,715 1,567,202 1,742,513
Costa Rica Encuesta Nacional de Hogares
3.2.
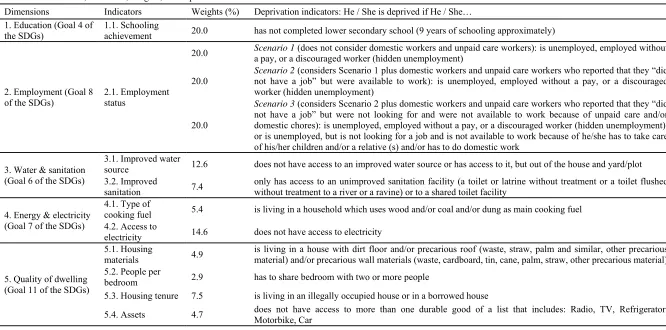
Dimensions, indicators, and deprivation cut-offs
Overall, the choice of the dimensions and indicators for the individual-based
multi-dimensional poverty index is grounded on the Sustainable Development Goals (SDGs) and
targets (UN, 2015, 2017) to be considered as a kind of normative framework with
international consensus, and it is strongly conditioned by the availability of comparable
(individual) data across the countries covered in our study. The five deprivation dimensions
selected (education, employment, water and sanitation, energy and electricity, and the quality
of the dwelling) are certainly among the most significant aspects of an individual well-being
(Stiglitz et al., 2009a, 2009b). These dimensions may also be considered as “relevant for
gender inequality analysis” (Robeyns, 2003, p. 76). The specific indicators chosen for each of
the five dimensions and the corresponding deprivation cut-offs are presented in Table 2.
3.2.1. Education
There are quite a few reasons why education should be included in a
multi-dimensional poverty analysis. As Drèze and Sen (2002, p. 38) observed, education can be
considered to be valuable to the freedom of an individual in distinct ways, it has instrumental
and intrinsic importance (Robeyns, 2006). Educational accomplishments are not only
valuable achievements in themselves but also contribute, for instance, to an individuals’
empowerment and play a distributive role, which can help reducing “gender-based
inequalities” (Drèze and Sen, 2002, p. 39). In the context of the SDGs and targets, the
inclusion of education is justified by Goal 4, and its targets, that calls for ensuring “inclusive
and equitable quality education and promote lifelong learning opportunities for all” (UN,
2015, p. 17).
The ordinal educational indicator selected (schooling achievement) takes into account
the information available on the schooling level attained by the individuals to assess whether
they suffer from deprivation in education. We set the lower secondary school as a normative
target, which is approximately equivalent to 9 years of formal schooling so that an individual
who did not complete this educational level will be considered as educationally deprived. It is
worth mentioning that our deprivation threshold is more demanding than the one proposed by
the global-MPI (“5 years of education”) (Alkire & Santos, 2010, p. 254) and the official
index of Honduras, which uses “6 years of schooling” as deprivation threshold for individuals
one required by the MPI-LA for people aged between 20 and 59 years (Santos & Villatoro,
2018, p. 59) and in tune with what is set by the official MPI of Costa Rica for people aged
between 36 and 57 years (INEC, 2015, p. 39) and of El Salvador for people between 18 and
64 years of age (STPP & MINEC-DIGESTYC, 2015, p. 35).
3.2.2. Employment
The inclusion of employment as a dimension of multi-dimensional poverty in Central
America is based on its instrumental significance and considerable intrinsic importance
(Atkinson, 2002; Klasen, 2000; Sen, 2000; Stiglitz et al., 2009a, 2009b). The lack of
employment (to be unemployed) involves costs for people, that go beyond the loss of income
(Atkinson, 2000; Stiglitz et al., 2009a, 2009b). It causes deprivations of other kinds that have
serious effects on individuals’ lives: “psychological harm, loss of work motivation, skill and
self-confidence, increase in ailments and morbidity (and even mortality rates), disruption of
family relations and social life, hardening of social exclusion and accentuation of racial
tensions and gender asymmetries” (Sen, 2000, p. 94). In addition, labor market participation
is considered to be “an important means of social integration” (Atkinson et al., 2002, p. 137).
The SDGs and targets call for promoting “full and productive employment and decent work
for all” (Goal 8) (UN, 2015, p. 19), which is crucial in Central America countries, where the
share of informal employment in total employment is estimated to be higher than 70%, with
the exception of Costa Rica (ILO, 2018, p. 18).
The ordinal indicator we defined takes into account the employment status of the
individual but also unpaid care work and domestic work. This is in line with target 5.4 of the
SDGs: “Recognize and value unpaid care and domestic work through the provision of public
services, infrastructure and social protection policies and the promotion of shared
responsibility within the household and the family as nationally appropriate” (UN, 2015, p.
18). The indicator (employment status) distinguishes two groups of individuals, among those
who reported that they did not work the week preceding the survey: 1) individuals whose
main activity was to do domestic work and/or unpaid care work (hereafter unpaid care and
domestic workers), and 2) individuals who were not involved in those activities. We consider
three scenarios in order to shed some light on the consequences, in terms of
multi-dimensional poverty and gender differences in poverty, of incorporating into the analysis
unpaid care work and domestic work which are “commonly left out of policy agendas”
16 Table 2. Dimensions, indicators, weights, and deprivation cut-offs
Dimensions Indicators Weights (%) Deprivation indicators: He / She is deprived if He / She… 1. Education (Goal 4 of
the SDGs)
1.1. Schooling
achievement 20.0 has not completed lower secondary school (9 years of schooling approximately)
2. Employment (Goal 8 of the SDGs)
2.1. Employment status
20.0 Scenario 1 (does not consider domestic workers and unpaid care workers): is unemployed, employed without a pay, or a discouraged worker (hidden unemployment)
20.0
Scenario 2 (considers Scenario 1 plus domestic workers and unpaid care workers who reported that they “did not have a job” but were available to work): is unemployed, employed without a pay, or a discouraged worker (hidden unemployment)
20.0
Scenario 3 (considers Scenario 2 plus domestic workers and unpaid care workers who reported that they “did not have a job” but were not looking for and were not available to work because of unpaid care and/or domestic chores): is unemployed, employed without a pay, or a discouraged worker (hidden unemployment), or is unemployed, but is not looking for a job and is not available to work because of he/she has to take care of his/her children and/or a relative (s) and/or has to do domestic work
3. Water & sanitation (Goal 6 of the SDGs)
3.1. Improved water
source 12.6 does not have access to an improved water source or has access to it, but out of the house and yard/plot 3.2. Improved
sanitation 7.4
only has access to an unimproved sanitation facility (a toilet or latrine without treatment or a toilet flushed without treatment to a river or a ravine) or to a shared toilet facility
4. Energy & electricity (Goal 7 of the SDGs)
4.1. Type of
cooking fuel 5.4 is living in a household which uses wood and/or coal and/or dung as main cooking fuel 4.2. Access to
electricity 14.6 does not have access to electricity
5. Quality of dwelling (Goal 11 of the SDGs)
5.1. Housing
materials 4.9
is living in a house with dirt floor and/or precarious roof (waste, straw, palm and similar, other precarious material) and/or precarious wall materials (waste, cardboard, tin, cane, palm, straw, other precarious material) 5.2. People per
bedroom 2.9 has to share bedroom with two or more people
5.3. Housing tenure 7.5 is living in an illegally occupied house or in a borrowed house
In the first scenario, deprivation is assumed to concern only individuals from the
second group. These individuals are assumed to be deprived in employment if they are (i)
unemployed (openly unemployed), (ii) employed without a pay, or (iii) discouraged workers
(hidden unemployment). This first scenario considers therefore the first group as
“non-deprived” in employment. The second scenario makes the same assumption as scenario 1 for
the second group. But it also includes those individuals in the first group who reported not to
have a job but were available to work. Finally, the third scenario identifies as deprived in
employment the same individuals as those considered as such in the second scenario. But it
also includes as deprived individuals those whose activity is unpaid care and domestic work
and who reported that they were not looking for a job and were not available to work, due to
the fact that they “had” to do those activities. Here we make the strong assumption that
unpaid care work and domestic work are mandatory activities for the individual in the
household, but that might not be true (Robeyns, 2003).
3.2.3. Water & sanitation
Water and sanitation are also of considerable instrumental and intrinsic importance
(Klasen, 2000; Mara & Evans, 2018; Sorenson, Morssink, & Campos, 2011). An “adequate
sanitation, together with good hygiene and safe water, are fundamental to good health and to
social and economic development” (Mara, Lane, Scott, & Trouba, 2010, p. 1). This
dimension includes two indicators, improved water source and improved sanitation, which
can be assumed to be related to Goal 6 and its targets of the SDGs: “Ensure availability and
sustainable management of water and sanitation for all” (UN, 2015, p. 18). An individual is
hence considered to be water deprived if he/she does not have access to drinking water in
his/her house or yard/plot and he/she is deemed to be deprived in sanitation if he/she only has
access to unimproved sanitation facility or to a shared toilet one. Both deprivation cut-offs
are similar to the ones used by Costa Rica and El Salvador’s official MPIs (INE, 2015, p. 39;
STPP & MINEC-DIGESTYC, 2015, p. 36).
3.2.4. Energy & electricity
The dimension energy and electricity emphasizes Goal 7 of the SDGs, which
demands ensuring “access to affordable, reliable, sustainable and modern energy for all”
(UN, 2015, p. 19). This dimension is measured via two indicators named type of cooking fuel
and instrumental significance (Klasen, 2000; Santos, 2013). For instance, indoor air pollution
has adverse effects on health and can increase the risk of many diseases and death (Duflo,
Greenstone, & Hanna, 2008a, 2008b, 2016; Kaplan, 2010). It has also been considered to be
“a global health threat, particularly for women and young children” (Duflo, et al., 2008a, p.
7). Having access to electricity, on the other hand, can help improving the living conditions
of individuals by allowing them to be independent from sunlight as well as by contributing to
a clean environment (Santos, 2013). Accordingly, individuals are considered to be energy
deprived if they use wood and/or coal and/or dung as main cooking fuel and deprived in
electricity if they do not have access to such facility.
3.2.5. Quality of dwelling
Finally, the individual-based multi-dimensional poverty index includes also a
dimension that accounts for the quality of dwelling, an important well-being dimension for
instrumental and intrinsic reasons (Klasen, 2000; Shaw, 2004), which occupies “a central
position in poverty research and policy” (Atkinson et al., 2002, p. 158). The dwelling quality
can affect directly or indirectly the individuals’ health and be an important factor (e.g.,
overcrowding) in the transmission of diseases (Elender, Bentham, & Langford, 1998). This
dimension is included in Goal 11 of the SDGs: “Make cities and human settlements inclusive,
safe, resilient and sustainable” (UN, 2015, p. 21). To measure the quality of dwelling, we use
four indicators: Housing materials, people per bedroom, housing tenure, and assets; the first
three indicators are used by the MPI-LA to assess the housing dimension (Santos and
Villatoro, 2018, p. 59), while the fourth one is similar to the asset indicators employed by the
global-MPI (Alkire & Santos, 2010, p. 254). The corresponding deprivation cut-offs are
specified in Table 2 and are the same as those used by the indices mentioned previously.
Note that the indicators included in the last three dimensions are considered to be
non-rival and non-excludable goods, that is, they are regarded as public goods, accessible equally
to every individual within the household (Espinoza-Delgado & Klasen, 2018; Klasen &
3.3. Weighting
structure
The selection of a weighting structure implies a “value judgment” on the tradeoffs
between the dimensions (indicators) (Decancq & Lugo, 2013, p. 9). Such a weighting scheme
represents another normative decision to be taken when estimating a multi-dimensional
poverty index (Alkire et al., 2015). We opt for using a hybrid weighting scheme that
combines a normative approach (among dimensions) with a data-driven one (among
indicators). We attach an equal weight to each of the five dimensions (20%), but for a given
dimension, following Cerioli and Zani (1990), the weight of an indicator
j
is defined as
0.20
∑(9)
where denotes the relative frequency of individuals deprived in the th indicator (in this
dimension), considering Central America as a whole. It can be observed that the weight (
)
assigned to an indicator for a given deprivation dimension is an inverse function of the
frequency of the deprivation related to this indicator. In other words, the lower the frequency
of deprivation for a given indicator, the larger the weight given to this indicator (Deutsch &
Silber, 2005). Such a weighting scheme implies therefore that deprivation is essentially a
relative matter (Cerioli & Zani, 1990).
4. Results
4.1.
Aggregate deprivation by indicator
Before estimating multi-dimensional poverty among adults in Central America, we
conduct a “dashboard” approach in order to know the average degree of deprivation in the
population according to the deprivation threshold defined for each of the ten indicators
included in our analysis (see Table 2) (Ravallion, 2011, p. 236). Figure 1 presents, in the
form of bar graphs, estimates of the percentage of adults deprived in each indicator, “the
uncensored headcount ratio” (Alkire et al., 2015, p. 167), for Central America as a whole and
for Guatemala, El Salvador, Honduras, Nicaragua, and Costa Rica. The confidence intervals
at 95% are shown in Table A1 in Appendix. Overall, the results show that Central America
people per bedroom, and sanitation); but, at the same time, it has made good progress in
[image:21.612.118.495.119.426.2]reducing deprivation in some others (e.g., housing tenure and electricity).
Fig. 1. Percentage of individuals aged between 18 and 59 years deprived in several indicators.
Source: Authors’ estimates based on GUA-ENCOVI2014, ELS-EHPM2016, HON-EPHPM2013, NIC-EMNV2014, and CR-ENAHO2016.
Notes: Employ.S1: Employment, scenario 1; Employ.S2: Employment, scenario 2; Employ.S3: Employment, scenario 3. In the case of El Salvador, the survey (ELS-EHPM2016) does not provide the information needed to determine whether the individuals considered as “unpaid care and domestic workers” are available to work or are not; accordingly, the deprivation rate in employment is the same under scenarios 2 and 3 (28.9%).
Figure 1 reveals that education is the biggest challenge for Central America. Almost
six in ten Central American adults have not yet achieved the lower secondary school level
(approximately 9 years of schooling), which limits dramatically their possibilities to get
better jobs and have better lives (ECLAC, 2015, 2016, 2018a, 2018b) and, overall, affects
negatively their individual and communal empowerment (Trommlerová, Klasen, & Leßmann,
2015). The second major challenge for the region is to continue fostering the use of clean
energy for cooking. This is so because approximately five out of ten Central American adults
remain directly or indirectly exposed to indoor air pollution from cooking fuels, that may
induce respiratory problems and eventually chronic illnesses, if not death (Duflo et al., 2008a,
2008b, 2016; Gall, Carter, Earnest, & Stephens, 2013; ECLAC, 2017). According to Figure
estimated that more than four in ten Central Americans aged between 18 and 59 years
(approx. 9.3 million people) share the bedroom with two or more people, and to increase the
provision of improved sanitation facilities. Four out of ten adults do not have access to such
facilities, and if they have, they share them with people who belong to another household.
Note that Figure 1 shows that deprivation in employment ranges from 10.2% (employment
S1, first scenario) to 31.7% (employment S3, third scenario), which means that in Central
America, the percentage of adults who “do not have a paid job” but are involved in unpaid
care work and/or domestic work is estimated to be 21.5% (approximately 4.7 million people).
Looking at country specific results, we observe that Guatemala, Honduras, and
Nicaragua are the countries with the highest deprivation rates (above 55%) in education.
These findings are consistent with the recent work by Duryea and Robles (2017). They
suggested (p. 20), on the base of the microdata of the 2012 and 2014 Latinobarómetro
(LAPOP), that, as far as people aged between 25 and 65 years are concerned, these countries
have the lowest average number of years of schooling (below 7.5 years) in Central America
and, even, in Latin America and the Caribbean. Guatemala exhibits, on the other hand, the
largest percentage of adults not having a paid job but doing unpaid care work and/or domestic
work (28.6%), followed by El Salvador and Nicaragua (19.7%). Concerning the other
dimensions and the corresponding indicators, excluding the case of housing tenure,
Guatemala (for sanitation, energy, electricity, and assets) and Nicaragua (for water, housing,
and people per bedroom) have the greatest deprivation rates while Costa Rica has the lowest
ones. Note that Costa Rica is close to eliminating deprivation in water, electricity, housing,
and assets. One may then argue that for this country, a relative, rather than an absolute,
approach to defining deprivation would be more relevant.
4.2.
Estimating multi-dimensional poverty among adults
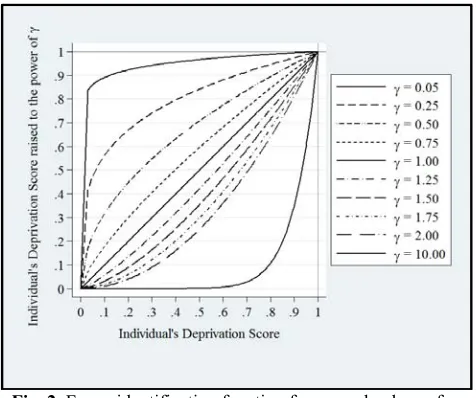
We firstly illustrate empirically how the fuzzy identification function described in
Section 2 performs, considering Central America as a whole and only the first deprivation
cutoff for employment (the first scenario). Figure 2 draws such function assuming different
levels of “inequality aversion” (Rippin, 2013, p. 28), that is, using diverse values of : from
0.05 to 10.0. The solid curves both at the top and at the bottom of the figure approximate the
substitutes (
10.00
), respectively; the solid line in the middle (the 45
odegree line)
[image:23.612.188.426.119.318.2]assumes, in turn, that the attributes are independent (
1.00
).
Fig. 2. Fuzzy identification function for several values of γ.
Source: Authors' estimates based on GUA-ENCOVI2014, ELS-EHPM2016, HON-EPHPM2013, NIC-EMNV2014, and CR-ENAHO2016.
Figure 2 makes clear that the marginal increase in an individual’s poverty severity is
larger, the lower the substitutability between indicators (moving from
10.00
to
0.05
), and that an individual’s poverty level is higher, the harder the compensation of
deprivation in one attribute. The degree of poverty of individuals depends thus not only on
their weighted deprivation scores but also on the way in which these deprivations are
correlated (Rippin, 2013, 2017). This is an important issue that has been overlooked by the
vast majority of empirical works concerned with multi-dimensional poverty analysis, despite
the fact that “it may have very important policy implications” (Silber, 2011, p. 479). As a
result, multi-dimensional poverty in society as a whole depends also on the degree of
inequality aversion adopted and its estimate is sensitive to such an assumption. Therefore,
since we do not know any algorithm through which we can accurately determine the degree
of “inequality aversion”, we propose, in this paper, to use a battery of measures to assess
multi-dimensional poverty, as opposed to employing a specific one.
The overall estimates of multi-dimensional poverty among adults in Central America
as a region, as well as in Guatemala, El Salvador, Honduras, Nicaragua, and Costa Rica,
considering the three scenarios discussed in Table 2 (three deprivation cutoffs for
estimates and their bootstrapped confidence intervals at 95% are presented in Table A2 in
[image:24.612.95.522.119.311.2]Appendix.
Fig. 3. Estimates of overall multi-dimensional poverty in Central America (CA) as a whole and in Guatemala (GUA), El Salvador (ELS), Honduras (HON), Nicaragua (NIC), and Costa Rica (CR), considering three scenarios and several degrees of inequality aversion (γ).
Source: Authors' estimates based on GUA-ENCOVI2014, ELS-EHPM2016, HON-EPHPM2013, NIC-EMNV2014, and CR-ENAHO2016.
Note: In the case of El Salvador, the multi-dimensional poverty estimates corresponding to the second and third scenarios are the same, as the deprivation rates in employment are identical. This is because the survey (ELS-EHPM2016) does not provide the information needed to determine whether the individuals considered as “unpaid care and domestic workers” were available to work or were not (see Table 2).
Figure 3 shows that, regardless of the scenario adopted, multi-dimensional poverty
among adults in Central America, as well as in the countries included in the analysis,
decreases as increases: The estimated multi-dimensional poverty is lower, the higher the
degree of inequality aversion (or substitutability among the indicators) (Rippin, 2013, 2017).
This is in line with our previous discussion. The largest estimates of multi-dimensional
poverty are obtained when the indicators are assumed to be perfect complements (
0
),
that is, when a union approach is applied to identify the multi-dimensionally poor adults. In
this particular case, our estimates are identical to those obtained when using the adjusted
headcount ratio (
index) proposed by Alkire and Foster (2011) (see Section 2). Note also
that each of the resulting curves moves upwards as the threshold used to determine
deprivation in employment becomes more demanding (from the first scenario to the third
one). In other words multi-dimensional poverty rises when including unpaid care work and
domestic work into the analysis. Figure 3 suggests that multi-dimensional poverty among
adults is highest in Guatemala, followed by Nicaragua, except under the first scenario when
γ
of Nicaragua from above; see also Table A2 in Appendix), and, by contrast, it is the lowest in
Costa Rica. Honduras and El Salvador appear in the middle but below the regional averages
(CA curve). Note also that under the third scenario, the differences in multi-dimensional
poverty between Guatemala and Nicaragua become more substantial than the ones observed
under the other scenarios, because Guatemala has a larger percentage of unemployed adults
who do unpaid care work and/or domestic work than Nicaragua. In general, the resulting
multi-dimensional poverty ranking is quite similar to the one suggested by recent empirical
evidence on Latin America and the Caribbean region, which is grounded on household-based
measures (see, e.g., Santos & Villatoro, 2018, p. 75; Duryea & Robles, 2017, p. 165);
therefore, it seems to be a robust finding.
To obtain a more revealing picture of the estimated multi-dimensional poverty among
adults and its distribution that considers also Goal 10 of the SDGs (“Reduce inequality within
and among countries”) (UN, 2015, p. 21), we computed the average multi-dimensional
poverty of adults in each percentile. We then ranked these adults by decreasing values of their
individual multi-dimensional poverty function, and drew a curve on the base of these 100
“observations”. We followed here the idea of the three “I”s of poverty curve proposed by
Jenkins and Lambert (1997). Figures 4, 5, and 6 show the resulting curves for Central
America as a whole, as well as for Guatemala, El Salvador, Honduras, Nicaragua, and Costa
Rica, considering three representative levels of “inequality aversion” (0.50, 1.00, and 1.50)
and the three scenarios under analysis
10. For each curve, the overall estimated
multi-dimensional poverty among adults is given by the height of the curve (the vertical intercept at
the 100th percentile). The multi-dimensional poverty incidence is that percentile at which the
curve becomes horizontal, in other words, it is summarized by the length of the
non-horizontal section of the curve; and the inequality among the multi-dimensionally poor adults
is approximated by the concavity degree of the non-horizontal section of the curve.
10
Fig. 4. Cumulative multi-dimensional poverty among adults by population percentile, ordered from the poorest to the richest, in Central America as a whole and in Guatemala (GUA), El Salvador (ELS), Honduras (HON), Nicaragua (NIC), and Costa Rica (CR).
Source: Authors' estimates based on GUA-ENCOVI2014, ELS-EHPM2016, HON-EPHPM2013, NIC-EMNV2014, and CR-ENAHO2016.
Notes: In each case, the overall estimated multi-dimensional poverty (see Table A2 in Appendix) corresponds to the height of the curve: the vertical intercept at 100th percentile. The incidence of multi-dimensional poverty (the headcount ratio or the proportion of multi-dimensionally poor people) corresponds to the length of the non-horizontal section of the curve, that is, the percentile at which the curve becomes non-horizontal. For each country, we drew a vertical line at such a percentile (headcount ratio). The average multi-dimensional poverty among the poor is equal to the slope of the ray from (0, 0) to the point at which the vertical line intercept the curve. Inequality among the multi-dimensionally poor individuals is represented by the degree of concavity of the non-horizontal section of the curve (Jenkins & Lambert, 1997).
Fig. 5. Cumulative multi-dimensional poverty among adults by population percentile, ordered from the poorest to the richest, in Central America as a whole and in Guatemala (GUA), El Salvador (ELS), Honduras (HON), Nicaragua (NIC), and Costa Rica (CR).
Source: Authors' estimates based on GUA-ENCOVI2014, ELS-EHPM2016, HON-EPHPM2013, NIC-EMNV2014, and CR-ENAHO2016.
[image:26.612.97.522.403.571.2]Fig. 6. Cumulative multi-dimensional poverty among adults by population percentile, ordered from the poorest to the richest, in Central America as a whole and in Guatemala (GUA), El Salvador (ELS), Honduras (HON), Nicaragua (NIC), and Costa Rica (CR).
Source: Authors' estimates based on GUA-ENCOVI2014, ELS-EHPM2016, HON-EPHPM2013, NIC-EMNV2014, and CR-ENAHO2016.
Notes: In each case, the overall estimated multi-dimensional poverty (see Table A2 in Appendix) corresponds to the height of the curve: the vertical intercept at 100th percentile. The incidence of multi-dimensional poverty (the headcount ratio or the proportion of multi-dimensionally poor people) corresponds to the length of the non-horizontal section of the curve, that is, the percentile at which the curve becomes non-horizontal. For each country, we drew a vertical line at such a percentile (headcount ratio). The average multi-dimensional poverty among the poor is equal to the slope of the ray from (0, 0) to the point at which the vertical line intercept the curve. Inequality among the multi-dimensionally poor individuals is represented by the degree of concavity of the non-horizontal section of the curve (Jenkins & Lambert, 1997).
Figures 4, 5, and 6 allow us to conclude unambiguously that whatever the percentile
considered, multi-dimensional poverty among adults is always, by far, lower in Costa Rica
than in the “Northern Square” of Central America (Guatemala, El Salvador, Honduras, and
Nicaragua); and, conversely, it is always larger in Guatemala and Nicaragua. Note that
although multi-dimensional poverty is, as a whole, higher in Guatemala than in Nicaragua, it
is not higher among Guatemalan adults up to approximately the 50th percentile, considering
both the first and the second scenarios, and up to around the 20th percentile, considering the
third scenario. These findings suggest that multi-dimensional poverty among adults is more
unequally distributed in Nicaragua than in Guatemala. Therefore, based on such findings, we
can conclude that in the Central American region, the poorest adults of the poorest ones live
in Nicaragua.
Figures 4, 5, and 6 show also that Guatemala is the country with the highest incidence
of multi-dimensional poverty in Central America, followed by Nicaragua, Honduras, El
Salvador, and Costa Rica, respectively. The point estimates of the incidence of
Table A3 in Appendix. Such a Table suggests that in Central America, on average, the
multi-dimensional poverty incidence among adults increases by 3% as a result of incorporating
unpaid care and domestic work into the assessment. Table A3 gives also the estimates of the
intensity of multi-dimensional poverty among adults in Guatemala, El Salvador, Honduras,
Nicaragua, and Costa Rica, as well as in Central America as a whole, considering the three
scenarios under study (S1, S2, and S3). Table A3 reveals that the average deprivation share
(A) experienced by the multi-dimensionally poor adults in Central America is larger in
countries with higher multi-dimensional poverty rates (Guatemala and Nicaragua). This is
consistent with the international evidence (see, e.g., Alkire & Santos, 2014; Santos &
Villatoro, 2018). Overall, the average deprivation share (A) exceeds 30%, which means that,
on average, the multi-dimensionally poor adults in Central America are deprived in more than
three indicators. Finally, Table A3 shows that in Central America, the overall impact on the
intensity of multi-dimensional poverty, of considering unpaid care workers and domestic
workers as employment deprived, is estimated to be 12%.
As discussed in Section 2, the multi-dimensional poverty measures used in this paper
are sensitive to inequality among the multi-dimensionally poor adults and can be decomposed
into the three I’s of multi-dimensional poverty (incidence, intensity, and inequality) (Jenkins
& Lambert, 1997). Therefore, to complement the previous results, Figure 7 presents
graphically estimates of the inequality among poor adults, measured via the Generalized
Entropy Inequality Index. This is done for each of the countries and for Central America as a
whole, for each of the three scenarios and for several levels of inequality aversion. Point
estimates and their bootstrapped confidence intervals at 95% are given in Table A4 in
Appendix.
Figure 7 is interesting. It shows clearly that in the Central American region, El
Salvador and Honduras have the largest inequality among the multi-dimensionally poor
adults. These two countries however do not have the highest levels of multi-dimensional
poverty, nor the highest incidence and intensity of multi-dimensional poverty in that region.
Such an observation indicates that the distribution of the deprivation scores of the adults in
these two countries is more unequal than that in Nicaragua, Guatemala, and Costa Rica. In
other words, El Salvador and of Honduras have a larger percentage of multi-dimensionally
poor adults who have large deprivations than the one observed in Nicaragua, Guatemala, and
Honduras is insensitive to inequality among the multi-dimensionally poor, it does not capture
the feature that was just mentioned. Needless to say, such an omission may lead to wrong
poverty alleviation policies and programs. Figure 7 makes it also clear that this inequality is
larger in Nicaragua than in Guatemala, confirming thus previous findings obtained on the
[image:29.612.94.522.178.382.2]base of Figures 4, 5, and 6, and lowest in Costa Rica.
Fig. 7. Inequality among the multi-dimensionally poor adults in Guatemala (GUA), El Salvador (ELS), Honduras (HON), Nicaragua (NIC), and Costa Rica (CR), as well as in Central America (CA) as a whole, considering three scenarios and several levels of inequality aversion (values of γ).
Source: Authors' estimates based on GUA-ENCOVI2014, ELS-EHPM2016, HON-EPHPM2013, NIC-EMNV2014, and CR-ENAHO2016.
Note: In the case of El Salvador, the inequality among the multi-dimensionally poor adults, corresponding to the second and the third scenario, is the same. This is so because the deprivation rates in employment are identical, given that the survey (ELS-EHPM2016) does not provide the information needed to determine whether the adults considered as “unpaid care and domestic workers” were available for work or not (see Table 2).
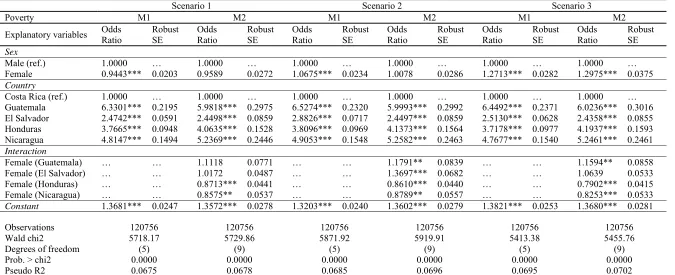
4.3.
Shedding some light on gender gaps in multi-dimensional poverty in Central America
Table 3 shows the ratio of women’s multi-dimensional poverty estimates to men’s
multi-dimensional poverty estimates in Guatemala, El Salvador, Honduras, Nicaragua, and
Costa Rica, as well as in Central America as a whole, considering the three scenarios and
several degrees of inequality aversion. Tables A5, A6, A7, and A8 in Appendix give the
corresponding estimates of multi-dimensional poverty among adults by gender and their
bootstrapped standard errors, as well as the absolute gender differences in multi-dimensional
poverty and their statistical significance. In general, we find that there are statistically
significant gender gaps in multi-dimensional poverty among adults in the countries under
threshold used for employment and, therefore, on the information incorporated into the
analysis (the scenarios).
Table 3 shows that overall, the size of the gender gaps in multi-dimensional poverty
becomes larger as the degree of inequality aversion rises: The greater the value of
γ
, the
larger the size of the gender gap. We will analyze below what drives such gaps (incidence,