On Efficient Monitoring of Process Dispersion
using Interquartile Range
Shabbir Ahmad
1, Zhengyan Lin
1, S
addam Akber Abbasi2, Muhammad Riaz
3,4 1Department of Mathematics, Institute of Statistics, Zhejiang University, 310027, Hangzhou, China 2
Department of Statistics, University of Auckland, New Zealand 3
Department of Statistics, Quaid-i-Azam University, Islamabad Pakistan 4
Department of Mathematics and Statistics, King Fahd University of Petroleum and Minerals, Dhahran, 31261, Saudi Arabia
Email: 1shabbirahmad786@yahoo.com
Abstract
: The presence of dispersion/variability in any process is understood and its careful monitoring may furnish the performance of any process. The interquartile range (IQR) is one of the dispersion measures based on lower and upper quartiles. For efficient monitoring of process dispersion, we have proposed auxiliary information based Shewhart-type IQR control charts (namely IQRr and IQRp charts) based on ratio and product estimators of lower and upper quartiles under bivariate normally distributed process. We have developed the control structures of proposed charts and compared their performances with the usual IQR chart in terms of detection ability of shift in process dispersion. For the said purpose power curves are constructed to demonstrate the performance of the three IQR charts under discussion in this article. We have also provided an illustrative example to justify theory and finally closed with concluding remarks.Keywords:
Auxiliary Information, Bivariate Normal Distribution, Control Carts, Interquartile Range, Lower and Upper Quartiles, Power Curves.1
. Introduction
Statistical Process Control (SPC) is a collection of fundamental tools which are used to monitor process behavior. In the early 1920s Walter A. Shewhart developed control charting as a useful tool of Statistical Process Control (SPC) to monitor process parameters such as location, dispersion etc. The existence of variability is unavoidable in any process and its careful monitoring is necessary to improve the performance of any process. The variability in a process can be classified in two parts namely natural and unnatural. Natural/normal variation has a consistent pattern while unnatural/unusual variation has an unpredictable behavior over the time. The presence of natural variation in a process ensures that the process is in-control state, otherwise out-of-in-control. Control charts assist differentiating between natural and unnatural variations and hence declaring the process to be in-control or out-of-control.
To monitor process variability [1] proposed usual range and standard deviation charts (namely R and S charts). The efficiency of R chart is affected with the increment in sample size where as the performance of S chart becomes poor due to existence of outliers in data (cf. [2]). Later on different estimators of interquartile range (IQR) have been used to establish design structures of dispersion charts such as: [3] and [4] have used interquartile range by restricting the position of lower and upper quartiles as integer, which become cause of some uneven patterns in design structure of control chart. Rocke [5] proposed IQR based Rq chart
which out performs the R chart for detecting shifts in process dispersion in outlier scenario. To avoid some irregularities of Rq chart, [2] proposed a new method of usual IQR chart based on the definition of [6]. Abbasi & Miller [7] compared the performances of different dispersion charts under normally and non-normally distributed environments and concluded that for small sample size the IQR chart exhibits reasonable performance while the performances of R and S charts are significantly influenced for highly skewed process environments. Much of the work related to dispersion control charts may be seen in the bibliographies of the above authors.
In this article we have proposed IQR control charts namely IQRr and IQRp charts to monitor the process dispersion in Shewhart setup. These charts are based on ratio and product estimators of lower and upper quartiles of study variable Y using one auxiliary variable X under bivariate normally distributed process. The rest of the article is organized as: Section II provides the design structure of IQR charts based on different quantile estimators considered here. In Section III the performance of IQR charts are investigated under the assumption of normality. An illustrative example is provided in Section IV to justify our proposal and finally the study is concluded with some recommendation in Section V.
2. Quantile Estimators and IQR
Charting Structures
Let the quality characteristic of interest is Y (e.g. inner diameter of shaft) and X be an auxiliary characteristic (e.g. Open Journal of Applied Sciences
outside diameter) associated with Y. Let Qy( ) & E Qx( )E be the
E -quantile of Y & X respectively andf Qy
(
y( ) & E)
f Qx(
x( )E)
be the values of density function at( ) & ( )
y x
Q E Q E respectively which can also be obtained by the kernel method or the kth nearest neighbor (cf. [8]). Also
yx
I
be the Cramer’s coefficient defined as: 211( , ) (1 )
(
) (
)
yx P x y E E E
I
where E lies between 0 and 1 depending upon the choice of quantile;11( , )
(
X Qx( ) & Y Qy( ))P x y P d E d E (cf. [9]).
Let yi&xi (i 1, 2,!, )n be a sample of size n to get estimated values of E quantile of Y & X as ( ) Qවy E & ( )Qx E respectively. We consider three estimators of ( )Qy E , one usual and two based on an
auxiliary characteristic X (using ratio and product patterns) defined as:
>
@
>
@
ˆ : ( ) ( ) ව : ( ) ( ) ( ) ( ) ව : ( ) ( ) ( ) ( )u y
r y x x
p y x x
Usual Q Q
Ratio Q Q Q Q
Product Q Q Q Q
E E
E E E E
E E E E
½
°
¾
°
¿
. (1)It is to be mentioned that we are taking Qx( )E to be a known quantile of auxiliary characteristic X. For the case of unknown Qx( )E we may estimate it by applying two phase sampling procedure (cf. [10] and [11]). The properties of the estimators, given in (1), can be easily obtained up to first order degree of approximation, following [10] and [12].
In our study we have considered normally distributed process environment under bivariate setup ( , )Y X with density function given as:
2
2
, 0 < ,
exp 0.5 (1 )
, , for
< , 1 1
2 1
/
[
xy]
x y xy
y x
y x yx
y x w
f y x U V V
P P U
SV V U
!
f f
°
®f f d d
°
¯
( 2)
where,
2 2 2 2
2 ,
( y) y ( x) x xy( x)( x) ( y x)
w y P V xP V U yP xP V V
&
y x
P P are means of Y & X respectively, 2 2
&
y x
V V are variances of Y & X respectively, Vyx is covariance between
Y & X, and Uxy V V Vxy ( x y) be the correlation coefficient
between Y & X . The bivariate normal density plot is given as:
Based on the estimators, given in (1) for 0.25 E & 0.75, we define interquartile range statistic as:
(0.75) (0.25) ( , & )
=
i i i
IQR Q Q i u r p .
( 3)
We may define the control charting structures based on IQRi ( , i u r& p) to monitor the dispersion parameter Vy of quality characteristic Y. The probability limits of IQRi based charting structures can be described as:
with
=
with 1
Prob Limits:
il i il l
ic
iu i iu u
LPL IQR F IQR IQR
CL IQR
UPL IQR F IQR IQR
D D d t ° ® °¯ ( 4) where CL, LPL and UPL refer to the Central Limit, Lower Probability Limit and Upper Probability Limit respectively of IQRi charts and D D Dl u is a
pre-specified false alarm rate which is equally divided on both tails of the probability distribution of IQRi to define the probability limits. It is to be mentioned that we may also define K-sigma limits of the structures based on IQRi
( , i u r& p) following [13].
It is to be noted that a variety of sensitizing rules are available in quality control literature which are used to differentiate between in-control and out-of-control states of process (cf. [14], [15], [16]). In our study we focus on first sensitizing rule to decide about process status for the control structures defined in (4). The first rule is defined as: Simulate bivariate random samples ( ,y xi i) of size
n
from the probability model (2) and compute the sample statistics IQRis for each sample. Plot the values of IQRis against the control limits defined in (4) or the appropriately defined K-sigma limits. By first sensitizing rule, any value of IQRi falling outside the control limits indicates an out-of control signal for the dispersion parameter of quality characteristic Y.3. Power Study of IQR Charts
To quantify the efficiency of a design structure, the discriminatory power is very famous performance measure in control charting setups. In this section we have evaluated the efficiency of IQRi charts under investigation in terms of detection ability for shifts in process dispersion parameter and created power curves following [17], [7] and [18]. The in-control value of Vy is considered as
0
y
V while the out-of-control value is considered as 1
y
V which can be defined in terms of O and Vyas
1 0
y y
state the power of charts should be high to detect the shifts in process parameters.
In order to investigate the performance of the IQRi
( , i u r& p)charts in terms of signaling probability, the power expression can be defined as:
1 0
[( or ) | ]
Power Pr IQRi
LPL IQRi!UPL Vy OVy( 5)
A Monte Carlo simulation study with 100,000 replications is conducted under probability model (2) for different parameter values and different choices of n, DandUyx. By varying the values of O from 1.07.0 we have evaluated (5) and provided the resulting power curves of IQRi charts
in Figures 1-3 for
2 2
= 5, ,= 1
y x y x
P P V V U yx 0.50, 0.70 & 0.90, n 10 and
0.002
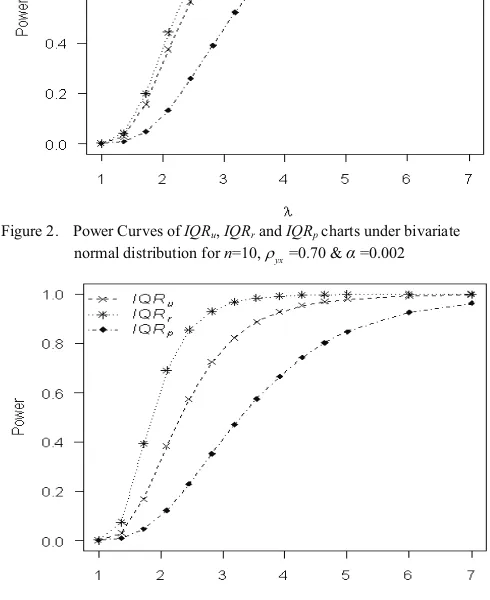
D . In Figures 1-3, O is plotted on horizontal axis and power values are plotted on vertical axis. The symbols IQRu, IQRr & IQRp refer to the power curves of IQRu, IQRr & IQRp charts respectively. The power curve analysis reveals the following points for the charting structures under dissection.
x The usual IQRu chart performs better than ratio and product type IQRr and IQRp charts for low correlations (cf. Figure 1), while for moderate and high correlations IQRr chart outperforms the IQRu and IQRp charts (cf. Figures 2 & 3).
x The performance of IQRr chart keeps improving with the increase in the amount of correlation between Y and X, which is not the case with the IQRp chart.
x The most inferior performance is exhibited by IQRp chart. The reason behind this inferiority may be due to the fact that IQRp chart is based on product estimator of E quantile and according to [10], the product estimator is less efficient than usual estimator for
0
yx
U ! .
x The performance of all the charts has a direct relationship with the values of and O n as expected.
Figure 1. Power Curves of IQRu, IQRr and IQRp charts under bivariate
normal distribution for n=10,Uyx=0.50 & Į =0.002
Figure 2. Power Curves of IQRu, IQRr and IQRp charts under bivariate
normal distribution for n=10,Uyx=0.70 & Į =0.002
Figure 3. Power Curves of IQRu, IQRr and IQRp charts under bivariate
normal distribution for n=10,Uyx=0.90 & Į =0.002
4. Illustrative Example
[image:3.595.319.560.55.229.2] [image:3.595.316.561.332.632.2]performances of usual IQRu chart and an auxiliary information based IQRr chart. In real life examples the variables Y and X may refer as i)Y: the tensile strength in (psi) and X: the outside diameter in (mm) to monitor production of steel wire; ii) Y: production of pharmaceutical products in (units) and X: the temperate in (°C) in monitoring of pharmaceutical products etc.
For the said purpose we have simulated 30 samples each of size n=10 from probability model (2) with
= 5
,
y x
P
P
0.90 .
= 1 and y x Uyx
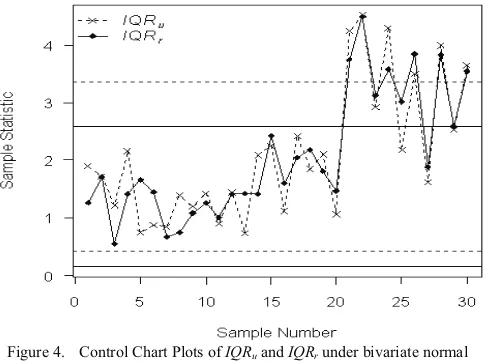
V V The first m0 20 samples are generated from in-control state i.e. O 1 whereas the remaining m1 20 observations are generated from an out-of-control state withO 2.5and computed the values of the charting statistics IQRuand IQRr. The resulting values are demonstrated in the form of control chart by plotting sample number on horizontal axis and values of IQRuandIQRr on vertical axis in Figure 4. The solid lines refer to the control limits and values of IQRr chart while the dotted lines refer to the control limits and values of IQRu chart.
Figure 4. Control Chart Plots of IQRu and IQRr under bivariate normal
distribution for n=10,Uyx=0.90,O=2.5 & Į =0.0020
It is obvious from Figure 4 that after 20th sample the IQRu chart has detected 6 out-of-control points while the
IQRr chart has indicated 9 out-of-control signals. It mean that IQRr chart has given 3 more out of control signals as compare to IQRu chart which is in accordance with the finding of power study in Section III.
5. Summary, Conclusion and
Recommendations
For an imporved monitoring of process dispersion, we have investigated Shewhart-type interquratile range charts namely IQRr and IQRp charts. The design structures of these charts are based on ratio and product esitmators of lower and upper quartiles of quality charctersitc Y with the assitance of an auxiliary charcatersic X. For comparison purposes we have also included the usual interquratile range chart namely IQRu chart. We have observed that the detection ablity of IQRr chart is possitively releated with the
correlation between Y & X. For low correlations the IQRr chart offers lower detection ablity than the usual IQRu chart but with the increament in ȡyx, IQRr chart outperforms IQRu and IQRp charts. The most inferior performance is exibited by IQRp chart for any possitivly correlated process environmet because the product esitmator is more efficient than usual estimator in case of negative correlation between Y and X.
The scope of the study may be extended for different contaminated process scenarios under Shewhart, EWMA and CUSUM setups. Moreover, the multivariate versions of these control charts may be another direction to be explored.
6. Acknowledgement
This work was supported by the National Natural Science Foundation of China (No. 11171303) and the Specialized Research Fund for the Doctor Program of Higher Education (No. 20090101110020).
REFERENCES
[1] W.A. Shewhart, "Economic control of quality manufactured product. D. Van Nostrand", (reprinted by the American Society for Quality Control in 1980, Milwauker, WI), New York, 1931.
[2] M. Riaz, "A Dispersion Control Chart", Communications in Statistics - Simulation and Computation, 37(6), 1239-1261, 2008.
[3] D.M. Rocke, "Robust Control Charts", Technometrics, 31(2), 173-184, 1989.
[4] L.G. Tatum, "Robust Estimation of the Process Standard Deviation for Control Charts", Technometrics, 39(2), 127-141, 1997.
[5] D.M. Rocke, "
X
Q andR
Q Charts: Robust ControlCharts", Journal of the Royal Statistical Society. Series D (The Statistician), 41(1), 97-104, 1992.
[6] H.A. David, "Early sample measures of variability", Statistical Science, 13(4), 368-377, 1998.
[7] S.A. Abbasi, and A. Miller, "On proper choice of variability control chart for normal and non-normal processes", Quality and Reliability Engineering International, 28(3), 279-296, 2012.
[8] B.W. Silverman, "Density Estimation for Statistics and Data Analysis", Chapman & Hall, London, 1986. [9] M.D. MartÃnez - Miranda, M. Rueda, and A. Arcos,
"Looking for optimal auxiliary variables in sample survey quantile estimation", Statistics, 41(3), 241-252, 2007.
[10] P.V. Sukhatme, and B.V. Sukhatme, "Sampling Theory of Surveys with Application", Iowa Statistical University Press, New York, 1970.
[image:4.595.52.296.299.480.2][12] M.M. Rueda, A. Arcos, and M.D. Martínez, "Difference Etimators of Quantiles in Finite Populations", TEST, 12(2), 481-496, 2003.
[13] D.C. Montgomery, "Introduction to Statistical Quality Control", 6, Wiley, New York, 2009.
[14] R.J.M.M. Does, and B.F. Schriever, "Variables control chart limits and tests for special causes", Statistica Neerlandica, 46(4), 229-245, 1992.
[15] M.B.C. Khoo, "Designs of runs rules schemes", Quality Engineering, 17, 27-43, 2004.
[16] M.V. Koutras, S. Bersimis, and P.E. Maravelakis, "Statistical process control using shewhart control chart with supplementary Runs Rules", Methodology and Computing in Applied Probability, 9, 207-224, 2007. [17] M. Riaz, and A. Saghir, "A mean deviation-based
approach to monitor process variability", Journal of Statistical Computation and Simulation, 79, 1173– 1193, 2009.