ISSN Online: 2156-8367 ISSN Print: 2156-8359
DOI: 10.4236/ijg.2017.810071 Oct. 27, 2017 1231 International Journal of Geosciences
Analysis of the Bearing Capacity of Shallow
Foundation in Unsaturated Soil Using Monte
Carlo Simulation
Nadarajah Ravichandran, Vahidreza Mahmoudabadi, Shweta Shrestha
Glenn Department of Civil Engineering, Clemson University, Clemson, SC, USA
Abstract
The ultimate bearing capacity of shallow foundation supported by unsatu-rated soil depends on the degree of saturation of the soil within the influence zone because the strength and deformation parameters of soil are affected by the degree of saturation. As the degree of saturation varies with rainfall, sur-face runoff, evapotranspiration and other climatic and geotechnical parame-ters, these parameters must be systematically incorporated for accurately computing the ultimate bearing capacity. In this study, a framework is pro-posed to compute the ultimate bearing capacity of a shallow footing in unsa-turated soil considering site specific rainfall and water table depth distribu-tions. The randomness in rainfall and water table depth is systematically con-sidered using Monte Carlo method. The infiltration of water through the un-saturated zone is modelled using Richards equation considering infiltration and water table location as the top and bottom boundary conditions, respec-tively. The results show that the bearing capacity calculated using the pro-posed method is approximately 2.7 times higher than that calculated using the deterministic approach with fully saturated soil parameters.
Keywords
Unsaturated Soil, Shallow Foundation, Rainfall Data, Geotechnical Design, Monte Carlo Simulation
1. Introduction
Shallow foundations are typically considered as the simplest and most economi-cal foundation for supporting small to medium size structures. They transfer the structural loads to the near surface soil that is mostly unsaturated and fluctuates How to cite this paper: Ravichandran, N.,
Mahmoudabadi, V. and Shrestha, S. (2017) Analysis of the Bearing Capacity of Shallow Foundation in Unsaturated Soil Using Monte Carlo Simulation. International Journal of Geosciences, 8, 1231-1250.
https://doi.org/10.4236/ijg.2017.810071 Received: January 18, 2017
Accepted: October 24, 2017 Published: October 27, 2017
Copyright © 2017 by authors and Scientific Research Publishing Inc. This work is licensed under the Creative Commons Attribution International License (CC BY 4.0).
DOI: 10.4236/ijg.2017.810071 1232 International Journal of Geosciences with climatic condition. Recent studies show that the strength and deformation parameters of soil are influenced by the degree of saturation of the soil. Since the degree of saturation of the near surface soil varies with climatic and geotechnical parameters such as rainfall, water table depth, evapotranspiration, hydraulic conductivity, there can be variation in the strength and deformation parameters of the near surface soil. The two of the design considerations of shallow founda-tions are the safety against the overall shear failure in the soil and the settlement. This paper focuses on systematically incorporating the site specific climatic and geotechnical parameters in computing ultimate bearing capacity of soil.
The ultimate bearing capacity of a continuous shallow foundation is typically calculated using Terzaghi’s [1] ultimate bearing capacity equation (Equation (1)) assuming that the soil below the footing fails in general shear failure mode.
1 2
u c q
q =c N′ +qN + γBNγ (1) where c′ is the cohesion of soil, γ is the unit weight of the soil, q is the ef-fective overburden pressure given by q=γDf , Df is the depth from soil sur-face to bottom of footing, B is the width of footing, and N Nc, q, and Nγ are the dimensionless bearing capacity factors and are functions of the soil friction angle
φ′.
The application of Terzaghi’s equation to compute ultimate bearing capacity is limited because it is applicable to shallow footings (Df≤ B) and subjected to concentric vertical loads. In 1963, Meyerhof [2] suggested a general bearing ca-pacity equation to overcome the shortcomings of Terzaghi’s equation by intro-ducing shape factors, depth factors, and load inclination factors. The general bearing capacity equation with the adjustment factors for shape, depth, and load inclination is shown in Equation (2).
(
)
(
)
1(
)
2
u c cs cd ci q qs qd qi s d i
q =c N′ F F F +qN F F F + B Nγ γ F F Fγ γ γ (2)
DOI: 10.4236/ijg.2017.810071 1233 International Journal of Geosciences climatic conditions. Therefore, a comprehensive methodology must be devel-oped based on unsaturated soil mechanics principles to incorporate the influ-ence of the degree of saturation for computing ultimate bearing capacity. This paper presents such a methodology that considers site specific rainfall and water table depth in a probabilistic manner.
Unsaturated soil is a three phase medium. It consists of three bulk phases (solid, water, and air) and three interfaces (solid-water, water-air, and air-solid). Among the three interfaces, the air-water interface plays a critical role in the mechanical behavior of unsaturated soils [8][11][12]. The dynamic equilibrium among these bulk phases and interfaces can be expressed in terms of
(
σ−ua)
,(
ua−uw)
, and(
σ−uw)
[11], where σ is the total stress, ua is the pore air pressure, and uw is the pore water pressure. Fredlund and Morgentern’s study[11] concluded that although any two of the three possible combinations can be used to describe the state of unsaturated soils, the net stress
(
σ−ua)
and the matric suction(
ua−uw)
are the most satisfactory combinations for use in en-gineering practice. The combination is advantageous because the effects of a change in net stress can be separated from the effects of a change in pore water pressure. Also the combination is advantageous because pore air pressure, one of the two fluid pressures, is atmospheric in most engineering problems under normal loading conditions and therefore no need to calculate them. The matric suction is related to the degree of saturation of the soil through a constitutive re-lationship called Soil Water Characteristic Curve (SWCC). Therefore, knowing the value of degree of saturation, the matric suction can be computed and used in empirical or semi-empirical relationships for computing ultimate bearing ca-pacity.The shear strength parameters for a soil with matric suction are defined by Fredlund [12] as the effective angle of internal friction (φ′), the effective cohe-sion (c′), and the angle of shear strength change with respect to matric suction (φb). The modified bearing capacity equation that considers the effect of suction is shown in Equation (3).
(
)
1tan
2 b
u a w c q
q =c′+ u −u φ N +qN + γBNγ (3) where
(
ua−uw)
is the matric suction.Because of the difficulties in determining φb for use in Equation (3), re-searchers have proposed empirical and/or semi-empirical equations for compu-ting ultimate bearing capacity of shallow foundations [7][13]. Among the many equations, the semi-empirical equation proposed by Vanapalli and Mohamed [7]
DOI: 10.4236/ijg.2017.810071 1234 International Journal of Geosciences capacity equation.
(
)
(
tan tan)
(
)
tan0.5
u a w b a w ave c cs cd
f q qs qd s d
q c u u S u u S N F F
D N F F BN F F
ψ ψ
γ γ γ
φ φ φ
γ γ
′ ′ ′ ′
= + − − + −
+ + (4)
where
(
ua−uw b)
is the air entry value from SWCC,(
ua−uw ave)
is the average air-entry value, φ′ is the effective friction angle, S is the degree of saturation,and ψ is the bearing capacity fitting parameter given by Equation (5).
( )
( )
21.0 0.34 Ip 0.0031 Ip
ψ = + − (5)
where Ipis the plasticity index. The average suction in the above bearing capacity equation is given by Equation (6).
(
)
(
) (
1)
21 2
a w ave a w a w
u −u = u −u + u −u (6)
where
(
ua−uw)
1 is the matric suction at the bottom of the footing and(
ua−uw)
2 is the matric suction at a depth equal to 1.5 times the width of the footing (1.5B).The bearing capacity equation (Equation (4)) for unsaturated soil requires computing the matric suction profile within the influence zone of a shallow foundation. Since the matric suction is related to the degree of saturation through SWCC, one may easily compute matric suction from degree of saturation using SWCC. The degree of saturation in the soil can also be measured by soil sam-pling and dielectric sensor. Low resolution satellites such as NOAA-AVHRR and TERRA-MODIS can provide daily evapotranspiration fluxes in a clear sky at the 1 km scale [14] allowing for the determination of suction changes. Numerical models have also been developed for predicting the variation of matric suction and/or degree of saturation with depth for a give hydrological and geotechnical conditions [15][16]. Although these deterministic methods can be used to pre-dict the spatial and temporal variation of suction, the application is limited be-cause the rate of infiltration and water table depth varies randomly. Therefore, the problem must be approached in a probabilistic manner considering the ex-treme events and suitable return periods for the rainfall and water table depth.
DOI: 10.4236/ijg.2017.810071 1235 International Journal of Geosciences
2. Analysis Procedure
The first step in performing a Monte Carlo simulation is defining the problem in terms of random variables and representing them with suitable probabilistic dis-tributions. The variables in the bearing capacity equation arise from Equation (4). In this study, the base shear strength parameters of the soil are considered as constants. It should be noted that a comprehensive study may consider the shear strength parameters also as random variables. The inherent randomness of these variables can be incorporated into the Monte Carlo simulation technique but to allow for comparisons between the saturated and unsaturated soil bearing ca-pacities the base shear strength parameters were kept as constants. The remain-ing random variable, i.e. the matric suction and degree of saturation must be de-fined in terms of its probability density function (PDF) to allow for the bearing capacity to be solved for through Monte Carlo simulations.
DOI: 10.4236/ijg.2017.810071 1236 International Journal of Geosciences (Ks). The duration of the rainfall event was calculated by dividing the randomly selected rainfall event in inches by the saturated hydraulic conductivity of the soil. Dividing the rainfall event by Ks is a simplified approach compared to de-termining an infiltration rate with the unsaturated hydraulic conductivity K(h), which varies with time and depth. Besides rainfall, evapotranspiration and sur-face runoff affect the value of the influx at the ground sursur-face which is the top boundary condition for solving the mathematical model that represents the flow of water through unsaturated soil (Richards equation). This will ultimately affect the temporal and spatial variation of matric suction in soil. In this paper, the surface runoff and evapotranspiration are ignored.
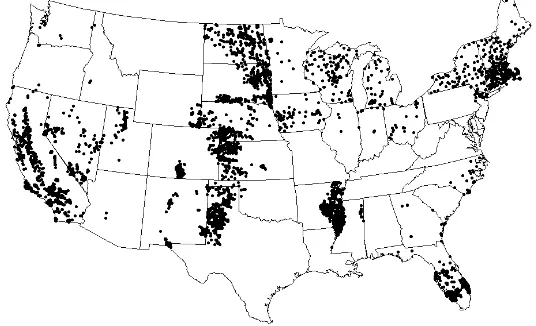
The water table depth is the bottom boundary condition which affects the matric suction and/or degree of saturation of soil in the influence zone of shal-low foundation. The U.S. Geological Survey (USGS) and National Water Infor-mation System, provides data about the water table depths over a long period of time at various locations [19]. It is important to note that the water table data can only be determined in unconsolidated sand and gravel aquifers. There are over 26, 135 sites in these types of aquifers with 50 data points or more. The lo-cations of these wells in the USA are shown in Figure 1. Fortunately, numerous wells are located in arid or semi-arid climates within the continental United States that are suitable for applying the proposed method for computing ulti-mate bearing capacity.
[image:6.595.239.507.544.707.2]With rainfall and water table depth distributions, the spatial and temporal variations of matric suction and/or degree of saturation can be computed. The method used to calculate the matric suction is described in the next section. Be-sides the matric suction, the unit weight of the soil is another parameter that va-ries with changing degree of saturation of the soil. By modeling the flow of water into the soil considering infiltration and the water table depth as the top and bottom boundary conditions, the variation in unit weight of the soil can be weight values within the influence zone of the foundation, the Equation (4) can be solved for the number of Monte Carlo Simulations selected for the study.
DOI: 10.4236/ijg.2017.810071 1237 International Journal of Geosciences Through numerous studies with different numbers of simulations, the location and shape parameters are checked for convergence. The converged data from the Monte Carlo simulation accurately represents the bearing capacity for the foundation. From the data collected in the Monte Carlo simulation, a cumulative distribution function (CDF) of the bearing capacity can be used to make risk as-sessments.
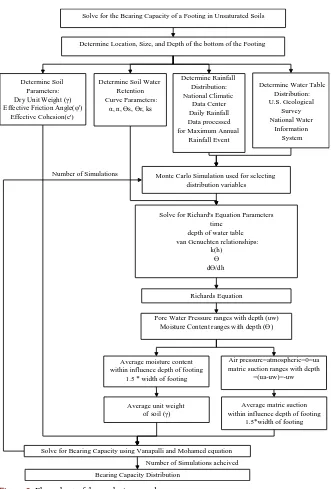
Design risk can be quantified by the product of probability of failure and the consequence of failure. But calculating the consequences of failure is difficult for practicing engineers, thus current practice in reliability based foundation design accounts for the consequence of failure indirectly by prescribing different target probabilities of failure [20]. The reliability index (β), which is the inverse stan-dard normal cumulative function of the probability of failure is the prescribed value usually published. The Canadian Building Code uses a target β = 3.5 for the superstructure and the foundations. AASHTO uses a target β = 3.5 for the superstructure and target β values from 2.0 to 3.5 for the foundations. For this paper a probability of failure of 10−4 was selected to enable the bearing capacity to be read off the CDF. This is equivalent to a β = 3.7, which exceed the Cana-dian Building Code and AASHTO target values. Figure 2 is a flow chart that outlines the method used to calculate the bearing capacity of unsaturated soil.
3. Calculation of SPATIAL Variation of Matric Suction and
Unit Weight
3.1 .Flow of Water through Unsaturated Soil Zone and Spatial and
Temporal Variations of Matric Suction and Degree of
Saturation
Matric suction is directly related to the hydraulic head (hw) of the soil:
(
ua−uw)
= −0(
hw−y)
ρwg (7) where ua is the atmospheric pressure, y is the gravitational head, and ρw is the density of water. The flow behavior of water in unsaturated soil is complex compared to the saturated soil because of the variation in hydraulic head with time and depth. The variation in hydraulic head with time and depth due to an infiltration event with the ground water table set at the datum can be solved us-ing Richard’s equation in unsaturated soils.( )
d d
1
d d
h h
k h
dh t z z
θ
∂ = ∂ +
∂ (8)
where dh is the water capacity function.
The parameters in Richards equation can be solved for using the equations developed by van Genuchten [21].
( )
{
( )
( )
}
( )
12
1 1
1
m
n n
m m n
h h
K h
h
α α
α
− −
−
− +
=
+
DOI: 10.4236/ijg.2017.810071 1238 International Journal of Geosciences Figure 2. Flow chart of the analysis procedure.
(
)
1(
1)
d
1
d 1
m
s r m m
m
h m
α θ θ
θ − −
= Θ − Θ
− (10)
where θr is the residual water content, θs is the saturated water content, α is the approximation of the inverse of the pressure head at which the retention curve becomes the steepest, Θ is the dimensionless water content, and n and m
are model constants (typically m= −1 1n). All of these parameters are based on the soil type and are fitting parameters for an empirically determined soil water retention curve (SWRC).
After calculating these parameters, Richards equation can be solved numeri-cally by the finite difference method. The Crank-Nicolson scheme implemented
Solve for the Bearing Capacity of a Footing in Unsaturated Soils
Determine Location, Size, and Depth of the bottom of the Footing
Determine Soil Parameters: Dry Unit Weight (γ) Effective Friction Angle(φ')
Effective Cohesion(c')
Determine Soil Water Retention Curve Parameters:
α, n, Өs, Өr, ks
Determine Rainfall Distribution: National Climatic
Data Center Daily Rainfall Data processed for Maximum Annual
Rainfall Event
Determine Water Table Distribution: U.S. Geological
Survey National Water
Information System
Solve for Richard's Equation Parameters time
depth of water table van Genuchten relationships:
k(h) Ө dӨ/dh
Monte Carlo Simulation used for selecting distribution variables
Pore Water Pressure ranges with depth (uw) Moisture Content ranges with depth (Ө)
Air pressure=atmospheric=0=ua matric suction ranges with depth
=(ua-uw)=-uw Average moisture content
within influence depth of footing 1.5 * width of footing
Average matric suction within influence depth of footing
1.5*width of footing Average unit weight
of soil (γ)
Solve for Bearing Capacity using Vanapalli and Mohamed equation Number of Simulations
Bearing Capacity Distribution
DOI: 10.4236/ijg.2017.810071 1239 International Journal of Geosciences in Bolster and Raffensperger’s (1996) Matlab [22] program to solve Richards equation was implemented in the Monte Carlo simulation algorithm in this study. The result is the variation in hydraulic head, which as explained above can be used to solve for the
(
ua−uw ave)
term in the bearing capacity equation for the unsaturated soil.The average air entry value,
(
ua−uw)
B, is the other type of suction that needs to be solved. It is inversely proportional to the van Genuchten soil parameter α as given by the following equation.(
)
1a w B w
u u γ
α
− =
(11)
where γw is the unit weight of water.
3.2. Spatial and Temporal Variations of Unit Weight
Since the unit weight is affected by the degree of saturation (S), the variation of unit weight is determined based on the average S in the influence zone of the foundation. In this study, the van Genuchten [21] soil water characteristic curve (Equation (12)) was used to solve for the moisture content of the soil with depth.
(
)
( )
1s r
r n m
h θ θ θ θ
α −
= +
+
(12)
Using the same method used for calculating the
(
ua −uw ave)
, the average moisture in the soil within the influence depth of the footing (1.5B) can be cal-culated by:( ) ( )
1 2 2θ
θ
θ
= +
(13)
Then, the average degree of saturation (S) in the influence area can be calcu-lated by:
s
S θ
θ =
(14)
Finally, the variation in the unsaturated unit weight of the soil can be calcu-lated using the average degree of saturation in the influence zone of the shallow foundation using the basic weight-volume relationship given by:
(
)
1
s w
G Se
e γ
γ = +
+ (15)
where e is the void ratio, Gs is the specific gravity of the soil solids, and w is the unit weight of water.
4. Sample Application
4.1. Problem Definition
DOI: 10.4236/ijg.2017.810071 1240 International Journal of Geosciences water table and geotechnical data. This investigation was extended to determine if the depth and size of the footing on the computed ultimate bearing capacity. In addition, the influence of matric suction and degree of saturation related term
(
)
(
)
(
)
(
c ua uw b tan S tan ua uw AVRS tan N F Fc cs cd)
ψ ψ
ϕ ϕ ϕ
′+ − ′− ′ + − ′
and the
depth factor shown in Equation (16) in the ultimate bearing capacity.
1 0.4 f cd
D F
B
= +
(16)
To determine if the size and depth have significant influence on the bearing capacity, three footings were considered and the computed results were com-pared. For the first example, the footing width (B) was increased from 1.07 to 1.52 m. Another example kept the Df B ratio equal to the initial footing size and depth, thus B = 1.52 m and Df= 0.87 m. The last example allowed B to re-main equal to 1.07 m and increase the Df to 0.87 m.
To determine how the return period of the hydrological parameters affects the bearing capacity of the footing, the square 1.07 m located 0.61 m below the ground surface was analyzed by considering return periods between: 1 yr and 2 yrs, 1 yr and 5 yrs, 1 yr and 10 yrs, 1 yr and 50 yrs, 1 yr and 100 yrs, 1 yr and 200 yrs and 1 yr and an infinite number of years for the rainfall and water table depth.
The Victorville, CA location was selected in this study due to its arid climate and the availability of van Genuchten soil water retention curve parameters for the Adelanto Loam located in this region. The van Genuchten parameters for the soil water retention curve of Adelanto Loam were taken from Zhang [23] are:
θs = 0.423, θr = 0.158, α = 0.00321 cm−1, n = 1.26 and Ks = 0.003492 cm/min. The soil strength parameters were taken from a geotechnical engineering re-port by Kleinfelder [24]. The report was from a site about 15 miles from Victor-ville, CA. The site was a similar distance from the river that passes VictorVictor-ville, thus it was assumed that the water table would be reasonably similar. The dry unit weight for the soil at a depth of 1.52 m is 16.19 kN/m3. The angle of internal friction for the soil at a depth of 1.52 m is 33 degrees. The cohesion at a depth of 1.52 m is 0. The USCS soil type for the soil at 1.52 m is SM.
4.2. Site Specific Rainfall Data
DOI: 10.4236/ijg.2017.810071 1241 International Journal of Geosciences data set. To determine the best fitting distribution for the rainfall data, the probability paper plotting technique was used. The Type II Extreme Largest (Frechet distribution), Type I Extreme Largest (Gumbel distribution), and the Type III Extreme Largest (Weibull distribution) were checked for the best fit. The Gumbel distribution was deemed the best fit based on R2 values. The proba-bility plot of rainfall data for the Gumbel distribution is shown in Figure 3(a).
Using the Gumbel distribution the CDF was transformed into a linear equa-tion shown below, it can be determined that the locaequa-tion parameter,
0.8472 n
µ = and the shape parameter β =n 0.5011. ln ln
1 n n i
i
x
n β µ
− − + =
+
(17)
where xi is the annual maximum rainfall data and n is the number of data points.
4.3. Site Specific Water Table Data
The water table data at Victorville, CA was taken from the U.S. Geological Sur-vey National Water Information System: Web Interface [19]. The water table depth was recorded between the years of 1930 and 1958. To determine the best-fit distribution for the water table data the probability paper plotting tech-nique was used. For this case, the Frechet Distribution (Type II Extreme Larg-est), Gumbel Distribution (Type I Extreme LargLarg-est), Weibull Distribution (Type III Extreme Largest), Normal distribution, and Lognormal distribution were checked for the best fit. The Frechet distribution had the best fit, but for simplic-ity the Gumbel distribution, the second best fit was used. The probabilsimplic-ity plot of the water table data for the Gumbel distribution is shown in Figure 3(b). Using Equation (17) the Gumbel distribution parameters were determined as
43.916 n
µ = and β =n 0.7912.
4.4. Results and Discussions
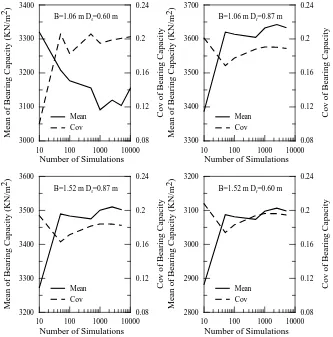
The convergence of the mean and the coefficient of variation for the bearing ca-pacity distributions with the number of simulations are plotted in Figure 4. At 10,000 simulations, there is evidence of a convergence for each of the different example footings. The mean is the location parameter and the coefficient of var-iation takes into account the shape. With both of these measurements of the dis-tribution, it can be understood that the empirical CDF created from the Monte Carlo simulations accurately represents the bearing capacity for the footings considered in Victorville, CA.
DOI: 10.4236/ijg.2017.810071 1242 International Journal of Geosciences (a) (b)
Figure 3. Type I Extreme Largest (Gumbel distribution) for rainfall data and water table data for Victorville, CA location.
Figure 4. Number of simulations versus the mean and coefficient of variation.
the bearing capacity calculated with unsaturated soil mechanics principles. The percent increases in bearing capacity from conventional method to the proposed method are also listed in Table 1 for various footing sizes and depths.
From the results in Table 1, it is evident that the depth factor in the cohesion term has a significant influence in the ultimate bearing capacity of shallow
-2 -1 0 1 2 3 4 5
x = -ln(-ln(i/n+1))
0.0 0.5 1.0 1.5 2.0 2.5 3.0 3.5 R ai n fa ll ( in ) [ y = xi ]
y = 0.5011x + 0.8472 R2=0.9948 (a)
-2 -1 0 1 2 3 4
x = -ln(-ln(i/n+1)) 42 43 44 45 46 47 W at er D ep th ( ft ) [ y = xi ]
y = 0.7912x + 43.916 R2=0.9278
(b)
10 100 1000 10000
Number of Simulations 3000 3100 3200 3300 3400 M ea n o f B ea ri n g C ap ac it y ( K N /m 2) 0.08 0.12 0.16 0.2 0.24 C o v o f B ea ri n g C ap ac it y Mean Cov
B=1.06 m Df=0.60 m
10 100 1000 10000
Number of Simulations 3300 3400 3500 3600 3700 M ea n o f B ea ri n g C ap ac it y ( K N /m 2) 0.08 0.12 0.16 0.2 0.24 C o v o f B ea ri n g C ap ac it y Mean Cov
B=1.06 m Df=0.87 m
10 100 1000 10000
Number of Simulations 3200 3300 3400 3500 3600 M ea n o f B ea ri n g C ap ac it y ( K N /m 2) 0.08 0.12 0.16 0.2 0.24 C o v o f B ea ri n g C ap ac it y Mean Cov
B=1.52 m Df=0.87 m
10 100 1000 10000
Number of Simulations 2800 2900 3000 3100 3200 M ea n o f B ea ri n g C ap ac it y ( K N /m 2) 0.08 0.12 0.16 0.2 0.24 C o v o f B ea ri n g C ap ac it y Mean Cov
[image:12.595.208.541.286.623.2]DOI: 10.4236/ijg.2017.810071 1243 International Journal of Geosciences Figure 5. Bearing capacity versus probability of failure for all
systems in Victorville (a).
Table 1. Computed ultimate bearing capacities.
Case L (m) B (m) Df (m)
Bearing Capacity Using Deterministic Method Assuming Fully Saturated
Condition (KN/m2)
Bearing Capacity Using Monte Carlo Simulation Assuming Unsaturated Condition
(KN/m2)
Increase in Bearing
Capacity (%)
1 1.07 1.07 0.61 419 1548 269
2 1.07 1.07 0.87 574 2013 251
3 1.52 1.52 0.61 455 1673 268
4 1.52 1.52 0.87 598 1992 233
foundation. The footing with the 1.07 m width and the depth of 0.87 m (case 2) showed the highest bearing capacity increase. This is a larger bearing capacity than the larger footing at the same depth. This shows that a smaller depth factor has more influence than a larger footing. It is clearly evident that the bearing capacity of the soil is significantly affected by the matric suction and the varia-tion of unit weight. All the bearing capacities for the different example footings have increased by over 233% when using the proposed method based on unsa-turated soil mechanics principles.
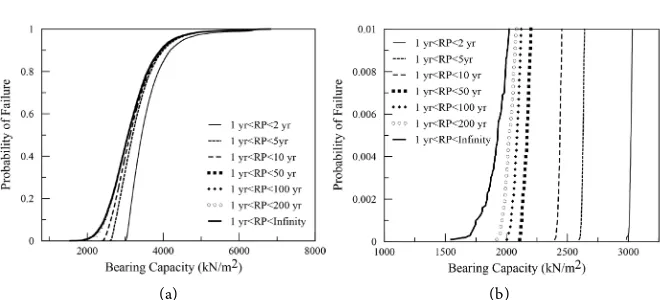
The effect of the return period (RP) on the bearing capacity for the case 1 footing is plotted in Figure 6(a). As expected, the decrease in the return period resulted in increases in the ultimate bearing capacity of the footing with a prob-ability of failure of 10−4. Figure 6(b) provides a plot that an engineer could use to select a probability of failure for a foundation, the return period for the rain and water table event, and the bearing capacity for the site.
5. Sensitivity Analyses
5.1. Sensitive Parameters and Analysis Procedures
Sensitivity analyses were conducted to determine the effect of variations in input parameters used in the calculations and also served as additional examples to
2000 4000 6000 8000
Bearing Capacity (kN/m2) 0.0
0.2 0.4 0.6 0.8 1.0
P
ro
b
ab
il
it
y
o
f
F
ai
lu
re
B=1.06 m Df=0.60 m
B=1.06 m Df=0.87 m B=1.52 m Df=0.87 m
[image:13.595.207.543.310.430.2]DOI: 10.4236/ijg.2017.810071 1244 International Journal of Geosciences (a) (b)
Figure 6. Bearing capacity versus probability of failure for 1.06 m square footing at a depth of 0.60 m for different return periods in Victorville (a).
explain the procedure. The first sensitivity analysis was to determine if another site with increased rainfall events would significantly decrease the increased bearing capacity determined from the sample application. The Levelland, Texas was selected as the second site in this study. The required data for the Levelland site was collected following the procedure for the Victorville site. The soil strength parameters were obtained from a geotechnical report made by Amarillo Testing and Engineering, Inc [25]. The soil parameters are summarized in Table 2. The Gumbel distribution was once again the best fit for the rainfall data in Le-velland (Figure 7(a)) and the normal distribution was the best fit for the water table data in Levelland (Figure 7(b)). Compared to the sample application which used van Genuchten parameters published [23] for a specific soil, a new approach for defining the van Genuchten parameters is used in this sensitivity analysis.
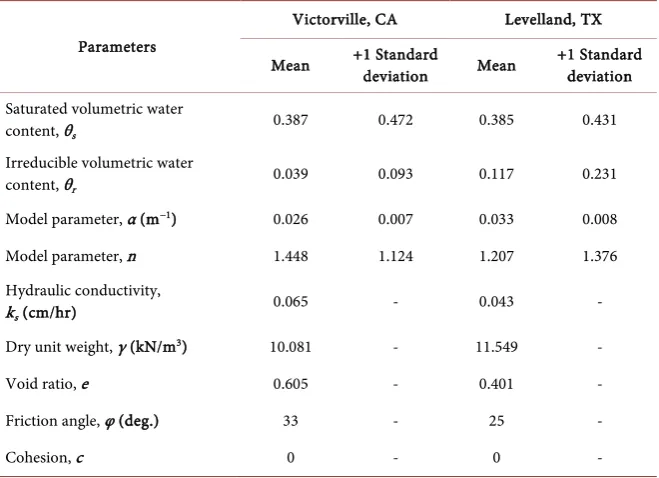
The van Genuchten values determined through the lowest of the hierarchical sequences in the program Rosetta [26] are printed in a table in the program’s help index. The values in that table were generated by computing the average value for each textural class. Each textural class includes one standard deviation of uncertainty for the van Genuchten parameters. The soil classification in the geotechnical report was used to determine the best class of Levelland Texas soil. The Levelland was considered to be in the sandy clay textural class. The van Genuchten parameters for this soil are in Table 2.
DOI: 10.4236/ijg.2017.810071 1245 International Journal of Geosciences (a) (b)
Figure 7. Type I Extreme Largest (Gumbel distribution) for rainfall data and normal dis-tribution for water table data.
Table 2. USDA Textural Class Average Values of Hydraulic Parameters and Soil Para-meters for Victorville and Levelland Sites at Depth of 1.524 m
Parameters
Victorville, CA Levelland, TX
Mean +1 Standard deviation Mean +1 Standard deviation
Saturated volumetric water
content, θs 0.387 0.472 0.385 0.431
Irreducible volumetric water
content, θr 0.039 0.093 0.117 0.231
Model parameter, α (m−1) 0.026 0.007 0.033 0.008
Model parameter, n 1.448 1.124 1.207 1.376
Hydraulic conductivity,
ks (cm/hr) 0.065 - 0.043 -
Dry unit weight, γ (kN/m3) 10.081 - 11.549 -
Void ratio, e 0.605 - 0.401 -
Friction angle, φ (deg.) 33 - 25 -
Cohesion, c 0 - 0 -
site are referred to as Victorville (Adelanto Loam) while the results from the van Genuchten parameters from the Rosetta [26] table are Victorville (Sandy Loam).
A third sensitivity analysis was also performed by testing each van Genuchten parameter determined by the textural class individually. Each parameter was in-creased by one standard deviation to determine which parameter plays the larg-est role in affecting bearing capacity of shallow footings. Each parameter’s one standard deviation increase for both the Victorville (Sandy Loam) and the Le-velland is summarized in Table 2. This analysis also allows for a discussion of the importance of accurate SWRC in the ultimate bearing capacity calculation using the proposed method.
-2 -1 0 1 2 3 4 5
x = -ln(-ln(i/n+1)) 0
1 2 3 4 5
R
ai
n
fa
ll
(
in
)
[
y
=
xi
]
y = 0.7051x + 1.7674 R2=0.9810
(a)
-3 -2 -1 0 1 2 3
x = phi-1(i/n+1) 130
135 140 145 150 155 160 165
W
at
er
D
ep
th
(
ft
)
[
y
=
xi
]
y = 5.4118x+149.16 R2=0.8352
[image:15.595.210.540.322.561.2]DOI: 10.4236/ijg.2017.810071 1246 International Journal of Geosciences The final sensitivity analysis observed the influence of the depth factor in the cohesion term on the bearing capacity. Once again the footing was tested with the four different variations of footing size and depth described in the sample application for both the mean values of Levelland and Victorville (Sandy Loam).
5.2. Results and Discussions
The results from the first sensitivity analysis, a change in location are recorded in Table 3. The CDF for the simulation is plotted in Figure 8. It is evident that the bearing capacity of the footing in Levelland, Texas is lower than the bearing capacity in Victorville, California. To determine if the decrease in bearing capac-ity is primarily due to a change in the soil strength parameters comparisons were made between the saturated and unsaturated soil bearing capacities. Even with increased rainfall, the soil in Levelland had an increase in bearing capacity over 76% (Table 3) through the Monte Carlo simulation method. Thus this method is valuable to use in regions that are not one of the driest in the United States.
[image:16.595.61.539.376.713.2]The sensitivity analysis of the van Genuchten parameters was tested by com-paring the bearing capacities of the Victorville (Adelanto Loam) and the Victorville (Sandy Loam) sites. The bearing capacity for the case 1 footing for the Victorville
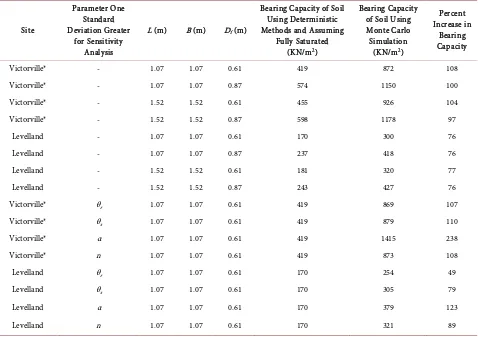
Table 3. Computed bearing capacities for Victorville and Levelland with sensitivity analyses.
Site
Parameter One Standard Deviation Greater
for Sensitivity Analysis
L (m) B (m) Df (m)
Bearing Capacity of Soil Using Deterministic Methods and Assuming
Fully Saturated (KN/m2)
Bearing Capacity of Soil Using Monte Carlo
Simulation (KN/m2)
Percent Increase in
Bearing Capacity
Victorville* - 1.07 1.07 0.61 419 872 108
Victorville* - 1.07 1.07 0.87 574 1150 100
Victorville* - 1.52 1.52 0.61 455 926 104
Victorville* - 1.52 1.52 0.87 598 1178 97
Levelland - 1.07 1.07 0.61 170 300 76
Levelland - 1.07 1.07 0.87 237 418 76
Levelland - 1.52 1.52 0.61 181 320 77
Levelland - 1.52 1.52 0.87 243 427 76
Victorville* θr 1.07 1.07 0.61 419 869 107
Victorville* θs 1.07 1.07 0.61 419 879 110
Victorville* α 1.07 1.07 0.61 419 1415 238
Victorville* n 1.07 1.07 0.61 419 873 108
Levelland θr 1.07 1.07 0.61 170 254 49
Levelland θs 1.07 1.07 0.61 170 305 79
Levelland α 1.07 1.07 0.61 170 379 123
Levelland n 1.07 1.07 0.61 170 321 89
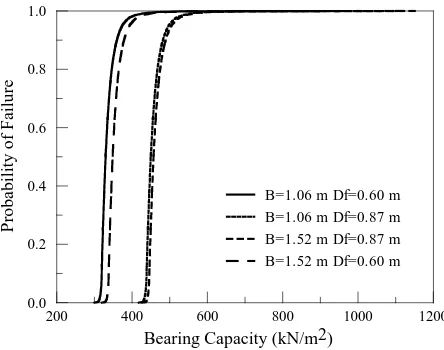
DOI: 10.4236/ijg.2017.810071 1247 International Journal of Geosciences Figure 8. Bearing capacity versus probability of failure for all
systems in Levelland.
(Adelanto Loam) is 1548 KN/m2. The bearing capacity for the same footing for the Victorville (Sandy Loam) is 872 KN/m2. All the footing sizes and depth have similar changes (refer to Table 1 and Table 3). The changes in parameters also affected the distribution of bearing capacities computed form the Monte Carlo simulation. Comparing Figure 4 to Figure 9 it is noticeable that the CDFs are much steeper. Though the rainfall and water table distributions are very impor-tant, this sensitivity analysis revealed that the SWRC parameters are equally im-portant in accurately predicting the increase in bearing capacity in this probabil-istic method.
Based on the individual sensitivity analysis of each parameter, the parameter alpha in Equation (9) resulted in the highest change in bearing capacity while increasing it by one standard deviation (refer to Table 3). It is reasonable that this parameter has a significant control since it describes the matric suction a soil has when it is almost completely saturated. The smaller the alpha value is; the greater the matric suction is at higher degrees of saturation. The rest of the van Genuchten parameters have similar sensitivities to the increase in bearing capacity when increased by one standard deviation (refer to Table 3). With this probabilistic method it is most important to accurately predict alpha, while fit-ting a SWRC to the volumetric moisture content and hydraulic head data.
The influence of the depth factor was studied by comparing the percent in-crease in the ultimate bearing capacity for two footings of different sizes at a specified depth. The difference between the percent increase for the determinis-tic method with fully saturated soil and the Monte Carlo simulation with unsa-turated soil was calculated. Since the depth is the same, the effects of matric suc-tion are constant. Considering this, the percent increase in the ultimate bearing capacity for both cases should only be due to the change in size of the footing. Thus the percent difference between the two methods for increased bearing ca-pacity should be the same; this is not the case in Table 4. The important trend in
Table 4 is that as the influence of matric suction increases in the bearing
200 400 600 800 1000 1200
Bearing Capacity (kN/m2) 0.0
0.2 0.4 0.6 0.8 1.0
P
ro
b
ab
il
it
y
o
f
F
ai
lu
re
B=1.06 m Df=0.60 m
B=1.06 m Df=0.87 m B=1.52 m Df=0.87 m
DOI: 10.4236/ijg.2017.810071 1248 International Journal of Geosciences Figure 9. Bearing capacity versus probability of failure for
all systems in Victorville (Sandy Loam).
Table 4. Effects of depth factor on the cohesion term in the bearing capacity equation.
Site Footing 1 (m) Footing 2 (m) Depth (m)
Bearing Capacity Based on Deterministic Method Assuming Fully Saturated
Condition (KN/m2)
Bearing Capacity Based on Monte Carlo Method Assuming Unsaturated
Condition (KN/m2)
Difference between Two Methods (%)
Victorville
(Sandy Loam) 1.07 1.52 0.61 8.705 6.192 2.51
Victorville
(SandyLoam) 1.07 1.52 0.87 4.138 2.435 1.70
Levelland 1.07 1.52 0.61 6.695 6.666 0.03
Levelland 1.07 1.52 0.87 2.223 2.153 0.07
Victorville
(Adelanto Loam) 1.07 1.52 0.61 8.705 8.074 0.63
Victorville
(Adelanto Loam) 1.07 1.52 0.87 4.138 −1.043 5.18
capacity, the influence of the depth factor increases. The difference in percent increase in bearing capacity calculated using the two methods while increasing the footing size reduces by 1.70% for the depth of 0.87 m in Victorville (Sandy Loam). For sites where suction has more influence such as Victorville (Adelanto Loam), the difference in the percent increase in bearing capacity due to an in-crease in footing size reduces by 5.18% for a footing at a depth of 0.87 m when comparing the two methods. The negative percent increase is due to the depth factor having more control than the increased footing size in Victorville (Ade-lanto Loam), which is explained in the results section of the sample application section. From these results it is evident that the depth factor has influence on the bearing capacity calculated from the bearing capacity equation.
6. Conclusions
The method for determining the bearing capacity of a footing in unsaturated soil
500 1000 1500 2000 2500 3000
Bearing Capacity (kN/m2) 0.0
0.2 0.4 0.6 0.8 1.0
P
ro
b
ab
il
it
y
o
f
F
ai
lu
re
B=1.06 m Df=0.60 m
B=1.06 m Df=0.87 m
[image:18.595.55.544.309.506.2]DOI: 10.4236/ijg.2017.810071 1249 International Journal of Geosciences using Monte Carlo simulation is a useful tool for further understanding how unsaturated soil mechanics can be applied in problems faced by practicing engi-neers. The sample study gave evidence that considering unsaturated soils in de-sign can increase the bearing capacity of a footing by at least 2.3 times the bear-ing capacity calculated usbear-ing Meyerhof’s equation. This study considered ho-mogeneous soil with 1-D flow. However, the proposed method can be easily ex-tended for 2-D and 3-D cases.
The sensitivity analysis reinforced the importance of having accurate SWRC or SWCC parameters when using methods relying on the SWRC or SWCC. The sensitivity analysis also confirmed that sites with additional rainfall can still ben-efit from an increase in bearing capacity by considering unsaturated soils. In the case of Levelland, Texas more than 76% increase in bearing capacity was ob-served.
The effect of the depth factor is an important finding from the sensitivity analysis. As the suction increases the value of the cohesion term, the depth factor has a greater influence on the ultimate bearing capacity. This results in smaller factors of increase in bearing capacity when there is an increase in footing size which creates a conservative estimate of the bearing capacity of footings in high matric suction.
References
[1] Terzaghi, K. (1943) Theoretical Soil Mechanics. Wiley, New York. https://doi.org/10.1002/9780470172766
[2] Meyerhof, G.G. (1963) Some Recent Research on the Bearing Capacity of Founda-tions. Canadian Geotechnical Journal, 1, 16-26.https://doi.org/10.1139/t63-003 [3] Steensen-Bach, J.O., Foged, N. and Steenfelt. J.S. (1987) Capillary Induced Stresses—
Fact or Fiction? Proceedings of the 9th European Conference on Soil Mechanics and Foundation Engineering, Budapest, 83-89.
[4] Oloo, S.Y., Fredlund, D.G. and Gan, J.K.-M. (1997) Bearing Capacity of Unpaved Roads. Canadian Geotechnical Journal, 34, 398-407.https://doi.org/10.1139/t96-084 [5] Costa, Y.D., Cintra, J.C. and Zornberg, J.G. (2003) Influence of Matric Suction on
the Results of Plate Load Tests Performed on a Lateritic Soil Deposit. Geotechnical Testing Journal, 26, 219-226.
[6] Rojas, J.C., Salinas, L.M. and Seja, C. (2007) Plate-Load Tests on an Unsaturated Lean Clay. Experimental Unsaturated Soil Mechanics. Proceedings of the 2nd In-ternational Conference on Unsaturated Soils, Weimar, 445-452.
https://doi.org/10.1007/3-540-69873-6_44
[7] Vanapalli, S.K. and Mohamed, F.M.O. (2007) Bearing Capacity of Model Footings in Unsaturated Soil. In: Schanz, T., Ed., Experimental Unsaturated Soil Mechanics, Springer-Verlag, Berlin, Heidelberg, 483-493.
https://doi.org/10.1007/3-540-69873-6_48
[8] Sheng, D. (2011) Review of Fundamental Principles in Modeling Unsaturated Soil Behavior. Computers and Geotechnics, 38, 757-776.
[9] Fredlund, D.G. (2006) Unsaturated Soil Mechanics in Engineering Practice. Journal of Geotechnical and Geoenvironmental Engineering, 132, 286-321.
DOI: 10.4236/ijg.2017.810071 1250 International Journal of Geosciences [10] Mohamed, F.O. and Vanapalli, S.K. (2006) Laboratory Investigations for the Mea-surement of the Bearing Capacity of an Unsaturated Coarse-Grained Soil. Proceed-ings of the 59th Canadian Geotechnical Conference, Vancouver, 219-226.
[11] Fredlund, D.G. and Morgenstern, N.R. (1977) Stress State Variables for Unsaturated Soils. Journal of the Geotechnical Engineering Division, 103, 447-446.
[12] Fredlund, D.G. and Rahardjo, H. (1993) Soil Mechanics for Unsaturated Soils. John Wiley and Sons, Inc., New York.https://doi.org/10.1002/9780470172759
[13] Vanapalli, S.K., Fredlund, D.G., Pufahal, D.E. and Clifton, A.W. (1996) Model for the Prediction of Shear Strength with Respect to Soil Suction. Canadian Geotech-nical Journal, 33, 379-392.https://doi.org/10.1139/t96-060
[14] Jhorar, R.K., van Dam, J.C., Bastiaanssen, W.G.M. and Feddes, R.A. (2004) Calibra-tion of Effective Soil Hydraulic Parameters of Heterogeneous Soil Profiles. Journal of Hydrology, 285, 233-247.
[15] Ito, M. and Hu, Y. (2011) Prediction of the Behavior of Expansive Soils. Pan-Am CGS Geotechnical Conference, Toronto, 2-6 October 2011.
[16] Silva Júnior, A.C. and Gitirana, G.F.N. (2011) Evaluation of Suction and Water Content Fluctuations of a Tropical Soil. Pan-Am CGS Geotechnical Conference, Toronto, 2-6 October 2011.
[17] National Climatic Data Center. U.S. Department of Commerce. NOAA Satellite and Information Service. National Environmental Satellite, Data, and Information Ser-vice. http://www.ncdc.noaa.gov/oa/ncdc.html
[18] Perica, S., Martin, D., Lin, B., Parzybok, T., Riley, D. and Yekta, M. (2011) Precipi-tation-Frequency of the United States. NOAA Atlas, Vol. 4.
http://www.nws.noaa.gov/oh/hdsc/PF_documents/Atlas14_Volume4.pdf
[19] U.S. Geological Survey. National Water Information System: Web Interface.
http://waterdata.usgs.gov/nwis/current/?type=gw&group_key=state_cd
[20] Kulhawy, F.H., Phoon, K.K. and Wang, Y. (2012) Reliability-Based Design of Foundations—A Modern View. Geotechnical Engineering State of the Art and Practice. Geo Congress Oakland California, 102-121.
[21] Van Genuchten, M.T. (1980) A Closed Form Equation for Predicting the Hydraulic Conductivity of Unsaturated Soils. Soil Science Society of America Journal, 44, 892-898.https://doi.org/10.2136/sssaj1980.03615995004400050002x
[22] Bolster, C.H. and Raffensperger, J.P. (2012) MATLAB 2012a Richards, M. The MathWorks Inc., Natick, MA.
[23] Zhang, F. (2010) Soil Water Retention and Relative Permeability for Full Range of Saturation. Prepared for US Department of Energy. Pacific Northwest National La-boratory.
[24] Chowdhury, K. (2006) Preliminary Geotechnical Investigation Report Victorville 2 Hybrid Power Project Victorville. Kleinfelder.
[25] Gonzalez, O.E. (2009) Geotechnical Investigation Proposed New Rail and Roads. Amarillo Testing and Engineering, Inc., Levelland.