Identification of Noisy Utterance Speech Signal using
GA-Based Optimized 2D-MFCC Method and a
Bispectrum Analysis
Benyamin Kusumoputro
1, Agus Buono
2, Lina
3 1Department of Electrical Engineering, Universitas Indonesia, Jakarta, Indonesia; 2Department of Computer Science, Bogor Agricul-tural University, Bogor, Indonesia; 3Department of Computer Science, Tarumanagara University, Jakarta, Indonesia..
Email: [email protected], [email protected], [email protected]
Received 2012
ABSTRACT
One-dimensional Mel-Frequency Cepstrum Coefficients (1D-MFCC) in conjunction with a power spectrum analysis method is usually used as a feature extraction in a speaker identification system. However, as this one dimensional fea-ture extraction subsystem shows low recognition rate for identifying an utterance speech signal under harsh noise con-ditions, we have developed a speaker identification system based on two-dimensional Bispectrum data that was theo-retically more robust to the addition of Gaussian noise. As the processing sequence of ID-MFCC method could not be directly used for processing the two-dimensional Bispectrum data, in this paper we proposed a 2D-MFCC method as an extension of the 1D-MFCC method and the optimization of the 2D filter design using Genetic Algorithms. By using the 2D-MFCC method with the Bispectrum analysis method as the feature extraction technique, we then used Hidden Markov Model as the pattern classifier. In this paper, we have experimentally shows our developed methods for identi-fying an utterance speech signal buried with various levels of noise. Experimental result shows that the 2D-MFCC method without GA optimization has a comparable high recognition rate with that of 1D-MFCC method for utterance signal without noise addition. However, when the utterance signal is buried with Gaussian noises, the developed 2D-MFCC shows higher recognition capability, especially, when the 2D-MFCC optimized by Genetics Algorithms is utilized.
Keywords: 2D Mel-Frequency Cepstrum Coefficients; Bispectrum; Hidden Markov Model; Genetics Algorithms
1. Introduction
Research on automatic speech and voice identification system has attracted much interest in the last few years, motivated by the growth of its applications in many areas such as in diagnosis of a rotor crack [1], classification of unknown radar targets [2], medical disease [3], and for personal and gender identification for security system [4,5]. Speaker based personal identification is the process of determining a registered speaker when an utterance speech signal is provided. In this machine-based speech identification, a gallery of speeches is firstly enrolled to the system and coded for subsequent searching. When an unidentified speech is fetched to the system, a thoroughly comparison with the each coded speech in the gallery, and the identification is then accomplished when a suita-ble match occurs.
Speaker identification system can be divided into two subsystems, i.e., a feature extraction subsystem and a classifier subsystem. The main function of a feature ex-traction subsystem is to transform the input utterance
speech signal into a set of features, while a classifier subsystem have to identify and classify the speaker by comparing the extracted-features from his/her speech signal input with the ones from a set of known speakers database.
The remainder of this paper is organized as follows. In Section 2, we formulate the development of 2D-MFCC filter development. Section 3 presents the optimization of 2D-MFCC filter development by using Genetic Algo-rithms. Section 4 shows the experimental setup and re-sults to demonstrate the effectiveness of the proposed method. Finally, Section 5 is dedicated to a summary of this study and suggestions for future research directions.
2. Speaker Identification System
The focus of this paper is to develop a feature extraction subsystem that could increased the recognition rate of the classifier subsystem (HMM method), to classify an ut-terance speech buried in a harsh noise condition. In the developed method, the feature extracting subsystem is composed of a 2D-MFCC filter design to extract the 2D information contained in the Bispectrum data. The Bis-pectrum data is represented as a 2D vector with MxM
elements in a 2D frequency space of f1 and f2, respec-tively. In this section we will present a brief review of 1D-MFCC filter construction and the developed of 2D-MFCC filter construction for representing the Bis-pectrum data.
We developed further the feature extraction subsystem by using a Genetic Algorithm (GA) method. GA is used to optimize the filter characteristics in such that the dif-ference between the feature vector of a speech signal without noise addition and the feature vector of a speech signal with Gaussian noise addition will be as small as possible. By reducing the difference between these two signals from the same speaker, the possibility of the speaker to be recognized correctly will be higher. As the learning method of the classifier subsystem is important aspect for increasing the recognition rate as in the soft computing methods, in this research, a Hidden Markov Model (HMM) trained by Baum Welch Algorithm is utilized [10].
In the learning phase, samples of the speaker’s speech for a certain phrase of a word is inputted to the speech database, and by using these samples, the classifier sys-tem is trained to develop the reference models for those determined-speakers. In the application phase, the input utterance speech signal is compared with each of the models that has already been stored (as a reference model) on the database, and the classifier decided the winning speaker by determining the highest recognition rate for all the reference models.
2.1. Power Spectrum Analysis with 1D-MFCC
Method
Suppose each tone of an utterance speech signal with an actual frequency f (Hz) is represented in Mel-frequency scale, following the relationship of:
10
ˆ 2595* log 1 700
mel
f f = +
(1)
when the actual frequency f is higher than 1000 Hz, and linear when the actual frequency is lower than 100 Hz.
The 1D-MFCC filter design method provides a trian-gular filter with height of 1 at its middle point, and 0 at their left and right parts for filtering the 1D
Mel-frequency data. As can be seen in the Fig.2, 1D-MFCC filter can be depicted as three vertex points:
(fi-1,0), (fi,1), and (fi+1,0) for the ithfilter, with i = 1,…, M.
It is clearly seen that determining the center point of each filter and the distance between the two adjacent center points of the filter is essential [7,9,10].
The Mel-frequency spectrum coefficients MFSiis
cal-culated as the sum of the filtered 1D Mel-frequency X(j)
that can be expressed as:
1 0
log ( ( )) * ( )
N
i i
f
MFS abs X j H f
−
=
=
∑
(2)where i=1,…,M, M the number of the triangular filter, N
the number of FFT coefficients. The abs(X(j)) is the magnitude of jth of the FFT process of the input utterance signal, and Hi(f) is the height of ith triangular at point f.
The MFCCk value is then calculated by using Discrete
Cosine Transform to transform the Mel-frequency spec-trum coefficients back into its time domain through:
1
* ( 0.5) * * cos
20
M
k i
i
k i
MFCC MFS π
=
−
=
∑
(3)where k=1,…,K the number of coefficients.
2.2. Bispectrum Analysis with 2D-MFCC
Method
Bispectrum analysis of an utterance speech signal can be explained as follows. If {X(k)}, k=0,±1,...,±2 is a real random process, then the cumulants of order 3 is
) 2 , 1 (
3 τ τ
X
c
:
1
2 3
3 1 3
1
1 2
( 1, 2) ( 1) ( 1)!
*
X p
k
p i S
k k
i S i s
C p E X
E X τ E X τ
τ τ −
= ∈
+ +
∈ ∈
= − −
∑
∏
∏
∏
(4)
where the summation extends over all partitions (s1,s2,…,sp), p=1,2,3, of the set of integers (1,2,3).
Bis-pectrum, referred to as cummulant spectra, is a Fourier transform of cummulant sequence, and formulated as:
(
)
1 2
3 1 2 3 1 2
1 1 2 2
( , ) ,
* exp{ ( , )}
x x
C c
j
τ τ
ω ω τ τ
ω τ ω τ
+∞ +∞
=−∞ =−∞ =
−
In the case of stationary process, the cummulant order 3 can be formulated as:
{
}
( , ) ( ) ( ) ( ) 3 1 2x 1 2
c τ τ =E x t x t+τ x t+τ (6) Basically, there are two approaches to predict the Bis-pectrum, i.e. a parametric approach and a conven- tional approach. The conventional approach consists of the fol-lowing three classes, i.e. an indirect technique, a direct technique and a complex demodulates method. Because of its simplicity, in this research, the Bispectrum data is predicted using the conventional indirect method, in which the detail of this algorithm is presented elsewhere [11].
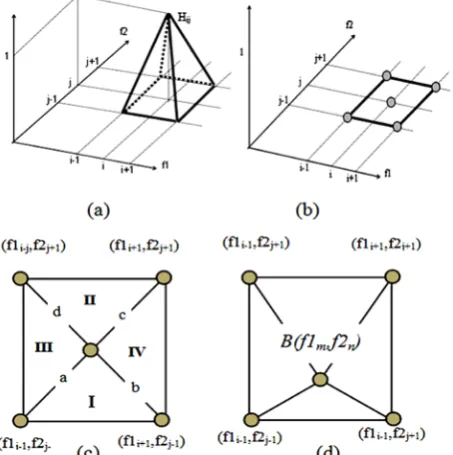
Since Bispectrum data is represented in two dimen- sions of frequency f1and f2, a 2D-MFCC filter, instead of a 1D-MFCC filter, should be used to process the data. To develop 2D-MFCC filter, we firstly construct a 1D- MFCC filter in each of f1 and f2 dimension, with in the first dimension f1 as f1i ; i=1,. . .,M and in the second
dimension f2 as f2j; j=1,. .., N, with M=N. We then
com-bined the two separate 1D-MFCC Hi(f1m) and the other
1D-MFCC Hj(f2n) into an integrated 2D-MFCC
Hij(f1m,f2n) as a pyramid shape, that can be depicted in
Figure 1a. The base of this pyramid shape is a square with its corner positions are (f1i-1,f2j-1), (f1i+1,f2j-1), (f1i-1,f2j+1)
and (f1i+1,f2j+1), respectively, as can be seen in Figure 1b.
The connected lines between the center of the square shape and each of the corner points determined as the
line a, line b, line c and line d, respectively, which its line equation can be written as:
Figure 1. The construction of 2D-MFCC filter and its cal-culation for Bispectrum data B(f1m,f2n).
line a: 1
(
)
1
2 2
2 1 1 2
1 1
j j
i j
i i
f f
f f f f
f f − − − = − − +
(7)
line b: 1
(
)
1
2 2
2 1 1 2
1 1
j j
i j
i i
f f
f f f f
f f − + − = − − +
(8)
line c: 1
(
)
1
2 2
2 1 1 2
1 1
j j
i j
i i
f f
f f f f
f f + + − = − + −
(9)
line d: 1
(
)
1
2 2
2 1 1 2
1 1
j j
i j
i i
f f
f f f f
f f + − − = − + −
(10)
[image:3.595.323.539.96.232.2]Using these lines, the square shape of the pyramid fil-ter can be divided into four quadrants as can be seen in Figure 1c. Suppose we have a Bispectrum data B(f1m,f2n)
[image:3.595.311.540.329.721.2]in the two dimension frequency space such as depicted at Figure 1d. The height of the 2d filter is calculated by firstly determined the quadrant of the data and then cal-culate the Hi,j(f1m,f2n), using algorithm written below.
1. If B(f2n) > f2j-1, and
(
)
1 1
2 2
( 2 ) ( 1 ) 1 2 1 1
j j
n m i j
i i
f f
B f B f f f
f f
−
− −
< − − +
(
)
1 1
2 2
( 2 ) ( 1 ) 1 2 1 1
j j
n m i j
i i
f f
B f B f f f
f f
−
+ −
< − − +
Then B(f1m,f2n) Є quadrant I;
1 ,
1
( 2 ) 2 ( 1 , 2 )
2 2
n j
i j m n
j j
B f f
H f f
f f
− −
− =
− (11)
2. If B(f2n) < f2j+1, and
(
)
(
)
1 1 1 1 2 2( 2 ) ( 1 ) 1 2 1 1
2 2
( 2 ) ( 1 ) 1 2 1 1
j j
n m i j
i i
j j
n m i j
i i
f f
B f B f f f
f f
f f
B f B f f f
f f + + + − −
> − +
−
−
> − +
−
Then B(f1m,f2n) Є quadrant II;
1 ,
1
2 ( 2 ) ( 1 , 2 )
2 2
j n
i j m n
j j
f B f
H f f
f f
+ +
− =
− (12)
3. If B(f1m)>f1i-1, and
(
)
(
)
1 1 1 1 2 2( 2 ) ( 1 ) 1 2 1 1
2 2
( 2 ) ( 1 ) 1 2 1 1
j j
n m i j
i i
j j
n m i j
i i
f f
B f B f f f
f f
f f
B f B f f f
f f − − + − −
> − +
−
−
< − +
−
Then B(f1m,f2n) Є quadrant III;
1 ,
1
( 1 ) 1 ( 1 , 2 )
1 1
m i
i j m n
i i
B f f
H f f
f f −
− − =
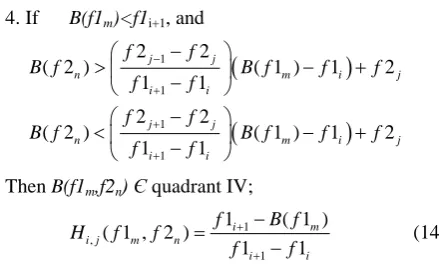
[image:3.595.59.286.476.704.2]4. If B(f1m)<f1i+1, and
(
)
(
)
1 1 1 1 2 2( 2 ) ( 1 ) 1 2 1 1
2 2
( 2 ) ( 1 ) 1 2 1 1
j j
n m i j
i i
j j
n m i j
i i
f f
B f B f f f
f f
f f
B f B f f f
f f − + + + −
> − +
−
−
< − +
−
Then B(f1m,f2n) Є quadrant IV;
1 ,
1
1 ( 1 ) ( 1 , 2 )
1 1
i m
i j m n
i i
f B f
H f f
f f
+
+ − =
− (14)
Using the same calculation such as in the 1D-MFCC method (see Eq. (2)), the Mel-frequency Bispectrum coefficients MFS(i,j) is calculated through:
128 128 1 1 ,
( , ) log[ ( 1 , 2 ) * ( 1 , 2 )]
m n
m n
i j m n
MFS i j B f f
H f f
= =
=
∑∑
(15)
for the 2D-filter height Hi,j(f1m,f2n), with m=1,…,M,
n=1,…,N, and M=N=128. The MFCC(i,j) for 2D-MFCC
is then calculated through 2D-cosine transform, as:
(
)
( 0,5) ( , ) * cos
( 0.5) * cos N N k i j k i
MFCC MFS i j
N k j N π π − = − ∑ ∑ (16)
where k=1,2,3,…,K the number of the coefficient.
3. Optimization of 2D-MFCC Filter using
Genetic Algorithms
The 2D-MFCC method is developed for calculating the
Mel-Bispectrum coefficients MFCCk (in Eq. 21) of
two-dimensions Bispectrum Mel-frequency B(f1m,f2n), by
calculating the 2D-filter height Hi,j(f1m,f2n). Since the
center position of each filter is very essential in deter-mining this 2D-filter height Hi,j(f1m,f2n), optimizing the
position of the filter’s center is necessary for reducing the total error. Thus the goal of the optimization process, i.e. Genetic Algorithms [17], is to minimize the difference between the Mel-Bispectrum coefficients of a speech signal buried with a Gaussian noise and that without a Gaussian noise by designing the optimized 2D-filter height Hi,j(f1m,f2n).
The chromosome representation is constructed as fol-lows. Suppose M is the maximum number of triangular filters on each frequency dimension f1 and f2, respec-tively, and F is the maximum frequency for both each dimensions. Suppose the distance between each of the center position of those filters, as x1, x2, x3, …, xM+1 such
that x1+x2+x3+ …+xM+1=F, where xi is the distance
be-tween ith filter center with the next (i+1)th filter center, with i=2,3,4,…,M. For representing the optimized set of
these filters that will be used in the 2D-MFCC, the dis-tance between two filters center is coded into 7 binary digits. Then the chromosome that represents a set of fil-ters could be coded by binary digit with a length of
7*(M+1) digits, i.e., the first seven digits for x1, the
second seven digits for x2, and so on. A simple
illustra-tion of the chromosome representaillustra-tion process is ex-plained here. Suppose we have four triangular filters on one-dimension frequency domain, with its center position are 2.5, 4.5, 6.5 and 8.0, respectively, with the maximum frequency F is 10. The distance between each of filter’s center are x1=2.5, x2=4.5-2.5=2, x3=6.5-4.5=2,
x4=8-6.5=1.5, and x5=10-8=2. The chromosome then
consists of 5 locus, i.e. x1, x2, x3, x4, and x5, in which each
locus is coded by binary digit with length of 7 to be 7*5=35 digits.
The Fitness Function is calculated so that the deter-mined set of filters produced the Mel-Bispectrum coeffi-cient MFCCk, that have with very similar characteristics
between the input speech signal added with Gaussian and that without a Gaussian noise addition. This fitness func-tion can be mathematically formulated as follow:
) , ( * ) , ( ) , ( * ) , ( ) ( 4 3 2 1 4 2 3 1 B B d B B d B B d B B d i
fitness = (17)
where B1is the Bispectrum data B(f1m,f2n) of the signal
without noise addition, B2 is the Bispectrum data
B(f1m,f2n) of the signal added with 20dB Gaussian noise,
B3is the B2 - B1, B4 is the Bispectrum data B(f1m,f2n) of
20dB Gaussian noise, and d(Bk,Bl) the distance between a
feature vector of Bispectrum data Bk and a feature vector
of Bispectrum data Bl.
A conventional roulette wheel is then used to select the winning chromosome in population. Chance for any chromosome to be selected is proportional to their fitness value. The Crossover technique is then used to alter two chromosomes into their offspring, and in this research, an arithmetic crossover technique is utilized. Suppose two parents X=(x1,x2,x3,…, xN+1) and Y=(y1,y2,y3,…, yN+1) and
by using an arithmetic crossover technique, their offspring are X=(x1,x2,x3,…, xN+1) and Y=(y1,y2,y3,…, yN+1)
with aЄ(0,1).
Mutation is a process of transforming any chromo-some to its offspring through a changing of the internal gene. The mutation is started by selecting a certain chromosome to be mutated, followed by randomly gen-erated two integer numbers p and q, p,q Є [0,N+1] with
[image:4.595.64.284.93.225.2]N the number of the filter used. The mutation process is done by inverting the order of locus between those se-lected points.
that different pattern of the filter-bank are achieved, which is lead to better performance on its application.
4. Experiment Setup and Results
Several experiments were conducted to evaluate the performance of the developed system. The utterance speech signals were recorded as WAV files, conducted by ten Indonesian people, within the ages range of 12 – 28 years old. They were asks to say ’pudesha’ with normaly tones and intuation, but allowed to lengthening their pronountiation. Each speaker uttered 80 times and digitized by sampling rate of 11 kHz within duration of 1.28 second, and each frame that consists of 512 samples per frame is read frame by frame with an overlaps of 256 samples between the adjacent frames. Training/testing paradigm is taken to be 50%: 50%, in which 400 utterance speeches are used as the training set, while the other 400 utterance speeches are taken as the testing data set.
The bispectrum analysis of each frame is conducted by using conventional indirect method as explained in [8]. We calculated the filtered bispectrum of each frame at frequency B(f1m,f2n), and converted into MFCCk
coefficients such as in Eq. 3. Number of coefficients K is determined to be 13, and as the consequence, the bispectrum value of each frame could be written as a feature vector that consists of 13 elements. For a balance comparison, this value is also used for the other feature extraction methods, including the conventional 1D- MFCC method.
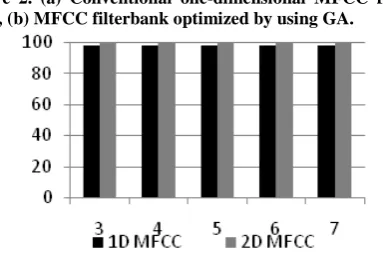
Hidden Markov Model is used as the classifier in all of the experiments conducted here, and three different methods of feature extraction subsystems, i.e. the conventional 1D-MFCC method, 2D-MFCC method and 2D-MFCC- GA method are examined and compared. Figure 7 shows
(a)
(b)
Figure 2. (a) Conventional one-dimensional MFCC filter-bank, (b) MFCC filterbank optimized by using GA.
Figure 3. Comparison of recognition rate between 1D- MFCC with 2D-MFCC for a speech signal without noise addition.
a comparison of recognition rate between 1D-MFCC with 2D-MFCC for uttered speech signal without an addition of a Gaussian noise. Noted that in these experiments, we have used numerous hidden units in the HMM classifier for comparison. Experimental results depicted in Figure 3 show that when the three different methods are used to classify an utterance speech signal without Gaussian noise addition, the recognition rates were very high, i.e. 98.4%, 99.4% and 99.0% for 1D- MFCC, 2D-MFCC and 2D-MFCC-GA, respectively. These comparable results show that the 2D-MFCC method is not necessary be used, when it is used to classify an utterance speech signal without noise addition.
This result also confirmed that the 1D-MFCC method, which was usually used in the conventional system, works appropriate enough to classify speakers when there were no noise disturbances. It is also clearly seen from this figure that the different number of hidden unit used in the HMM classifier has no influence to the rec-ognition rate of the system. In the next experiments af-terward, we have determined to use a three hidden unit HMM, for convenience.
When a Gaussian noise of 20dB is added to the utter-ance speech signal, however, the recognition rate of the 1D-MFCC method is dropped significantly. In order to increase the recognition rate of the systems, we have analyzed the MFCCkvalues for both methods as a
func-tion of each coefficient k = 1,…,K, for both methods; such as depicted in Figure 4. Clearly seen from these figures, that the first coefficient of both methods is very sensitive to the addition of the Gaussian noise, suggested that omitting this coefficient on calculating the MFCC values increases the recognition rate of both methods.
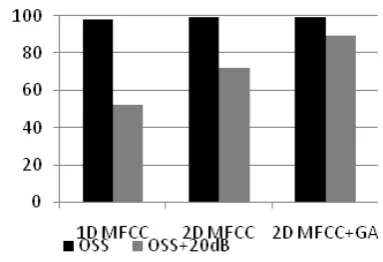
[image:5.595.328.520.102.229.2] [image:5.595.60.287.533.718.2]three feature extraction subsystems without using the first coefficient have shown a higher recognition rates, especially when the 2D-MFCC with GA is utilized.
It is confirmed that removing the first coefficient do not affected the recognition rate of the feature extraction subsystems for the utterance speech signal without Gaus-sian noise addition (OSS: original speech signal without Gaussian noise addition). When the utterance speech signal is buried with a 20dB Gaussian noise (OSS+20dB: original signal with 20dB Gaussian noise addition), however, the maximum recognition rates are 54.4% for the 1D-MFCC method, 70.5% for 2D-MFCC and 88.5% for 2D-MFCC-GA, respectively.
(a) 1D-MFCC
(b) 2D-MFCC
Original signal Original+ noise 20
Original signal
[image:6.595.320.527.115.244.2]Original+ noise 20
Figure 4. Recognition rate comparison of the three methods by removing the 1st coefficient of the MFCC method.
Figure 5. Comparison of the MFCCk coefficients for the original signal and its addition with Gaussian noise 20 dB.
Figure 6. Recognition rate of utterance speech signal with Gaussian noise addition of 20dB using 1D-MFCC, 2D-MFCC and 2D-MFCC-GA methods with K=12.
The next experiment was conducted by buried the ut-terance speech signal in more harsh noise conditions, i.e. 10 dB and 0 dB, respectively. A complete comparison of the recognition rate for the 2D-MFCC and the 2D-MFCC-GA using an utterance speech signal with an addition of Gaussian noise of 20 dB, 10 dB and 0 dB, respectively, is depicted in Figure 6. As shown in this figure, when the Gaussian noise intensity is increasing, the recognition rate is decreased accordingly. It can also be seen that, for all of the Gaussian noise intensity level, the use of GA for optimization of 2D-MFCC for Bispec-trum signal as this feature extraction subsystem always performs better than that of 2D-MFCC without GA.
5. Conclusions
[image:6.595.77.269.600.731.2]to develop more robust speaker identification system, especially under harsh noise environments.
6. Acknowledgement
The Authors would like to acknowledge the Universitas Indonesia for funding this research. Part of this research is also supported by Ministry of National Education of Indonesia.
REFERENCES
[1] Z. Li, J. Sun, J. Han, f. Chu and Y. He, Parametric bis-pectrum analysis of cracked rotor based on blind identifi-cation of time series models, IEEE Proceeding of
Intelli-gent Control and Automation, Vol. 2, 2006,
pp.5729-5733.
[2] I. Jouny, E.D. Garber and R.L. Moses, Radar target iden-tification using the bispectrum: a comparative study,
IEEE Trans. Aerospace and Electronic Systems, Vol. 31,
No. 1, 1995, pp. 69-77.
[3] E.S. Fonseca, R.C. Guido, A.C. Silvestre and J.C. Pereira, Discrete wavelet transform and support vector machine applied to pathological voice signals identification, IEEE
Proceeding of International Symposium on Multimedia,
2005
[4] Z. Wang and H. Wang, Voice identification system based on server, IEEE Proceeding of Intern. Conf. on Computer
Application and System Modeling, Vol. 9, 2010, pp.
384-387.
[5] M. Abdollahi, E. Valavi and H.A. Noubari, Voice-based gender identification via multiresolution frame
classifica-tion of spectro-temporal maps, IEEE Proceeding of Intern.
Joint Conf. on Neural Networks, 2009, pp. 1-4.
[6] T.D. Ganchev, Speaker Recognition, PhD Dissertation, Wire Communications Laboratory, Department of Com-puter and Electrical Engineering, University of Patras Greece, 2005
[7] B. Kusumoputro, A. Triyanto, M.I. Fanany and W. Jat-miko, Speaker identification in noisy environment using bispectrum analysis and probabilistic neural networks,
IEEE Proceeding of Intern. Conf. on Computational
In-telligence and Multimedia Application, 2001, pp.118-123.
[8] C.L. Nikeas and A.P. Petropulu, Higher order spectra
analysis: A Nonlinear Signal Processing Framework,
Prentice-Hall, Inc. New Jersey, 1993.
[9] T.E. Ozkurt and T. Akgul, Robust text-independent speaker identification using bispectrum slice, IEEE Pro-ceeding of Signal Processing and Communications
Ap-plications, 2004, pp. 418-421.
[10] L. Luo and L.F. Chaparro, Parametric identification of systems using a frequency slice of the bispectrum, IEEE Proceeding of Intern. Conf. on Acoustic, Speech and
Signal Processing, Vol. 3, 1991, pp. 3481-3484
[11] L. Rabiner. A Tutorial on Hidden Markov Model and Selected Applications in Speech Recognition.
Proceed-ing IEEE, Vol 77 No. 2. February 1989.
[12] Cornaz, C. dan U. Hunkeler. An Automatic Speaker Recognition System. Mini-Project.
http://www.ifp.uiuc.edu/~minhdo/teaching/speaker_recog
nition, access : August, 15, 2008.
[13] Zbigniew M. Genetic Algorithms + Data structures =