Recognition of Greenhouse Cucumber Disease Based on
Image Processing Technology
Dong Pixia, Wang Xiangdong
College of information science and engineering, ShenYang University of Tchnology, Shenyang 110870 Email: {*Andrew.higgins, Leonie.pearson, Luis.laredo}@csiro.au
Received 2012
ABSTRACT
This paper mainly studies the disease of cucumber downy mildew, powdery mildew and anthracnose leaf image processing and recognition technologies. Application of median filtering method of filtering noise, leaf spot disease of cucumber leaf color range segmentation part extract color feature parameters of the lesion site, characteristic parameters of the shape; extraction texture parameters by using gray level co-occurrence matrix. Based on the shortest distance methods to identify diseases of images. The experimental result showed that the current method on disease recognition accuracy rates more than 96%.
Keywords: Image Processing Cucumber Diseases Shape Features Color Features GLCM
1. Introduction
Study on computer image processing technology began in the 1960 of the 20th century, applied to the production and processing of agricultural products began in the 1970 of the 20th century [1].Automatic diagnosis and identifi-cation of pests, have been the big problem is related to the growth of crops in agrarian production. Scholars have also done a lot of research [2][3].2011 Yuan[4] for crop disease leaves an image with complex background leaf extracts in question, suggested a level set model based on prior information, on the segmentation accuracy will im-prove the speed of evolution and not be a good imim-prove- improve-ment. 2006 Youwen Tian [5], the application of computer image processing technology and support vector machine classification method to study the corn leaf disease identi-fication. Bingqi Chen in 2009 [6] wavelet transform and texture matrix stressed wheat disease site. Calculate the
color of the parts of the characteristic value of the disease; minimum principle color characteristic value difference between the disease image to be tested and inventory dis-ease image retrieves inventory disdis-ease image.
[image:1.595.90.533.570.713.2]The application of image processing technology in greenhouse agriculture greenhouses, refined and intelli-gent in favour of realizing China's agriculture. Applica-tion of image processing technology to identify crop diseases technicians level while avoiding the cause of disease outbreaks as a result of miscalculations, on the other hand more rational control of water, fertilizer, me-dicines, conducive to the sustainable development of the ecological environment. Crop leaves often earlier reflect the disease, this choice of cucumber diseased leaves from the Internet as a research object. Matlab r2010a envi-ronment for cucumber leaf images for image processing and recognition [7].
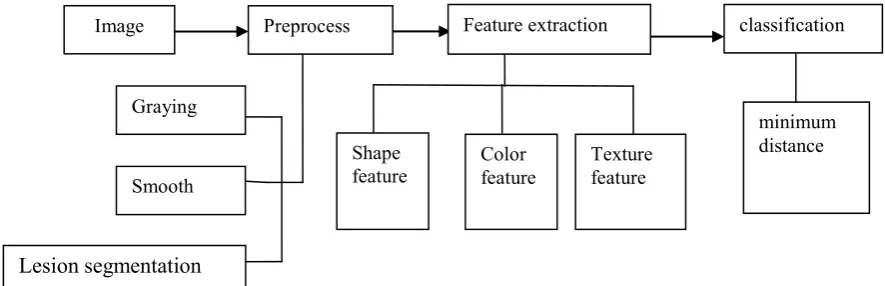
Figure 1 Overall flow chart Shape
feature Color feature Texture feature
minimum distance Graying
Smooth
Lesion segmentation
2. Image Preprocessing
2.1. Graying
Gathered in this study is color images so that you can maximize the guarantee the integrity of the image. But color image storage occupies a larger space, in order to simplify the image we first gray level transformation. Grayscale is RGB color image of the same three compo-nents, a special image. Three RGB grayscale is such a distinctive component of the same color images. Wherein one pixel point change in the range between 0 ~ 255, the same as the description of the color image of the gray scale image nonetheless reflects the entire image as a whole, and the local distribution and characteristics of the chrominance and luminance level. Here we use the weighted average method gray scale image:
f(i,j)=0.30R(i,j)+0.59G(i.j)+0.11B(i.j).
Due to the varying range of the gray image, in order to better handling and identification with the image grays-cale-adjustment, adjust the gray scale uniform into the scope of the original image to 0~255 range.
2.2. Image Smoothing
As the image acquisition to the varying quality, in order to improve the image quality and the processing effect, we conducted a smooth image. Image smoothing method commonly used neighborhood average and median filter-ing method. Neighborhood average method is simple and fast, but at the same time easy to cause the edges of the image blurred. The median filtering method compared to the neighborhood average has a greater advantage in the extraction of edge. So this article using median filtering method.
2.3. Lesion Segmentation
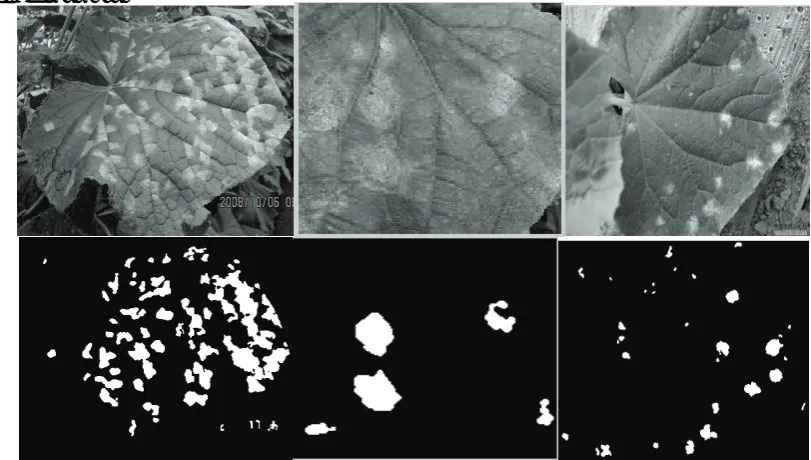
For each disease, we choose ten images to explore their lesion site RGB range. Finally we found powdery mildew R(150-200)G(150-200)B(150-200);downy mildew R(140-190)G(140-200)B(40-120);Anthracnose
[image:2.595.94.500.361.591.2]R(150-230)G(160-200)B(100-140).This range is compa-ratively rough, to satisfy the above range when the pixel values in the image, we will be extracted, and then use the expansion, the operation of the corrosion lesion site. Le-sion segmentation results are shown in the following fig-ure:
Figure 2. From left to right followed by downy mildew, powdery mildew, anthracnose lesion segmentation map.
3. Feature Extraction
3.1. Morphological Feature Extraction
Through disease spot parts of mark for a disease spot complexity, roundness, long axis ratio, degree of rectan-gular these four shape characteristic value.
• Complexity:
2/ e L S=
The complex shape of the lesion degree discrete index e, where S represents the area, L lesion circumference. the unit area of the lesion, perimeter bigger then the greater the value of e, the lesion more complex the shape, i.e. discrete graphics, whereas simply represents graph-ics.
=4 /
C πS L
Roundness, reflect the degree of the lesion area close to the circle. Hence we know C is 0~1. C values closer to 1 lesion area and more nearly circular.
• Major to minor axis ratio: /
a b
Ratio of the length of the major axis length and the minor axis of the ellipse with the region having the same criteria, the second-order central moments.
• Rectangular:
Rec S S= / bounding box−
The rectangle ratio is a lesion area (area) with the le-sion minimum bounding box (bounding box) of the ratio of the area of the reaction to the extent of the lesion ap-proximately rectangular.
An image of the above four values in turn calculating mean, a total of four shape characteristic parameter, as diseases identification parameter value.
3.2. Color feature extraction
The leaf color change is a very intuitive reaction of crop diseases. Simply rely on shape features are not sufficient to accurately identify the disease, after joining the color characteristics conducive to improving the accuracy of judgment and accuracy.
Here we extract the pixel values of the lesion area R/G/B, and the average value of the entire lesion area R/G/B as the final color feature parameters.
3.3. Texture feature extraction
Texture reaction of the pixel space distribution properties, it usually appears as local irregular and macroscopic reg-ular characteristics. At present the extraction methods of texture feature are numerous. We adopted the gray level co-occurrence matrix method.
The joint probability density of the two positions of pixels to define the GLCM.GLCM of an image can re-flect the image gray scale of direction, adjacent interval variations. It is to analyze the image of the local mode and their arrangement rules of the foundation
GLCM statistical spatial having a positional relation-ship of a pair of pixel gray scale on the frequency of the occurrence. Its substance from the image gradation is I am starting (position x, y), statistics distance is d, the gradation of j pixel (x + Dx, Y + Dy) occur at the same time the frequency of P (I, j, d,). The mathematical ex-pression:
P(i, j,d, )
{( , ),( + ,
x y x Dx y Dy f x y i f x Dx y Dy j
) | ( , ) , (
,
) }
θ
=
+
=
+
+
=
(1)In the above formula:
• x,y=0,1,2…,N-1 Is the image pixel coordinates;
• i,j=0,1,…L-1 Is the gray level; • Dx,Dy Is the position offset; • d is the w matrix build step;
• θ is the direction of the W matrix of generating, 0 °, 45 °, 90 ° and 135 °, directions.
For a L-level gray scale M * N image shows that the GLCM matrix L * L. L generally takes 8 or 16. But the gradation of the image is generally in the range of 256. So here we are with their gray scale compression, com-pressed to 16 and GLCM normalized.
The GLCM generated according to the above formula (1) is a symmetric matrix. If the texture is rough, the P matrix is not 0 elements will be concentrated in the vi-cinity of the main diagonal, the detailed texture P array rather scattered distribution of the elements. If the θ di-rection consistent with the grain, then p elements in the array are concentrated near the main diagonal. We choose the texture matrix energy, entropy, contrast the three characteristic parameters identification of mean and variance as the disease's characteristic parameters. • Energy:
2
( , ) ;
i j
ASM =
∑∑
P i jEnergy reflects the image gray scale distribution un-iformity degree and grain weight degree. If the image gray distribution is more homogeneous and the ASM value small; On the contrary, if uneven distribution of gray, the ASM value big. One of the conditions is sym-biosis matrix element concentration distribution, ASM value at large. ASM value big shows that a more uniform and rule change texture model.
• Entropy:
( , )log( , );
i j
ENT= −
∑∑
P i j i jEntropy is a measure of the image with the amount of information; texture information may also belong to the image information, randomness metric, the symbiotic matrix element dispersion distribution, large entropy. It says the image texture in the heterogeneous degree or complexity.
• Contrast:
2 i j ( ) ( , );
CON=
∑∑
i j P i j−The contrast reflects the degree of image sharpness and texture of deep grooves. Texture grooves deeper the greater the contrast, the sharper visual effects; conversely, the contrast is small, when the groove is shallow, the effect is unclear.
4. Disease Identification Based on Minimum
Distance
This study was extracted from 13 characteristic parame-ters, due to the larger data sample value ranges so we will sample characteristic parameters unified normalized. By comparing and experiment 13 parameters of the results are significantly affected by the following four characte-ristic parameters: energy Mean, standard deviation of the entropy, the rectangularity mean, B mean.
Minimum distance classification is by definition un-specified sample to various standard center distances, place samples into the distance the smallest category, with samples of the various training centre as a standard centre. Use the shortest distance method, calculate the characteristic value of disease samples and a standard center distance between different diseases, due to the characteristics of each contribution to the recognition result where we have added weight this, final recognition more accurate.
2 1 1 2 2 3 3 4 4
=
D θ X +θ X +θ X +θ X
In the above formula:
1)
:
θ θ1,,,2 θ θ3 4 is the right value. In this article,four weights in turn take 0.2,0.15,0.1,0.55 optimal rec-ognition results are shown in Table 2, the correct rate. 2): X X X X1, 2, ,3 4 is the distance between the center of
the value and the standard of the sample characteristics. Calculates the distance between the sample image feature value and the standard center, respectively, Be identified diseases with standard diseases are more simi-lar, the distance will be smaller, so that the sample dis-eases classified class In the table below 1-25 is downy mildew sample characteristic value, 26-50 is powdery mildew sample characteristic value, 51-75 is anthrax sample characteristic value.
5. Conclusion
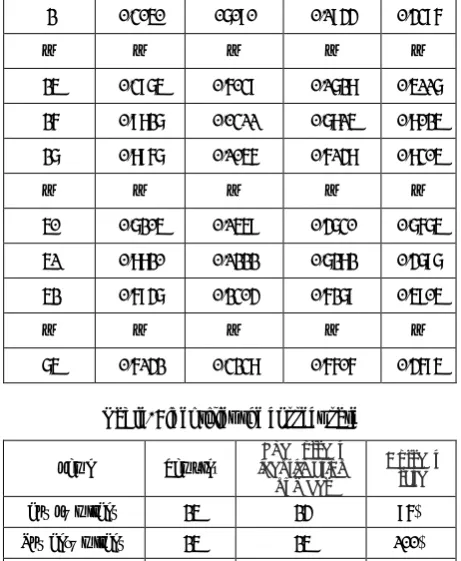
[image:4.595.308.539.86.367.2]This article using image processing and pattern recogni-tion method for identifying the diseases of greenhouse cucumber. Found that the use of the median filter, proba-bly based on the characteristics of the lesion color range extraction lesion method is very effective. Cucumber
Table 1: characteristics of downy mildew, powdery mildew and anthracnose Samples \ eigen-value Energy mean Entropy standard deviation rectangle
mean B mean
1 0.0532 0.8381 0.3354 0.4265
2 0.3050 07090 0.1944 0.4396
… … … … …
25 0.3975 0.6039 0.1728 0.5117
26 0.9827 0.0311 0.7815 0.8025
27 0.8967 0.1056 0.6148 0.8305
… … … … …
50 0.7205 0.1559 0.4730 0.7675
51 0.8820 0.1222 0.7282 0.4797
52 0.6947 0.2304 0.6279 0.5905
… … … … …
75 0.6142 0.3238 0.6606 0.4695
Table2: identifies the correct rate
name Samples identification The correct number
Correct rate
downy mildew 25 24 96%
Powdery mildew 25 25 100%
anthracnose 25 25 100%
downy mildew, powdery mildew and anthracnose signif-icant correct rate based on texture feature parameters, the color characteristic parameters and shape feature parame-ters to identify, to identify the 25 samples of each disease, the correct rate of more than 96%, fully proved that the method is feasible.
REFERENCES
[1] ZhangYing,Mu-nan,XueqingZhang.A foreign facility status and trends of development to fagriculture [J]Agriculture and Technology, 2008
[2] A. H. AI-Abbas, R. Barr, J. D. Hall, F. L. Crane, and M. F. Baumgardner Spectra of Normal and Nu-trient-Deficient Maize Leaves Laboratory for Applica-tions of Remote Sensing
[3] C. H. Bock, P. E. Parker, A. Z. Cook,T. R. Gottwald. plant diseaseAutomated Image Analysis of the Severity of Foliar Citrus Canker Symptoms. The American Phyto-pathological Society, 2009.
[4] Yuan Yuan, Li Miao, Liang Qing, et al. Segmentation method for crop disease leaf images with complex background[J]. Transactions of the CSAE, 2011
[5] Tian Youwen,Wang Lide,Jiang Shuhua. Recognition Of maize disease based on image processing and SVM[J]. Chinese Journal Of Scientific Instrument, 2006
[7] Zhang Qiang,Wang Zhenglin Proficient in MATLAB