Diffusion Tensor Imaging and Its Application to Traumatic
Brain Injury: Basic Principles and Recent Advances
Ping-Hong Yeh1*, Terrence R. Oakes2,3, Gerard Riedy1,2,3,4
1Traumatic Brain Injury Image Analysis Lab, Henry Jackson Foundation for the Advancement of Military Medicine, Rockville, USA 2National Intrepid Center of Excellence, Bethesda, USA
3National Capital Neuroimaging Consortium, Walter Reed National Military Medical Center, Bethesda, USA 4Center for Neuroscience and Regenerative Medicine, Uniformed Services University of the Health Sciences, Bethesda, USA
Email: *[email protected]
Received August 27,2012; revised October 3, 2012; accepted October 14,2012
ABSTRACT
Traumatic axonal injury is a progressive process evoked by shear forces on the brain, gradually evolving from focal axonal alteration and cumulating in neural disconnection. Clinical classifiers and conventional neuroimaging are limited in traumatic axonal injury detection, outcome prediction, and treatment guidance. Diffusion weighted imaging is an advanced magnetic resonance imaging (MRI) technique that is sensitive to the movement of water molecules, providing additional information on the micro-structural arrangement of tissue. Quantitative analysis of diffusion metrics can aid in the localization of axonal injury and/or de(dys)myelination caused by trauma. Diffusion MRI tractography is an ex-tension of diffusion weighted imaging, and can provide additional information about white matter pathways and the integrity of brain neural networks. Both techniques are able to detect the early micro-structural changes caused by Traumatic Brain Injury (TBI), and can be used to increase understanding of the mechanisms of brain plasticity in re-covery after brain injury and possibly optimize treatment planning of patients with Traumatic Brain Injury. This review focuses on the theoretical basis and applied advanced techniques of diffusion weighted imaging, their limitations and applications, and future directions in the application to TBI.
Keywords: Brain Network; Connectivity; High Angular Resolution Diffusion Imaging (HARDI); Diffusion Tensor
Imaging (DTI); Neurocircuitry; Neuroimaging; Traumatic Axonal Injury (TAI); Traumatic Brain Injury (TBI); Tractography; White Matter
1. Introduction
Diffusion Weighted Magnetic Resonance Imaging (DW- MRI) measures the diffusion behavior of water mole-cules and is sensitive to differences related to the micro-structure of brain nerve tissues. Diffusion tensor imaging (DTI) yields estimates of the index of white matter integ-rity and can be further used to extract white matter fea-tures for visualization, i.e. tractography. We summarize the current techniques applied to DTI acquisition and reconstruction, and discuss their applications for the di-agnosis of traumatic brain injury (TBI). Section 1 of this review discusses the conceptual overview of apparent diffusion coefficient (ADC) modeling of DW-MRI and its role in detecting traumatic axonal injury (TAI) of TBI. Section 2 reviews the commonly used DW-MRI se-quences and their acquisition parameters. Section 3 de-scribes the principles of DTI and tractography and dis-cusses post-processing and structural features extracted
from the DTI. Section 4 outlines the key methods of ad-vanced DW-MRI for modeling and resolving multiple fibers. The limitations of DTI, and the advanced DTI techniques are briefly discussed. Section 5 summarizes the DTI findings of TBI and demonstrates DTI applica-tions in revealing disrupted white matter pathways and visualizing fiber “breaks”, and their combination with other new imaging technology. Section 6 briefly outlines the future directions using DTI for TBI study.
In summary, this review presents the theoretical back-ground of DTI techniques and demonstrates their poten-tials for the early diagnosis of TAI and the understanding of pathogenesis of TBI. Readers who are interested in the DTI applications in TBI may skip the technical Sections 2-4 and only focus on Sections 1, 5-6.
1.1. Challenges of Detecting Mild TBI Brain Lesions and Predicting the Outcomes of TAI
Sports-related TBI, particularly in football and boxing, has been in the media spotlight recently. Furthermore, TBI accounts for the majority of explosive blast injury and combat causalities in Operation Enduring Freedom (OEF) in Afghanistan and Operation Iraqi Freedom (OIF) [1], which has led to the well-publicized view that blast- induced TBI (bTBI) is the signature brain injury for com- bat troops in today’s military.
Clinically, TBI can be classified according to the types of injury, i.e. closed (blunt) vs open (penetrating), blast vs nonblast; the impact of injury on brain, i.e. primary (direct injury to the brain at the time of trauma) vs sec-ondary (indirect injury, such as increased intracranial pressure and brain herniation as a result of primary im-pact); and the severity of brain trauma, i.e. mild, moder-ate, severe. However, bTBI is grouped by injuries result-ing from the different physical aspects of the blast phe-nomenon; in short, primary bTBI is from the shockwave, secondary bTBI is from shrapnel, tertiary bTBI is from the blast wind, and quaternary covers the remaining mitigating factors [2]. Moreover, it is becoming apparent that there may be differences in disease progression and symptomatology [3] between impact- and blast-related TBI [4]. However, their underlying mechanisms are not clear.
The neuroimaging appearance of TBI typically is rep-resented by petechial hemorrhage and small, speckled lesions from traumatic microbleeds of shearing capillar-ies along with clinical indications, for instance, loss of consciousness [5]. Mild and moderate TBI patients with closed head blast injury could have extensive non-hem-orrhagic foci at the time of primary impact, but there may be no observable abnormalities using computed tomo-graphy (CT) or only subtle changes on conventional MRI [6,7]. However, these patients may later develop neuro-cognitive deficits and neuropsychiatric problems such as memory loss, concentration difficulties, deceased atten-tion span, headache and seizure in chronic phase of TBI [8,9]. Traumatic axonal injury (TAI) is considered to be responsible for the majority of TBI-related neurocogni-tive deficits [10-12], and is likely related to poor out-come in mild TBI [13].
1.2. Neuroimaging Findings of TAI
TAI occurs in about half of the severe TBI cases [14] and about one-third of the chronic mild TBI cases in profes-sional unarmed combatants (boxers, martial arts, etc.) [15]. TAI refers to white matter damage arising from the consequence of shearing force caused by sudden rota-tional acceleration/deceleration force of head injury [16,17]. The change of brain shape with preservation of brain volume causes shear-strain deformation resulting in multi-focal scattered lesions (micro-bleeds), commonly seen in cerebral gray-white matter junction, deep
subcor-tical WM, centrum semiovale, corpus callosum, the dor-solateral aspect of the upper brain stem, basal ganglion, and cerebellum [16,18,19], where the adjacent tissues have a relatively greater difference in shear modulus (ri-gidity) and thus shear and or tensile strains develop be-tween tissues in concussion [20]. Among these regions, corpus callosum is one of the structures with the highest frequency of lesions [21-25], and hence thought to re-ceive the highest strain concentration after impact [26], especially in the genu and splenium, which has been noted in the very early stage of TBI [27]. The high fre-quency of lesions may be due to the relatively large size of the CC and its proximity to brain ventricles. It may also be due to the relative ease of measuring this promi-nent structure, or to other factors.
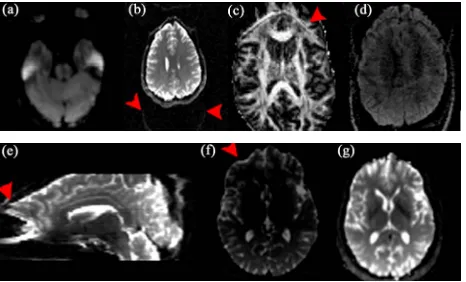
[image:2.595.331.514.345.647.2]Currently there is no standardized way of assessing the severity of TAI or predicting the prognosis of functional outcome of TAI in TBI patients. TBI with TAI is under-diagnosed by conventional imaging techniques [28,29]. Conventional neuroimaging findings cannot fully assess the severity of TAI (Figure 1), nor explain or correlate
the functional deficits of TAI in TBI subjects, let alone predict their long-term outcomes. Recently, T2*-weighted gradient echo (GRE) and fast low angle inversion recov-ery (FLAIR) imaging with high field MR, have been shown useful in detecting traumatic microbleeds (Figure 1), more so in moderate and severe cases of TBI [7,30].
Susceptibility-weighted imaging (SWI) is a novel MR technique that exploits the magnetic susceptibility dif-ferences of various tissues, such as blood, iron and calci-fication [31]. Paramagnetic hemoglobin or other iron containing blood products at different stages of micro-hemorrhages can be detected by SWI due to the signal loss induced by paramagnetic hemoglobin and the re-maining iron in the tissue even after the absorption of fluid after trauma. Depending on the stages of TBI, mi-crohemorrhages are usually displayed as small “black holes” (Figure 2) with possible increased signal intensity
in the periphery in SWI, indicating severe diffuse axonal injury from TBI (Figure 2). Microbleed shearing lesions
indirectly indicate the presence of TAI, which is consid-ered to be the result of shear injury of white matter and blood vessels due to the rotational (non-elastic) deforma-tion of brain tissue by trauma. This is particularly helpful for evaluation of TAI, which is often associated with microbleeds in the deep brain that are not routinely visi-ble on computed tomography or conventional MR imag-ing sequences [32] (Figure 3).
[image:3.595.309.538.86.208.2]However, the neuroimaging findings of milder forms of TBI are not well documented, and these sequences still underestimate the true extent of axonal damage [6]. Several recent studies have investigated the role of diffu-sion MRI and shown promising results in detecting mi-crostructural changes in mild TBI [33-35]; however, these alterations in white matter integrity may not be specific to TBI, and their presence does not necessarily confirm a diagnosis of TAI [36,37].
Figure 2. SWI images of two TBI patients, one was caused by impact injury ((a), the same patient as Figure 1), and the other was blast injury (b). Both SWI images show numer-ous small hemorrhages throughout bilateral hemispheric white matter, which are not visible on the T1, T2-weighted images.
Figure 3. Reconstructed forceps major (left) and inferior fronto-occipital fasciculus (right) overlaid on the SWI im-ages show hemorrhagic foci (arrows). Note the disrupted fiber tracts adjacent to the hemorrhages.
1.3. Basic Physics of DW-MRI and Apparent Diffusion Coefficient (ADC) Mapping
Brownian motion of molecules in a free medium during a given time interval obeys a three-dimensional Gaussian distribution and is described by a “diffusion coefficient” (D), defined by the mass of the molecules, the viscosity of the medium, and the temperature [38]. Diffusion MRI signals are made sensitive to diffusion through the use of a paired magnetic field gradient pulses [39]. Spin preces-sion is proportional to the magnet strength, resulting in dispersion of the phase and signal loss, while another gradient pulse is applied in the same direction but with opposite magnitude to refocus or rephase the spins. The refocusing will not be perfect for protons that have moved during the time interval between the pulses, re-sulting in reduced MRI signal. The diffusion-weighted gradient strength is primarily determined by the gradient amplitude and duration of the gradient pulses, expressed by the b value that is proportional to the product of the square of the gradient amplitude and the diffusion time interval. The distribution of phase shifts, proportional to the net displacement of molecules, results in signal at-tenuation of DW-MRI, which is related to the amplitude of the displacement distribution of water molecules, i.e. slow (or large) diffusion results in smaller (or larger) distribution of phase shifts, and small (or large) signal attenuation. In free-diffusion physical model, the ADC mapping is derived from the equation,
0ADC bln S S
(1)where S0 is the signal intensity without the diffusion
weighting, S is the signal with the diffusion gradient. For DWI, each voxel in physical 3D space has a unique dif-fusion signature representing the sum of all molecular diffusion events occurring within the indicated tissue.
1.4. DTI and Diffusion in Biological Tissues
[image:3.595.65.282.523.669.2]various compartments and barriers of different diffusivi-ties. DTI is assembled in 3-D space to represent DWI as a function of the strength and direction of the magnetic field gradient applied during acquisitions. In white matter, diffusion anisotropy [40], predominantly caused by ax-onal membranes, varied depending on the orientation of fiber tracts relative to the orientation of the diffusion gradient and is influenced by the macro- and micro- structural features of white matter [41]. Thus, the more a directionally specific diffusion gradient is aligned with the axonal fibers, the greater the MRI signal attenuation will be in the voxel. In addition to non-diffusion weighted image, at least six images obtained by applying diffu-sion-sensitizing gradients in six noncollinear directions are required to construct a tensor (six ADC equations), which is represented by an ellipsoid with its principal axes along the eigenvectors. To estimate anisotropic dif-fusion, a 3 × 3 second-rank symmetric tensor, consisting of nine nonzero elements with three nonzero elements along the main diagonal (the eigenvalues), is used to characterize water diffusion properties in three-dimen-sional space.
Neuronal tissue is a fibrillar structure consisting of highly oriented and packed axons that are surrounded by glial cells. Thus, the organized bundles of neuronal tissue have restricted movement of water molecules on a mi-crometric scale to a greater extent in the direction per-pendicular (radial diffusivity) than parallel (parallel dif-fusivity) to the axonal orientation.
2. Technical Considerations of DW-MRI
Acquisition and Optimization
Several methods including the choices of imaging pa-rameters [42-45], the approaches through which tensors are estimated [46,47], and the design of diffusion gradi-ent directions [48-50] have been proposed to optimize DTI. In this section, we focus on discussing the artifacts of single-shot EPI and the optimizing techniques in minimizing these artifacts.
The following considerations apply in general to most of the DTI acquisition strategies. However, it should be noted that for TBI patients, short scan times are impor-tant since these patients frequently find it difficult to lie still in the MRI magnet. This is also an important factor toward emphasizing techniques, which minimize motion, or help to mitigate motion artifacts.
2.1. Acquisition Sequence
2.1.1. Single-Shot Echo-Planar Imaging (SS-EPI)
DWI studies are typically acquired using single-shot echo planar imaging (EPI) techniques in which the entire 2D EPI image is acquired from a single radio-frequency ex-citation pulse, thus minimize inter-shot phase problems.
SS-EPI has the advantages of short scanning time with a relatively high signal-to-noise ratio (SNR), thus mini-mizing the motion artifacts from patient movement and physiologic noises. However, SS-EPI is inherently prone to several limitations. These shortcomings include low spatial resolution, signal loss due to T2 and T2*-weight- ed decay during readout causing hyperintensity on diffu-sion-weighted images as a result of T2 prolongation (T2- shine-through, Figure 4(a)) [51], image warping artifacts
due to fat-water chemical shift (Figures 4(b) and (c)),
unfolding artifact arising from a mismatch between RF sensitivity profiles and distorted acquisition data in the presence of susceptibility effects (Figure 4(d)), magnetic
field in homogeneity and susceptibility related image distortions, such as pileup due to eddy current [52] ( Fig-ures 4(e) and (f)), and motion artifacts due to cardiac
pul-sation, bulk subject movement and mechanical motion. One of the most common sources of ghosting is from the fat-water chemical shift, where a ghost image is shifted by a half of the field-of-view (FOV) in the phase-en-coding direction and a secondary ghost image becomes overlaid on the original image (Figures 4(b) and (c)).
[image:4.595.308.541.528.669.2]Echo misalignments and distortions often lead to Nyquist ghosts, referring to the artifact from EPI traversing k- space in opposite directions on alternate echoes, in im-ages obtained with EPI [53], and should be corrected for. The local susceptibility artifacts of SS-EPI from the mag- netic field inhomogenieties are especially important in high-field scanners and affect structures near dissimilar tissue interfaces, such as close to the bony skull base and air-filled paranasal sinuses. Thus, the evaluation of mi-crostructural changes is limited in these regions using DTI. The phase-encoding direction requires longer time relative to the slice-selection and read-out directions, thus the distortion caused by B0 field inhomogeneity is
most prominent in the phase-encoding direction. More-over, the phase-encoding direction should be set to ante- rior-posterior relative to the patient, but not left-right, to avoid artificially introducing left-right asymmetries in diffusion characteristics.
2.1.2. Optimizing SS-EPI Sequence for Low Magnetic Field (1.5T) and Intermediate-High Magnetic Field
The strength, number, and orientation of the diffusion- sensitizing gradients influence DTI. We briefly review the main topics and strategies for improving the quality of DTI acquired with a SS-EPI sequence in a clinical setting. Readers should refer to other review papers [54,55] for further details.
2.1.2.1. B-Value
The b-value, expressed by:
2 2 2 3
b G
(s/mm2) (2)is proportional to the product of the diffusion time inter-val () and the square of the amplitude of the diffusion gradient (G), where is the gyromagnetic constant. Be aware that this b-value expression is valid for Stejskal- Tanner bipolar gradients [39] only. The time interval between the two gradient pulses () can be varied to en-hance different diffusion properties. A longer increases the distinction between the signals in different directions by magnifying the difference of diffusion displacement between the directions perpendicular to and along the axonal wall, but resulting in lower SNR ratio due to the signal decay by T2 effect. A high b-value of 1000 s/mm2
has become the standard for clinical DTI, while higher values (2000 - 8000) are needed for advanced DWI using high angular resolution techniques (see below).
2.1.2.2. Diffusion-Sensitizing Gradient
Higher gradient amplitudes and slew rates (the switching speed of gradients) are desirable for DWI. However, gra-dient performance exceeding federal dB/dt guidelines risks peripheral nerve stimulation due to induced electric currents. Modern MR scanners are equipped with stronger (~40 - 80 mT/m maximal gradient amplitude, T = Tesla) and faster gradients (~150 - 200 mT/m per millisecond maximal slew rate) [55], which may exacerbate eddy currents and mechanical vibration. Most DWI sequences use bipolar diffusion gradients with positive and negative lobes to cancel eddy currents [52]. Another variant is doubly-refocused SE EPI, which uses two consecutive RF refocusing pulses, each with a pair of bipolar diffu-sion gradients to further break up the time requiring for eddy currents arise and decay [56], hence decreasing artifacts. The drawbacks are the slightly increased TE with reduced SNR and possibly increased susceptibility
artifacts [55]. According to one Monte Carlo simulation study, at least 30 directions are required for a robust es-timation of tensor orientation [57]. However, another study [58] has shown that the number of directions pre-scribed matters less as long as the distribution of direc-tion is optimized, i.e. uniformly distributed along the surface of a sphere by either using an electrostatic repul-sion scheme [45] or through various geometric polyhe-dral schemes [59].
2.1.2.3. Signal-to-Noise (SNR)
The SNR of the non-diffusion image unusually should be larger than 20 in order to avoid bias of tenor parameter estimation. Low SNR leads to over-estimation of sion signals and results in the underestimation of diffu-sivity and possible underestimation of anisotropy in ani-sotropic tissues [55].
2.1.2.4. Motion Artifacts
Bulk motion during the acquisition causes additional dephasing of the magnetization, leading to attenuated DWI signals. Cardiac gating and navigator echo correc-tion techniques can provide images with reduced mocorrec-tion- related artifacts [60,61]. Motion restriction devices such as padding are useful in reducing mechanical vibration from the MRI scanner or patient-related motion artifacts.
2.1.2.5. Voxel Size
The voxel size is one of the major factors affecting the accuracy of fiber tracking (see below for discussion) [62]. An isotropic image with resolution of 2 - 3 mm is desir-able to reconstruct the fiber trajectories in the brainstem [63] and the cortico-cortical association fibers [64]. Sev-eral studies have highlighted the importance of isotropic voxels in order to minimize directional bias [65].
2.1.2.6. Fat Suppression
2.2. Parallel Imaging and Multi-Channel Coils
The SNR benefit at higher field strengths is counteracted by enhanced T2 decay and inhomogeneity effects. Since susceptibility effects scale with field strength, these arti-facts are proportionally worse at higher field. Parallel imaging techniques are routinely applied on modern 3T systems equipped with optimized surface coils, effec-tively balancing these considerations by decreasing the echo-spacing (ES) and TE of the scan. This reduces sus-ceptibility artifact and ameliorates signal loss due to T2 decay on these long ET acquisitions. However, parallel imaging can also induce new kinds of artifacts such as unfolding artifact (Figure 4(d)), which is caused by
wraparound artifacts (aliased) acquired by each receiver element in a multi-channel array, especially in DWI ac-quired with SENSE (Sensitivity Encoding) [70] or AS-SET (Array Spatial Sensitivity Encoding Technique), due to a smaller FOV [55].
3. Post-Acquisition Processing
The rapid readout of k-space in EPI leads to the short bandwidth in the phase-encoding direction, which makes the DWI images very sensitive to off-resonance, suscep-tibility, and eddy-current effects. Although the advanced acquisition techniques using mutli-channel parallel im-aging [69,70] mentioned above have greatly reduced the EPI DWI artifacts, the post-acquisition processing is par-ticularly crucial in minimizing the artifacts introduced in high field MRI, which can greatly improve the accuracy of DTI measures quantification and tractography results.
3.1. EPI Distortion Corrections
3.1.1. Susceptibility Artifacts
The discontinuity of the B0 magnetic field at the air- tissue interfaces of temporal and frontal regions, referred to as field inhomogeneity (∆B), causes signal loss due to a shift of the maximal signal away from the theoretical echo time, leading to geometric distortion due to suscep-tibility effect. The magnitude of voxel displacement (distortion) is proportional to the ∆B and modulated by a term dependent (to a first approximation) on the first derivative of ∆B with respect to the phase encoding di-rection [71].
3.1.2. Eddy Currents
Eddy current cause EPI image distortion, such as scaling, shift and shear artifacts [51] and ADC miscalculations [72,73] because of non-linearity of the gradient system, including diffusion and imaging gradient pulses and their cross-terms [74]. Post-processing registration methods are commonly applied for reducing the eddy currents artifacts [75]. These methods uses a 3D computational
image alignment technique by maximizing mutual in-formation and estimating the parameters of a geometric distortion model inferred from the acquisition principle.
3.1.3. EPI Geometric Distortion Correction
As the geometric distortions are caused in large part by static magnetic field inhomogeneities, the pixel shifts, par-ticularly in the phase-encoding direction, can be unwarped by characterizing the field inhomogeneities from a field map (Figures 4(f) and (g)) [71]. Other strategies have also
been proposed to correct spatial and intensity distortions of EPI, such as using a deformable registration based method to co-register non-diffusion weighted image to a corre-sponding T2-weighted image [76], or using displacement mapping scan based on two EPI scans with opposed phase encoding polarities, resulting in opposite spatial distortion patterns [77,78], together with linear or nonlinear align-ment procedures to determine the displacealign-ment map.
3.2. Quantitative Analysis of DWI Measures
3.2.1. Computation of Single Diffusion Tensor Map
To measure the molecular motion in the direction of a given direction gradient g, the Stejskal-Tanner sequence [39] is commonly used to relate the MR signal attenua-tion S(q,τ) to the statistical properties of the net dis-placement vector R by
T
3 2π 0
, R d
iq r
S q S p r e r F p r
1 (3)where S0 is a reference signal acquired with no diffusion
gradient, τ is the molecular diffusion time, qg 2π
is the displacement reciprocal vector (with is the gy-romagnetic ratio of water proportions and is the du-ration of the diffusion gradients, and p r
is the en-semble average propagator (EAP), which is the probabil-ity of the displacement vector R in R-space. The space ofall possible 3D q vectors is called Q-space (see below Q-space imaging for more discussion). The DTI model assumes the diffusion process to be Gaussian (free diffu-sion, strictly speaking), and the Stejskal-Tanner equation (Equation (3)) becomes
T0
, bg Dg
S g b S e (4)
where g is the unit vector q q , b is the b-value given by Equation (2), and D is the 3 dimensional diffusion
tensor. DTI tensor mapping is typically computed by fitting the logarithmically transformed signal intensities from diffusion weighted images as a function of their corresponding b-matrices [74] according to the multi-variate least squares (LS) regression model,
without diffusion gradient and their logarithmic form (ln), b for b-value matrix, and D is the diffusion tensor [46]. The multivariate LS regression model includes the signal variance as a weighting factor by assuming that the sig-nal variability is only produced by the thermal noise, but not considering the “physiologic noise” arising from subject motion and cardiac pulsation and other artifacts, which do not follow a Gaussian distribution. On the con-trary, the using nonlinear least squares fitting of the sig-nal,
0 exp
S b S bD (6)
where exp is exponential form, has been shown to be better than the linear least square approach in estimating diffusion tensor values [79]. Several “robust” diffusion tensor estimators have been applied to address the “physi-ologic noise” statistically [79,80]. These approaches in-clude using iteratively reweighted least squares in which the weight of each data point is set to be a function of the residuals of the previous iteration using Geman-McClure M-estimator (GMM) method [80], or using GMM for robust estimation of tensors by outlier rejection followed by the final fit with the remaining data points using the constant weights, i.e. the RESTORE (Robust Estimation of Tensors by Outlier Rejection) algorithm [79]. The RESTORE method could potentially remove the cardiac pulsation artifacts during DWI acquisition [79], and has been demonstrated to be better than using the residuals as the only determinants of the weights, i.e. the GMM me- thod.
3.2.2. Derived DTI Measures
3.2.2.1. Diffusivity Measures
A number of related but distinct values can be derived from the DTI measurement. Some contain directional information (vectors), while others are reduced to scalar values at each voxel. The three principal diffusivities (eigenvalues, λ1 > λ2 > λ3)) are the diffusion coefficients
measured along the three principal axes of the ellipsoid. The spatial orientation of fibers can be derived from the eigenvectors of the diffusion tensor. Relative anisotropy refers to the ratio of the variance of the three eigenvalues to their mean. Fractional anisotropy (FA) is the square root of the sum of squares (SRSS) of the diffusivity dif-ferences, divided by the SRSS of the diffusivities, which is a normalized measure (multiplied by square root of 1 2 to have the resulting number to be less than one) that describes the degree of directionality of diffusion.
2 2
2
1 2 1 3 2 3
2 2 2
1 2 3
1 2
FA
(7)
Parallel (λ1) and perpendicular (λ2 and λ3) diffusion di-
rection relative to the fiber orientation are referred to re-
spectively as axial diffusivity, λ =λ1, and radial diffusivity,
2 3
2. Mean diffusivity,
1 23
3, ortrace, λ1 + λ2 + λ3, is an index of the rate of diffusion
av-eraged over all directions.
3.2.2.2. Geometric Measures
The decomposition of the diffusion tensor based on its symmetrical properties can be applied to describe the geometry of the diffusion ellipsoid [81]. The geometry or shape of a tensor can be visualized using a coloring scheme based on the derived shape measures, i.e. linear (
1 2
1 ), planar (
2 3
1 ), and spherical ( 3 1) [81].3.2.3. Quantitative Analysis of DTI Characteristics
3.2.3.1. Region of Interest (ROI) Analysis
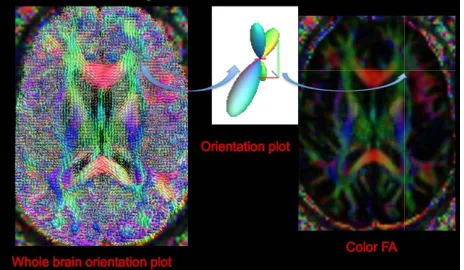
Specification of the anatomical location of the putative group difference is a prerequisite. The conventional ROI approach may lack of statistical power to due to the high degree of intra and inter-subject variation of DTI meas-ures [82], and is unable to attribute changes to a specific tract within regions containing two or more white matter bundles (Figure 5).
3.2.3.2. Histogram Analysis
Conventionally, histograms of DTI measures are nor-malized by the total number of voxels to compensate for the variability of brain size are created. The peak height and peak location of a histogram are used to characterize water motion [83]. This method is easy to implement, but lacks information about specific anatomical location.
3.2.3.3. Whole Brain Voxel-Wise Analysis
[image:7.595.308.540.549.684.2]These operator-independent approaches allow the analy-sis of the entire brain volumes without a priori hypothe-ses regarding the anatomical differences between groups. However, co-registration of low resolution, high contrast
able geometric medial models for tract-specific analysis [91]. The advantages of this approach is to average and combine tensor-based features along directions locally perpendicular to the tracts, thus reducing data dimen-sionality and accounting for errors in normalization [91]. However, lengthy computation is the main drawback for its application to clinical studies.
FA may generate mis-registration, especially in the re-gions of high and low FA, i.e. adjacent to ventricles, due to partial volume effects. Spatial smoothing and statisti-cal correction for multiple comparisons may limit the sensitivity of detecting mild difference across subjects, and the amount of smoothing is arbitrary [84]. Moreover, the localization of specific tracts of the statistical results is not straightforward [82]. Several methods have been developed to address these problems, as discussed in the following sections.
3.4. Tractography
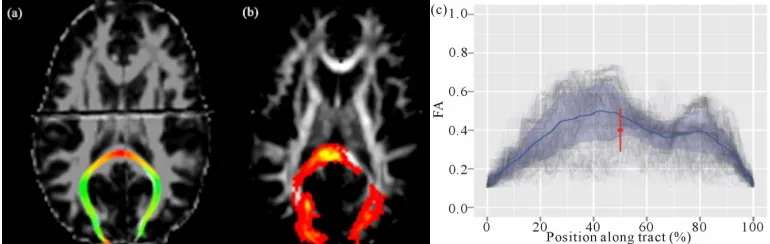
We briefly elaborate the main principles of fiber recon-struction techniques, limitations and their applications in clinical studies. Readers interested in this topic should refer to the excellent review by Mori and van Zijl [92] for more details. Fiber tracking is a reconstruction pro-cedure to trace continuous curves from a direction field, where trajectories or curves represented as sequences of points joined by line segments. In principal, there are two major components of fiber track reconstruction algo-rithms: i) local modeling of the diffusion propagator in each voxel, and ii) integration of the information of fiber orientation information into streamlines structures. Fiber tracking can be classified into two major categories in terms of the extent of fiber tacking and reconstruction algorithms, namely local vs global and deterministic vs probabilistic (Figures 6(a) and (b)). Local methods
re-constructs fibers path-by-path without taking other fibers into account, while global methods [93,94] simultane-ously reconstruct the fibers and find the solutions of the forward problem based on prior knowledge, which best describes the measured DWI data. Fiber reconstruction using local methods is performed in small successive steps, either deterministic or probabilistic. Deterministic (streamline) techniques usually use line propagation and energy minimization approaches, while probabilistic (distributed, stochastic) tractography produces a global likelihood map of paths between the two ROIs, in terms of seed and termination voxels [95,96]. Global methods aim to reconstruct all fiber tracts at a time, which is computationally intense and requires specification of prior fiber information [97,98].
Tract-based spatial statistics (TBSS)
TBSS is an automated technique that combines the strength of both voxelwise and tractography-based analy-ses by using non-linear image transformation of FA im-ages across subjects [85]. The mean FA map is skele-tonized to identify the core of white matter tracts con-taining the highest FA values. FA values from individual subjects are then projected onto the mean FA skeleton image, and voxel-based analysis is applied afterwards. However, the sensitivity to detecting a real effect on the skeleton varies across space, i.e. a local skeleton will have a mean number of neighboring voxels within a given distance that varies according to the local skeleton orientation. This spatial non-stationarity may create false positive results in group comparisons [86].
High Dimensional Deformation
[image:8.595.105.490.587.709.2]High-dimensional tensor-based registration uses sym-metric normalization and diffeomorphic deformation method to register a whole tensor, either done only on the DT images [87,88] or combining T1 images [89], in or-der to reconstruct a study population atlas [87]. The op-timization method seeks a piecewise affine transforma-tion by dividing the image domain into uniform regions and applying an affine transforming. This captures both the image similarities and the smoothness of the trans-formation across region boundaries, by using the conju-gate gradient method. The method has been shown to be robust for investigating white matter pathology in the developing brain [90]. The deformable registration can further combine with fiber tracking and segmentation by fitting the normalized white matter tracts with deform-
After reconstructing fiber tracts, quantitative analysis of DTI measures similar to those mentioned above can also be applied on individual tractograms to evaluate differences across subjects.
3.4.1. Preprocessing
3.4.1.1. Noise Reduction
The precision of fiber tracking depends on the path ge-ometry, and anisotropy calculated from diffusion tensor elements that are susceptible to noise [62]. The intro-duced errors in the estimates of fiber direction accumu-late along the fiber path trajectories and may result in deviations from the ideal, noise-free DTI data [99]. Sev-eral algorithms have been developed to reduce DTI noise, such as a “regularization” based on a low curvature hy-pothesis [72], filtering the closest gradient directions to the direction being processed in the mean squared error sense or an unbiased non-local means using a Rician noise model [100,101], or an approximation of the tensor field based on B-spline fitting [102].
3.4.1.2. ROI Selections
Tractography requires selection of appropriate anchor points, including a seed point, waypoint(s) and/or an endpoint, and also exclusion masks to perform tract dissections. Several pspecified ROI approaches, sometimes re-ferred to as manual “cookbooks” can be found in pub-lished literature [103].
3.4.2. Deterministic Tractography
Deterministic fiber tracking from DTI uses the principal direction of diffusion to propagate trajectories from de-fined seed voxels over the image until termination crite-ria are met, i.e. excessive angular deviation (usually in the range between 40˚ to 70˚ [55]) and minimum voxel FA threshold (usually between 0.1 - 0.2 as typical gray matter [92]).
Several methods have been developed for fiber propa-gation. In conjunction with smoothing and boundary- preserving, anisotropic interpolation of the direction field allows fiber pathways to be tracked in a more reliable and continuous manner. Linear interpolation via local path integration along principal diffusion directions, which is dubbed as fiber assignment by continuous tracking (FACT) [103] using the multiple region-of-interest “vir-tual dissection” [104], still remains the most popular ap-proach of DTI tractography for clinical application [103, 105].
3.4.3. Probabilistic Tractography
Uncertainty in diffusion MR measurements is caused by a variety of sources such as measurement noise and physi-ologic motion [99] as discussed above. Assuming various
probability density functions of the fiber direction esti-mates, probabilistic tractography algorithms estimate path variability by modeling uncertainty of DTI, i.e. ei-genvector dispersion [95,96]. Probabilistic tractography aims to address the limitation of deterministic tractogra-phy, which forces early termination of reconstructed pathways by applying an arbitrary anisotropy threshold, and possibly segmenting the gray matter based on the connectivity distribution [95,106]. Commonly methods used in probabilistic line propagation include random walk simulation using a streamline-based probabilistic index of connectivity (PICo) [95], and a multi-compart-ment ball-and-stick model including one perfectly iso-tropic “ball” compartment and multiple perfectly linear “stick” compartments by assuming same diffusivity in all compartments based on a Bayesian framework [96]. The parameters of multi-compartment models can be used to indicate fiber directions by taking peak interference into account (see below for more discussions). Probabilistic methods produce maps of “connectivity”, which give the probability of this voxel to be connected to a reference position for every voxel of a regular 3D grid. These methods are known to be more resistant to noise. How-ever, a greater number of diffusion directions than de-terministic tractography is needed for accurate fiber tracking, and detailed anatomical knowledge is required to judge the results of reconstructed fibers.
3.4.4. Global Tractography
3.5. Fiber Segmentation and Parcellation
Several methods have been developed to automatically segment and cluster [107] white matter tracts [108] as well as to characterize tract shape parameters [109]. Spe-cifically, these include methods based on the segmenta-tion of a given bundle from a set of initial regions of in-terest (ROIs) [110-112]; neighborhood tractography (NT) optimizing seed point placement by choosing the output with the greatest similarity to a reference tract (heuristic NT) [113] or using probabilistic model to choose the tract that best matches a predefined reference tract (probabilistic NT) [114]; and using atlases in voxel-based classification [115] or in deformable models [116]. For the fiber clustering techniques, points are sampled from a 3-D curve and WM fiber tracts are grouped into bundles based on the anatomic knowledge [108] and/or fiber similarities estimated by similarity metrics [115] or shape statistics [117]. All of these unsupervised clustering techniques must integrate anatomic knowledge and atlas information in order to parcellate the known meaningful fiber tracts.
More recently, methods which address the partial volume effect (PVE) and fiber crossing have been applied to WM tracts segmentation [118], and using Markov Random Field segmentation to model the similarity be-tween neighboring tensors based on a prior shape and direction, referred to as Diffusion-Oriented Tract Seg-mentation (DOTS) [119]. Another automatic reconstruc-tion of white matter pathways, named as TRACULA (TRActs Constrained by UnderLying Anatomy) [120], uses global probabilistic tractography [94] based on the knowledge of prior distributions of the neighboring structures of each pathway, derived from a set of training subjects. The prior probability of a path in the test subject given the training data set is then calculated for each voxel along the path. Path propagation is further con-strained by the results of cortical parcellation and subcor-tical segmentation [121,122] of the test subject, and the posterior distribution of fiber path is estimated via a Markov Chain Monte Carlo algorithm.
However, all atlas-based parcellation methods require accurate co-registration. Since most current developed algorithms are limited to the single diffusion tensor model, and the accuracy of fully parcellation of patho-logic fiber tracts has not been explicitly evaluated.
3.6. Along-Tract Statistics and Tract-Based Morphometric Analysis
Recent studies have demonstrated that tract-based analy-sis of DTI measures across subjects is more reproducible than conventional ROI measurements, i.e. the intricate individual tract dissections are typically collapsed down to a single mean diffusion metric estimate for statistical analysis [123,124]. The eloquence and rich anatomical
information in diffusion imaging can allow researchers and clinicians to examine diffusion metrics and investi-gate subtle (micro)structural changes along fiber tracts [125-127]. This approach allows testing of between- group differences within a specific tract. However, it may suffer from an operator-dependent placement of regions to define the tract starting locations, and also from diffi-culties in resolving the crossing or meeting of different
fiber tracts. Thus, fiber streamlines need to be resampled after proper tract dissection in order to give uniform number of vertices along each streamline and to deter-mine along-tract properties for along-tract analysis [128]. The DTI metrics such as FA, MD and arch length can then be estimated at each-section along the tract in the native diffusion space (Figure 6(c)). Furthermore,
be-tween-group difference can be summarized and visual-ized on mean tract geometry. Tract-specific and tract- profile analyses on the spatially normalized tractograms are an approach, which mitigate individual anatomic variations and enhance the accuracy of connectivity analysis between groups, and the interpretation of results may be more meaningful.
3.7. Reliability and Validation of DW-MRI Measurements and Tractography
Chemical tracing of the human brain in-vivo is difficult, limited to post-mortem case reports. Using the porcine brain, Dyrby et al. [129] quantitatively and qualitatively assessed the anatomical validity and reproducibility of in vitro multi-fiber probabilistic tractography against two invasive tracers. They demonstrated that probabilistic tractography reliably detected specific pathways and concluded that tractography can be a precise tool in studying anatomical brain connectivity. Unfortunately, chemical tracing data is almost inexistent in the human brain, with only limited to case reports [130,131].
3.8. Comparisons of Available DWI Processing Tool Kits
We briefly discuss the available open-source DWI tools and modules that have used widely in the neuroscience field, and their usage in DWI processing. Table 1 shows
a summary of the examples of open-source DWI tools, including brief descriptions of available tools of DWI post-processing mentioned in this review. The authors do not intend to endorse any tool. The reader is encouraged to choose software tools depending on the availability, local support, and applicability to the research question in order to achieve the goals of their application.
4. Newer DW-MRI Techniques
4.1. Pitfalls of DTI
A
central limit theorem [132] ensures a Gaussian distribu-tion of the random phase in the Brownian modistribu-tion. DTI models assume that a Gaussian distribution of the dis-placement probability of water is valid [133], i.e. “Gaus-sian phase approximation” [134]. However, the experi-mental evidence demonstrates a non-Gaussian distribu-tion of restricted diffusion due to the compartmentaliza-tion [135-138], and this phenomenon becomes apparent while using a high b-value (> 2500 s/mm2) [137,138].
The second assumption is a single coherent tract per voxel, i.e. a homogenous Gaussian diffusion population within each voxel. DTI estimation of diffusivity is based on the implicit assumption that diffusion occurs in an unrestricted environment. However, there is always structural hindrance or restriction that prohibits truly free water diffusion, i.e. restricted diffusion depending on cell membranes, organelles, and water compartments [139] and can be probed by applying a higher b-value [140, 141]. Non-Gaussian diffusion is observed when the dif-fusion signal decays in a pulsed gradient experiment, which cannot be explained by the Stejskal-Tanner rela-tion [142,143] This deviarela-tion is observed when special experimental conditions are undertaken: strong gradient pulses and long diffusion times. The typical axon diame-ter is around 1 um, but the typical voxel edge of state of the art DTI is 1 mm, which inevitably leads to averaging over complex fiber configurations such as fiber crossing, fanning (diverging) or touching (kissing).
Although the second-order diffusion tensor model is the most common model of anisotropic apparent diffu-sivity, there are pitfalls of using ADC maxima derived from the single tensor model of DTI to predict fiber di-rection. ADC maxima do not approximate fiber direc-tions when a DW-MRI voxel contains multiple com-partments because the the log-description exp(-bD) in Equation (6), do not add linearly. This has serious impli-cations for DTI tractography, particularly for smaller white matter tracts [144]. The DTI model is sufficient to infer the dominant fiber direction, but not in the areas of tissue partial volume. Thus, DTI fails in regions with several fiber populations aligned along intersecting axes because it cannot be used to map several diffusion maxima at the same time, and it has recently been shown that crossing fibers can be detected in over 90% of white matter voxels [145]. For example, in the frontal region three tracts (the genu of corpus callosum, anterior tha-lamic radiation of internal capsules, and superior longi-tudinal fasciculus) project to the frontal lobe but with different directions (Figure 5).
4.2. Overview of Non-Gaussian Diffusion-Weighted Imaging
To overcome the of limitations of DTI, new acquisition techniques using higher angular resolution of
neighbor-ing diffusion directions, such as high angular resolution diffusion imaging (HARDI) [146] have been proposed to address the issue of non-Gaussian diffusion in multi-fiber systems. In contrast to DTI, HARDI consists of measur-ing the DW signal usmeasur-ing a much larger number of uni-formly distributed DW gradient directions than required for DTI, so as to capture the higher angular frequency features of the DW signal that are not adequately mod-eled by a single diffusion tensor. These non-Gaussian DWI methods can be tentatively classified into two ma-jor categories according to the data analysis techniques i.e. one is based on the Q-space (the space of DW gradi-ent amplitude vectors) and spin propagator analysis without model specification (model-free), and the other relies on the ADC to model the DW signal for multiple fiber population (mixture model) and fiber orientation distribution (FOD). Both Q-space imaging (spin propa-gator) and ADC mixture models with FOD commonly use a larger b-value than DT-MRI (b = 1000 s/mm2 to b
= 3000 s/mm2) to achieve sharper fiber peaks [146,147].
These methods have been shown to reveal more connec-tions between brain regions than using a single tensor model [148].
Q-space is the reciprocal spatial space defined through the Fourier transform of a probability density function (PDF) by specifying the probability distribution of both positions and displacements of water molecules (spins). Model-free Q-space methods estimate the diffusion ori-entation distribution function (dODFs), the diffusion dis-placement PDF of water molecules, in the density of the average relative spin displacement within a voxel (the diffusion propagator) without implying any model of diffusion [149]. The underlying fiber orientation distri-bution function (fODFs) can be further estimated, which is fundamental for tractography. These methods aim to resolve complex white matter architectures by estimating the dODFs [150] of water molecules based on the Fourier transform relationship between the PDF of diffusion dis-placement and the diffusion weighted signal attenuation in Q-space, and to determine the number of fibers present or when pathways branch in the fiber-crossings regions.
and estimation of fiber distributions from the diffusion/ fiber ODFs, i.e. diffusion orientation transformation (DOT) [152], persistent angular structure (PAS) MRI [153], and Q-Ball imaging (QBI) [150]. These model- free Q-space analyses apply more flexible methods to model DW-MRI signal in order to calculate the PDF of spin displacements (the diffusion propagator), and estimate fiber directions without specifying any tensor model.
Instead of using model-free methods, several model- based schemes have been developed to characterize crossing fibers [152-155], estimate the fiber distribution [147], and model the diffusion pattern [136,139]. As-suming the DWI signal measured is the sum of signals from each distinct fiber bundle in a crossing fiber region, ADC mixture models aim to solve the inverse problem to recover the fiber orientations and corresponding volume fractions that best explain the measured DW data. The examples of parametric models are spherical harmonic deconvolution (decomposition) [147,156-161] of the fODFs of HARDI data (fiber models) and multi-tensor models [146,162] based on ADC analysis.
Other multi-fiber reconstruction techniques have been proposed to estimate high order spherical functions such as the Persistent Angular Structure (PAS) [153], the Fi-ber Orientation Density (FOD) [147,156,163,164], the Diffusion Orientation Transform (DOT) [152] and multi- tensor distributions [165]. All these multi-fiber tech-niques are developed to deal with non-Gaussian diffusion process and reconstruct spherical functions with poten-tially multiple maxima aligned with the underlying fiber populations. A good review of all these high order recon-struction techniques can be found in [166].
In summary, many models involve functions on the sphere, i.e. mixture ADC models, ODFs from DSI, DOT, QBI and spherical deconvolution. Spherical harmonics and symmetric higher-order tensors are equivalent bases for such functions. The conversion between spherical harmonics and tensors is as simple as a matrix-vector product, and the investigators should pick the most con-venient forms available at their hands for the tasks.
5. Clinical Applications of Diffusion MRI to
TBI
5.1. Current Concepts of TBI
In the acute and subacute stages, reactive axonal change after trauma is linked to perturbation of the axolemma (increased axolemmal permeability) resulting in disrup-tion of calcium ionic homeostatic mechanisms within injured nerve fibers, and the subsequent activation of the cysteine protease leading to the proteolysis of subaxolem-mal cytoskeletal networks (membrane skeleton) [167, 168].
Tau protein is a highly soluble microtubule-associated
protein, mostly found in neurons rather than non-neu-ronal cells in humans [169]. One of the tau protein’s main functions is to modulate the stability of axonal microtubules through isoforms and phosphorylation [170,171]. Hyperphosphorylation of the tau protein can result in the self-assembly of tangles of filaments, or neurofibrillary tangles (NFTs), which are involved in the pathogenesis of Alzheimer’s disease and other tau pa-thology [172]. Preliminary research indicates that iron deposits due to hemorrhaging, following TBI, may in-crease tau pathology. NFTs are most commonly seen associated with repetitive mild TBI as opposed to one instance of severe traumatic brain injury [173]. Further-more, high levels of tau protein in the fluid bathing the brain are linked to poor recovery after head trauma [174]. However, further work may determine if other blood component factors unrelated to hemorrhages are involved in this TBI-induced augmentation of tau pathology.
Although the pathogenesis of anterograde (down-stream) degeneration/deafferentation and retrograde (up-stream) neuronal responses in the chronic stage after trauma are not well investigated or understood, recent studies of TBI have revealed that traumatic axonal injury is an active progressive deterioration of white and gray matter [175-177]. Therefore, the prevention of secondary injury and early intervention are of great importance if we hope to improve the outcomes following trauma. Diffusion MR maybe a critical component in the early diagnosis and monitoring of traumatic axonal injury. In addition combination with other imaging modalities maybe synergistic for the evaluation of TBI.
5.2. Summary of the Findings in Published Literatures Using Diffusion MRI in TBI
Most DTI studies of TBI evaluate subjects (sub)acutely after injury or at chronic periods. A good review of DTI findings on mild TBI has been published recently by Niogi and Mukherjee [178]. The white matter tracts which tend to show abnormal DTI measures in TBI are the association fibers of fronto-parieto-temporal path-ways such as superior and inferior longitudinal fasciculus, uncinate fasciculus, and anterior corona radiata, and also projection fibers of fronto-limbic network such as cin-gulum bundle and fornix, and the inter-hemispheric con-nection, i.e. genu and splenium of corpus callosum.
5.2.1. Interpretation of DTI Findings and the Possible Corresponding Pathobiologic Mechanisms of TBI
degeneration leading to dys/de-myelination, axonal loss, edema, and loss of tract coherence. Secondary white matter changes (Wallerian) begin with axonal degenera-tion in 2 - 7 days post-injury followed by myelin degra-dation and astrocytes infiltration at 2 weeks post-injury [179,180]. Reduction in diffusion anisotropy by Walle-rian degeneration depends highly on the white matter architecture, i.e. mainly in the regions where fibers are arranged in isolated parallel bundles such as the cerebral peduncle, but not in regions where fibers cross such as the rostral pons [181].
ADC, which is the overall mean-squared displacement of water molecules restricted by organelles and mem-branes, reflects cellular integrity, density and extracellu-lar volume [182,183], and relates to the volume fraction of the interstitial space [183] but is independent of tissue directionality [184]. Intact, organized and myelinated fiber tracts generally have high FA and low ADC from the longitudinal oriented micro-structural elements, i.e. mye-lin sheath, axolemma, neurofilaments and cytoskeleton structures. On the contrary, low FA and high ADC re-flects damaged white matter due to fewer longitudinal oriented elements. An increase of radial diffusivity is thought to signify increased space between fibers, sug-gesting de/dys-myelination [185], whereas a decrease of axial diffusivity suggests axonal injury [186]. However, interpreting axial and radial diffusivities should also take other geometrical properties of diffusion into account and caution is called for [187].
5.2.1.1. Acute and Subacute Stages
Several DTI studies have shown decreased FA and in-creased ADC in acute TBI patient [188-192], possibly explained by disruption of membrane skeleton and/or vasogenic edema due to the increased axolemmal per-meability. Few studies have found increased FA and/or decreased ADC in acute (within 72 hours) [193] and subacute (around 2 weeks post-injury) [35] TBI patients, and the increased FA is primarily due to the decreased radial diffusivity [35]. The FA and other DTI metrics in the cingulum bundles revealed by a serial imaging (four scans) within the first week post-injury in a recent study of eight acute TBI patients showed a complex and het-erogeneous pattern, with FA transiently increased in some participants but memory performance most nega-tively impacted in days 3 - 4 [194]. Possible explanations of these findings are that cytotoxic edema (swollen axon) in the acute stage would cause a net movement of water into intracelluar space, and restrict free water movement, and thus resulting in a decreased ADC, and possibly an increased FA. Although the time course of cytotoxic edema after TBI has not been definitively established, human models have suggested that cytotoxic edema may reach maximal levels at 24 to 48 hours post-injury in
acute stage [195], which can not explain the findings of increased FA observed in subacute TBI. Another expla-nation of an increased FA in subacute TBI is the more coherently oriented fibers on intercepting fiber tracts [196]. In addition, discontinuity on fiber tracks of sub- acute TBI patients have been demonstrated by selecting ROIs within individuals using a normalized tractography method in a recent study [197].
5.2.1.2. Chronic Stage
Several studies have shown a decreased FA and/or an increased ADC in chronic (after several months) TBI patients [25,198-201], suggesting an irreversible patho-logic change in traumatic axonal injury due to a signifi-cant decrease of myelin thickness or axonal density, which maybe the cause of chronic post-concussive symptoms. Interestingly, slightly increased parallel diffusivity after mild TBI coupled with a large change of radial diffusiv-ity after moderate to severe TBI at chronic changes [202] may indicate a change of distribution of overall water content, either interstitial and/or intracellular, in addition to demyelination or axonal loss in chronic TBI. The in-flammatory process with an increase in isotropic tissue (gliosis) and extracellular matrix [181], and decreased extracellular water content will lead to increased parallel diffusivity because of the relatively compacted axons [178]. Nonetheless, the interpretations of DTI measures and claims of the underlying brain tissue changes must be treated with prudence [187].
5.2.1.3. Mild vs Moderate/Severe
Many DTI empirical studies focused only on mild TBI or included several levels of injury severity [203]; however, very few studies had investigated the differences of DTI metrics among the severity of TBI patients. One study on chronic TBI patients (20 mild, 17 moderate and severe) found decreased FA in all thirteen ROIs in the moderate to severe group, but only in the corticospinal tract, sagit-tal striatum, and superior longitudinal fasciculus regions in mild group [202]. Both axial diffusivity and radial diffusivity were increased in the moderate to severe group, but only axial diffusivity was observed in the mild group, suggesting de-, dys-myelination is present in moderate to severe TBI but not mild TBI [202]. Al-though these findings have not been reproduced in any other studies of larger sample size, TAI may form a spectrum of white changes following TBI.
5.2.1.4. Blast vs Nonblast
impact-related TBI. Recent results from experimental studies using animal models of blast exposure have demonstrated that direct blast shockwave is capable of penetrating the calvarium [205] and can induce high strain rates leading to structural deficits such as axonal membrane disruption [206], myelin disruption, and neu-ronal death [207-209]. Hypotheses such as pressure wave transfer via the great vessels of the circulatory system (the rippling effect) have been proposed as mechanisms to inflict white matter deformation and to cause secon-dary systemic tissue response of blast injury [210,211]. The rippling effect postulates that blast waves ripple through the torso up into the brain through the major great vessels [208,210] leading to shear-strain deforma-tion and resulting in multi-focal scattered lesions com-monly seen in cerebral gray-white matter junction, the deep subcortical WM tracts, centrum semiovale, the dorsolateral aspect of the upper brain stem, basal gan-glion, and cerebellum [16,18,19]. It is reasonable to as-sume blast TBI has relatively broad or more heterogene-ous distribution of white matter abnormalities compared to nonblast TBI; however, to the best of our knowledge, there is no literature to support this hypothesis.
5.2.1.5. Longitudinal Changes and Recovery
It is becoming clear that many of the sequelae of TBI represent a dynamic process with brain structural and functional changes following years after the event, and not merely a direct consequence of the acute trauma. Currently, only a few longitudinal studies of humans using DWI have been published, and all involved small sample sizes. One study has shown the normalization of acute white matter injury by reversing a high FA as a result of normalizing a low radial diffusivity in a 3 - 5 months follow up after acute trauma [35]. One study has revealed the reversal of low FA, with a nadir at approxi-mately six months; and an increase of ADC in the poste-rior corpus callosum, which corrected with improving motor function [212]. Another study with a relatively larger sample size of 30 mild TBI patients has shown a progressive deterioration of microstructural white matter integrity in a year follow up after the event of trauma [213]. A recent study of 34 TBI patients followed up at 2 weeks, 3 months, and 6 months post-injury showed het-erogeneous spatial pattern of low or high FA abnormali-ties among patients, with high FA in the deep and sub-cortical white matter suggesting evidence of compensa-tory mechanism of injury or plasticity following injury [214]. More interestingly, increased FA and reduced mean diffusivity may suggest a poorer outcome of TBI [203]. Nevertheless, studies with larger sampling on sev-eral time points are necessary to elucidate the mecha-nisms of central nervous system degeneration, repair and brain plasticity after TBI.
5.3. Integration of DTI and Other Neuroimaging Modalities
Several other MRI techniques have demonstrated the potential to improve the diagnosis of traumatic axonal injury and possible outcome prediction, i.e. MR spectro-scopic imaging for brain metabolites, perfusion imaging for cerebral flow change, susceptibility weighted imaging (SWI) for microhemorrhages, and FDG-PET for glucose utilization [215,216]. SWI exploits the magnetic suscep-tibility differences of various tissues, such as blood, iron and calcification, and is sensitive to microhemorrhages detection [31]. Integrating SWI and DWI promises to be a standard way of evaluating traumatic axonal injury (Figure 3). fMRI studies help elucidate the
complemen-tary aspects of brain structure and function. However, a recent study was unable to demonstrate that the presence of functional abnormalities in fMRI correlated with the abnormal DTI measures in sport-related mild TBI sub-jects [217]. Nevertheless, advances in multimodal neu- roimaging hold promise for better detection, characteri-zation, and monitoring of objective brain changes in TBI.
5.4. Correlation of Diffusion MRI and Neurocognitive Function
Complex cognitive processes such as attention, executive functions, and memory, all require intact white matter tracts among frontal, parietal, and medial temporal lobes, which may be disrupted following brain trauma. Recent DTI studies suggest that the cognitive impairment fol- lowing trauma may correlate with the severity of white matter injury [218]. Several large-scale cognitive net- works, such as language pathways, limbic pathways, dorsal fronto-parietal networks, visual networks, and their associations with normal neurological functions and neuropsychiatric deficits have been investigated using diffusion tractography [219]. Nevertheless, understand- ing the relationship between normal neuropsychological functions and diffusion measures in healthy subjects is needed to evaluate the structure-function relationships in TBI patients.
6. Future Direction and Conclusions
Relating structural connectivity with functional activity is of fundamental importance to understanding the patho- physiology of TBI. However, early diagnosis and “visu-alization” of traumatic axonal injury in mild TBI is still challenging. Identification of fiber “breaks” and the rela-tionship of the structural abnormalities to functional ef-fective connectivity together may provide converging evidence about the alteration of neural networks in TBI.
re-solving crossing fibers. Advanced diffusion MRI tech-niques both in acquisition and post-processing can help resolve such conflicting results and provide insights into neural connectivity that have not been previously possi-ble in vivo.
In summary, with the help of advanced diffusion MR imaging techniques, both hardware and software, and the integration of other neuroimaging modalities, we are optimistic about more readily visualizing the lesions of traumatic axonal injury in the near future. Further longi-tudinal studies using advanced DWI techniques with higher resolution tractogaphy in a synergistic approach are expected to provide insight in understanding the pathogenesis and recovery of TBI. Thus, this neuroi-maging information could be used to formulate preven-tion and intervenpreven-tion strategies in treating TBI patients, and to predict their future behavioral outcomes.
7. Acknowledgements
This research was partly supported by CDMRP to USUHS (CNRM) Grant PT074437 (G.R.), and Brain Behavior Research Fund Grant 18317, NASRAD Young Investigator Award (P.-H. Yeh).
8. Declarations
The views expressed in this article are those of the author and do not reflect the official policy of the Department of Army/Navy/Air Force, Department of Defense, or USA Government.
REFERENCES
[1] G. Ling, F. Bandak, R. Armonda, G. Grant and J. Eck-lund, “Explosive Blast Neurotrauma,” Journal of Neuro-trauma, Vol. 26, No. 6, 2009, pp. 815-825.
doi:10.1089/neu.2007.0484
[2] Y. C. Chen, D. H. Smith and D. F. Meaney, “In Vitro Approaches for Studying Blast-Induced Traumatic Brain Injury,” Journal of Neurotrauma, Vol. 26, No. 6, 2009, pp. 861-876. doi:10.1089/neu.2008.0645
[3] J. E. Kennedy, F. O. Leal, J. D. Lewis, M. A. Cullen and R. R. Amador, “Posttraumatic Stress Symptoms in OIF/ OEF Service Members with Blast-Related and Non-Blast- Related Mild TBI,” NeuroRehabilitation, Vol. 26, No. 3, 2010, pp. 223-231.
[4] C. L. Mac Donald, A. M. Johnson, D. Cooper, et al., “De-tection of Blast-Related Traumatic Brain Injury in US Military Personnel,” The New England Journal of Medi-cine, Vol. 364, No. 22, 2011, pp. 2091-2100.
doi:10.1056/NEJMoa1008069
[5] J. H. Adams, D. Doyle, I. Ford, et al., “Diffuse Axonal Injury in Head Injury: Definition, Diagnosis and Grad-ing,” Histopathology, Vol. 15, No. 1, 1989, pp. 49-59. doi:10.1111/j.1365-2559.1989.tb03040.x
[6] Y. Ezaki, K. Tsutsumi, M. Morikawa and I. Nagata,
“Role of Diffusion-Weighted Magnetic Resonance Imag-ing in Diffuse Axonal Injury,” Acta Radiologicaogica, Vol. 47, No. 7, 2006, pp. 733-740.
doi:10.1080/02841850600771486
[7] T. H. Le and A. D. Gean, “Neuroimaging of Traumatic Brain Injury,” Mount Sinai Journal of Medicine, Vol. 76, No. 2, 2009, pp. 145-162. doi:10.1002/msj.20102 [8] H. Lee, M. Wintermark, A. D. Gean, et al., “Focal
Le-sions in Acute Mild Traumatic Brain Injury and Neuro-cognitive Outcome: CT versus 3T MRI,” Journal of Neurotrauma, Vol. 25, No. 9, 2008, pp. 1049-1056. doi:10.1089/neu.2008.0566
[9] R. Scheid, K. Walther, T. Guthke, C. Preul and D. Y. von Cramon, “Cognitive Sequelae of Diffuse Axonal Injury,” Archives of Neurology, Vol. 63, No. 3, 2006, pp. 418-424. doi:10.1001/archneur.63.3.418
[10] E. D. Bigler, “Neuropsychology and Clinical Neurosci-ence of Persistent Post-Concussive Syndrome,” Journal of the International Neuropsychological Society, Vol. 14, No. 1, 2008, pp. 1-22. doi:10.1017/S135561770808017X [11] C. Konrad, A. J. Geburek, F. Rist, et al., “Long-Term
Cognitive and Emotional Consequences of Mild Trau-matic Brain Injury,” Psychological Medicine, Vol. 41, No. 6, 2011, pp. 1197-1211.
[12] T. M. Talavage, E. Nauman, E. L. Breedlove, et al., “Functionally-Detected Cognitive Impairment in High School Football Players without Clinically-Diagnosed Concussion,” Journal of Neurotrauma, 1 October 2010. doi:10.1089/neu.2010.1512
[13] A. Messe, S. Caplain, G. Paradot, et al., “Diffusion Ten-sor Imaging and White Matter Lesions at the Subacute Stage in Mild Traumatic Brain Injury with Persistent Neurobehavioral Impairment,” Human Brain Mapping, Vol. 32, No. 6, 2011, pp. 999-1011.
doi:10.1002/hbm.21092
[14] B. Jennett, J. H. Adams, L. S. Murray and D. I. Graham, “Neuropathology in Vegetative and Severely Disabled Patients after Head Injury,” Neurology, Vol. 56, No. 4, 2001, pp. 486-490. doi:10.1212/WNL.56.4.486
[15] A. Costanza, K. Weber, S. Gandy, et al., “Review: Con-tact Sport-Related Chronic Traumatic Encephalopathy in the Elderly: Clinical Expression and Structural Substrates,” Neuropathology and Applied Neurobiology, Vol. 37, No. 6, 2011, pp. 570-584.
doi:10.1111/j.1365-2990.2011.01186.x
[16] P. M. Parizel, Ö. Özsarlak, J. W. Van Goethem, et al., “Imaging Findings in Diffuse Axonal Injury after Closed Head Trauma,” European Radiology, Vol. 8, No. 6, 1998, pp. 960-965. doi:10.1007/s003300050496
[17] P. M. Parizel, J. W. Van Goethem, Ö. Özsarlak, M. Maes and C. D. Phillips, “New Developments in the Neurora-diological Diagnosis of Craniocerebral Trauma,” Euro-pean Radiology, Vol. 15, No. 3, 2005, pp. 569-581. doi:10.1007/s00330-004-2558-z