http://www.scirp.org/journal/ijmpcero ISSN Online: 2168-5444
ISSN Print: 2168-5436
DOI: 10.4236/ijmpcero.2017.64038 Nov. 23, 2017 421 Int. J. Medical Physics, Clinical Engineering and Radiation Oncology
Dose Comparison between Eclipse Dose
Calculation and Fast Dose Calculator in Single-
and Multi-Field Optimization
Intensity-Modulated Proton Therapy Plans
with Various Multi-Beams for Brain Cancer
Ryosuke Kohno
1,2, Wenhua Cao
1, Pablo Yepes
1, Xuemin Bai
1, Falk Poenisch
1,
David R. Grosshans
3, Tetsuo Akimoto
2, Radhe Mohan
11Department of Radiation Physics, The University of Texas MD Anderson Cancer Center, Houston, TX, USA 2Division of Radiation Oncology and Particle Therapy, Exploratory Oncology Research & Clinical Trial Center,
National Cancer Center Hospital East, Kashiwa, Japan
3Department of Radiation Oncology, The University of Texas MD Anderson Cancer Center, Houston, TX, USA
Abstract
The purpose of this study was to grasp current potential problems of dose er-ror in intensity-modulated proton therapy (IMPT) plans. We were interested in dose differences of the Varian Eclipse treatment planning system (TPS) and the fast dose calculation method (FDC) for single-field optimization (SFO) and multi-field optimization (MFO) IMPT plans. In addition, because some authors have reported dosimetric benefit of a proton arc therapy with ultimate multi-fields in recent years, we wanted to evaluate how the number of fields and beam an-gles affect the differences for IMPT plans. Therefore, for one brain cancer pa-tient with a large heterogeneity, SFO and MFO IMPT plans with various mul-ti-angle beams were planned by the TPS. Dose distributions for each IMPT plan were calculated by both the TPS’s conventional pencil beam algorithm and the FDC. The dosimetric parameters were compared between the two al-gorithms. The TPS overestimated 400 - 500 cGy (RBE) for minimum dose to the CTV relative to the dose calculated by the FDC. These differences indicate clinically relevant effect on clinical results. In addition, we observed that the maxi-mum difference in dose calculated between the TPS and the FDC was about 900 cGy (RBE) for the right optic nerve, and this quantity also has a possibility to have a clinical effect. The major difference was not seen in calculations for SFO IMPT planning and those for MFO IMPT planning. Differences between the TPS and the FDC in SFO and MFO IMPT plans depend strongly on beam How to cite this paper: Kohno, R., Cao, W.H.,
Yepes, P., Bai, X.M., Poenisch, F., Grosshans, D.R., Akimoto, T. and Mohan, R. (2017) Dose Comparison between Eclipse Dose Calculation and Fast Dose Calculator in Single- and Multi- Field Optimization Intensity-Modulated Proton Therapy Plans with Various Multi-Beams for Brain Cancer. International Journal of Medical Physics, Clinical Engineering and Radiation Oncology, 6, 421-432.
https://doi.org/10.4236/ijmpcero.2017.64038
Received: October 17, 2017 Accepted: November 20, 2017 Published: November 23, 2017
Copyright © 2017 by authors and Scientific Research Publishing Inc. This work is licensed under the Creative Commons Attribution International License (CC BY 4.0).
DOI: 10.4236/ijmpcero.2017.64038 422 Int. J. Medical Physics, Clinical Engineering and Radiation Oncology arrangement and the presence of a heterogeneous body. We advocate use of a Monte Carlo method in proton treatment planning to deliver the most precise proton dose in IMPT.
Keywords
Fast Dose Calculator, Monte Carlo, Intensity-Modulated Proton Therapy, Single-Field Optimization (SFO), Multi-Field Optimization (MFO)
1. Introduction
Proton beam therapy is one of the most advanced technologies in cancer care [1]. Its main advantage over conventional photon beam therapy is that it provides an enhanced possibility of tumor control while minimizing irradiation to surround-ing normal tissues due to the proton’s Bragg peak with a sharp distal fall-off. Cur-rently, pencil beam scanning (PBS) techniques [2] [3] [4] are the most precise forms of proton therapy that have been developed, and they are utilized clinical-ly in several facilities. Among these techniques, intensity-modulated proton ther-apy (IMPT) [5] [6] delivers the most conformal dose.
In order to realize these precise therapies, proton dose distributions in the pa-tient’s body with heterogeneities have to be predicted with considerable accuracy in treatment planning. Currently, the treatment planning system for the PBS rou-tinely uses a pencil beam algorithm [7] [8] because of the short computation time and because the pencil beam algorithm can perform well for homogeneities. How-ever, it is common knowledge that the algorithm’s accuracy deteriorates for tar-gets with large heterogeneities [9] [10] [11].
In contrast, the full Monte Carlo (MC) methods [12] such as GEANT4 [13] and MCNPX [14] can provide accurate dose estimations in even the presence of large heterogeneities because they take into account the basic physical processes in medium and track paths of individual primary protons and secondary particles. However, the MC methods require computation times of hundreds of CPU hours, and are not appropriate in clinical use.
Therefore, simplified Monte Carlo [9] [10] [11] methods and VMC pro [15] dedicated to proton beam therapy have been developed to reduce the calculation time. Yepes et al. also developed the fast dose calculator (FDC) [16] [17], which used a Monte Carlo track-repeating algorithm based on GEANT4. This FDC has been already validated by GEANT4 for IMPT plans [18]. Yepes et al. reported that the FDC can calculate dose distributions in less than 5 minutes per patient and is suitable for routine clinical work.
DOI: 10.4236/ijmpcero.2017.64038 423 Int. J. Medical Physics, Clinical Engineering and Radiation Oncology errors in the boundary region of a thick heterogeneous material having an edge parallel to the beam central axis [9]. This means that dose error depends on a location of a target, the presence of a heterogeneity and beam direction. Dose differences between the TPS and actual irradiation in these plans are expected [19].
In the present study, we evaluated dose differences of the TPS and the FDC in single-field optimization (SFO) and multi-field optimization (MFO) IMPT [20] for brain cancer with heterogeneity, in order to grasp current potential problems of dose error in IMPT plans designed by the TPS. Additionally, because a proton arc therapy with ultimate multi-fields has dosimetric benefit [21] [22], we wanted to know how the number of fields and beam angles affect the differences for IMPT plans. Therefore, SFO and MFO IMPT plans with various multi-angle beams were also evaluated by the FDC.
2. Materials and Methods
[image:3.595.274.473.461.684.2]A patient treated with passively scattered proton therapy at the University of Texas MD Anderson Cancer Center was selected for the study from a sample of typical cases. The clinical case with critical organs adjacent to the target and tar-get surrounded by a heterogeneity which consists of bone, cavity, and soft tissue was that of a patient with grade III anaplastic astrocytoma.
Figure 1 shows the outlining of the target volumes and organs at risk (OARs) for the brain cancer treatment plan on a computed tomography slice. The prescribed doses were 5700 and 5000 cGy (RBE) (RBE = relative biological effectiveness) to the gross tumor volume (GTV) and clinical target volume (CTV), respectively, in 30 fractions. The maximum dose constraint for the chiasma, both optic nerves,
DOI: 10.4236/ijmpcero.2017.64038 424 Int. J. Medical Physics, Clinical Engineering and Radiation Oncology and the brainstem was 5400 cGy (RBE). The optic chiasma, left optic nerve, and brainstem were at the edge of the target volumes.
Proton beam irradiation needs to sacrifice GTV and CTV coverage to main-tain normal tissue constraints and avoid or minimize end of range in these criti-cal structures. SFO and MFO IMPT planning were done with the same optimi-zation conditions on the TPS. We used coplanar beams of 3, 4, 5, 6, and 9 treat-ment fields in the SFO and MFO IMPT plans, as shown in Table 1. Left anterior oblique beams from 40 degrees to 160 degrees were mostly used because of the locations of the target, optic chiasm and brainstem. Plan F and L were considered extreme cases because of the large number of beams and the 40-degree beam an-gles. The RBE value we used was the conventional uniform RBE value of 1.1. The FDC algorithm [16] [17] uses a database of pre-generated tracks to calculate IMPT dose distributions in any material, as described previously [18].
In order to evaluate the difference of dose calculation algorithms, SFO and MFO IMPT plans designed by the TPS were compared with those designed by the FDC. The comparative analysis for each dose distribution in regions of in-terest was done using the following dosimetric parameters: minimum dose, max-imum dose, mean dose. For the CTV, doses to 95% and 5% of the clinical target volume (D95 and D5), heterogeneity index (HI), and conformity index (CI) were also added. HI and CI were proposed by the Radiation Therapy Oncology Group in 1993 [23], and described as HI = maximum dose in CTV/prescription dose and CI = prescription isodose volume/volume of CTV.
3. Results
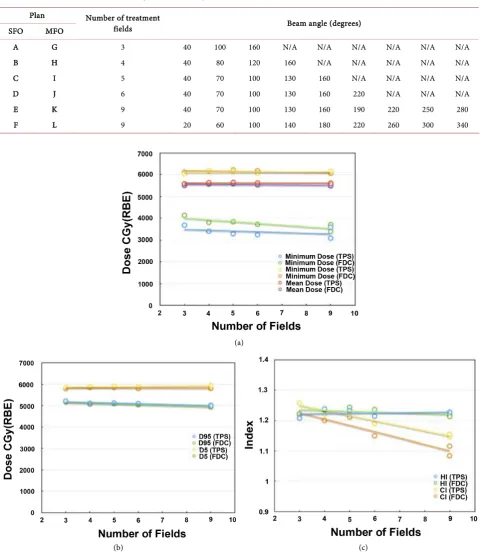
Figure 2 shows (a) minimum, maximum, and mean dose, (b) D95 and D5, and (c) HI and CI obtained by the TPS and the FDC for the CTV in the SFO IMPT plans. In Figure 2(b), the dosimetric parameters except for minimum dose by the FDC did not depend on the number of fields. On the other hand, differences for minimum dose depend on it, and the difference in plan F was 119 cGy (RBE) of the minimum difference. Minimum doses calculated by the TPS were smaller than 390 cGy (RBE) whereas those calculated by the FDC were always higher. Av-erage differences of maximum and mean dose between the two algorithms were −16 ± 66 (1 SD) and 81 ± 20 cGy (RBE), respectively.
In Figure 2(b), the D95 values calculated by the two algorithms tended to de-crease slightly with the number of fields. D5s, however, were almost constant for each field number. Average differences of D95 and D5 between the two algo-rithms were 1.0% and 1.3%. In Figure 2(c), HIs were almost constant for each number of fields, but CIs tended to improve considerably with the number of fields. The average difference in HI between the two algorithms was −0.3% ± 1.2%. CI by the FDC decreased 3.2% ± 1.5% as compared with those by the TPS.
DOI: 10.4236/ijmpcero.2017.64038 425 Int. J. Medical Physics, Clinical Engineering and Radiation Oncology Table 1. Treatment fields and beam angles for each single-field optimization (SFO) and multiple-field optimization (MFO) plan.
Plan Number of treatment
fields Beam angle (degrees)
SFO MFO
A G 3 40 100 160 N/A N/A N/A N/A N/A N/A
B H 4 40 80 120 160 N/A N/A N/A N/A N/A
C I 5 40 70 100 130 160 N/A N/A N/A N/A
D J 6 40 70 100 130 160 220 N/A N/A N/A
E K 9 40 70 100 130 160 190 220 250 280
F L 9 20 60 100 140 180 220 260 300 340
(a)
(b) (c)
Figure 2. (a) Minimum, maximum, and mean dose; (b) D95 and D5; and (c) HI and CI for the CTV obtained by the TPS and the FDC in single-field optimization (SFO) IMPT plans.
DOI: 10.4236/ijmpcero.2017.64038 426 Int. J. Medical Physics, Clinical Engineering and Radiation Oncology (a) (b)
[image:6.595.62.534.73.483.2](c) (d)
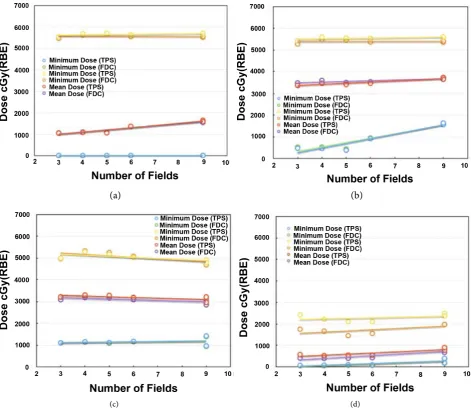
Figure 3. Minimum, maximum, and mean dose obtained by the TPS and the FDC in single-field optimization (SFO) IMPT plans for the (a) Brainstem; (b) Optic chiasma; (c) Left optic nerve; and (d) Right optic nerve.
average differences of minimum, maximum, and mean dose were −30 ± 33, 153 ± 46, and −67 ± 48 cGy (RBE). In plan E, the TPS made a more than 219.2 cGy (RBE) estimate of the maximum dose to the optic chiasma.
In the left optic nerve, average differences of minimum, maximum, and mean dose were 17 ± 12, −2 ± 65, and 106 ± 13 cGy (RBE). In the right optic nerve, av-erage differences of minimum, maximum, and mean dose were 25 ± 7, 558 ± 90, and 125 ± 29 cGy (RBE). These differences for the right optic nerve, on the unaf-fected side of the brain, were the most sensitive, and the TPS made a more than 600 cGy (RBE) estimate of maximum dose. This is because dose distributions in the right optic nerve were formed by the ends of the beams.
DOI: 10.4236/ijmpcero.2017.64038 427 Int. J. Medical Physics, Clinical Engineering and Radiation Oncology (a)
(b) (c)
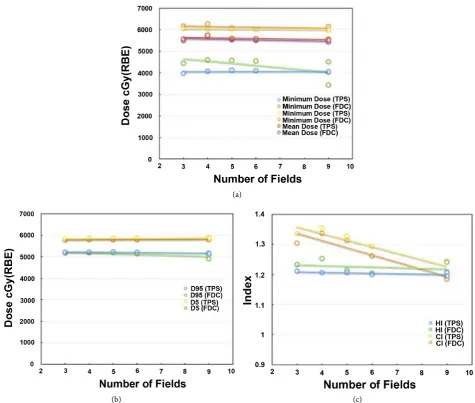
Figure 4. (a) Minimum, maximum, and mean dose; (b) D95 and D5; and (c) HI and CI for CTV by the TPS and the FDC in mul-tiple-field optimization (MFO) IMPT plans.
−476 ± 29 cGy (RBE). In contrast, that in plan L was 623 cGy (RBE). These dif-ferences between the algorithms were very large and depended strongly on beam arrangement. In contrast, average differences of maximum and mean dose were −97 ± 83 and 71 ± 12 cGy (RBE). Then, average differences of D95 and D5 were 1.6 ± 1.6 and 1.1% ± 0.3%. Average differences of HI and CI were −1.8 ± 1.7 and 2.3% ± 1.1%.
[image:7.595.60.536.71.474.2]DOI: 10.4236/ijmpcero.2017.64038 428 Int. J. Medical Physics, Clinical Engineering and Radiation Oncology (a) (b)
[image:8.595.60.536.73.469.2](c) (d)
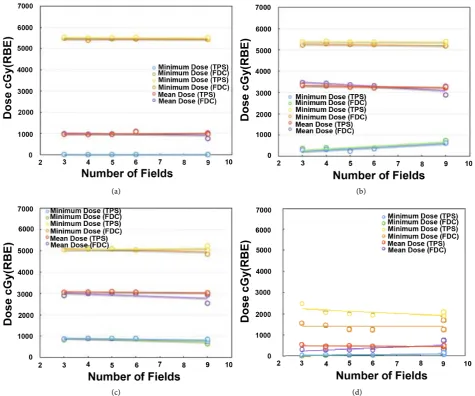
Figure 5. Minimum, maximum, and mean dose obtained by the TPS and the FDC in multiple-field optimization (MFO) IMPT plans for the (a) Brainstem; (b) Optic chiasma; (c) Left optic nerve; and (d) Right optic nerve.
for plan L, were −96 ± 20 cGy (RBE). Mean dose calculated by the FDC for plan L was 300 cGy (RBE) smaller than that calculated by the TPS.
Figure 5(c) shows that in the left optic nerve, average differences of minimum dose between the two algorithms except for plan L were 3 ± 21 cGy (RBE). Mini-mum doses by the FDC in plan L were 200 cGy (RBE) lower than those calculated by the TPS. Average differences of maximum dose except for plan L were −9 ± 9 cGy (RBE). Maximum dose by the FDC in plan L were less than about 400 cGy (RBE) as compared with that by the TPS. Average differences of mean dose between the algorithms were 89 ± 34 cGy (RBE). Mean doses by the FDC except for plan L were less than about 500 cGy (RBE) as compared with that by the TPS.
DOI: 10.4236/ijmpcero.2017.64038 429 Int. J. Medical Physics, Clinical Engineering and Radiation Oncology mean dose for the right optic nerve.
4. Discussion
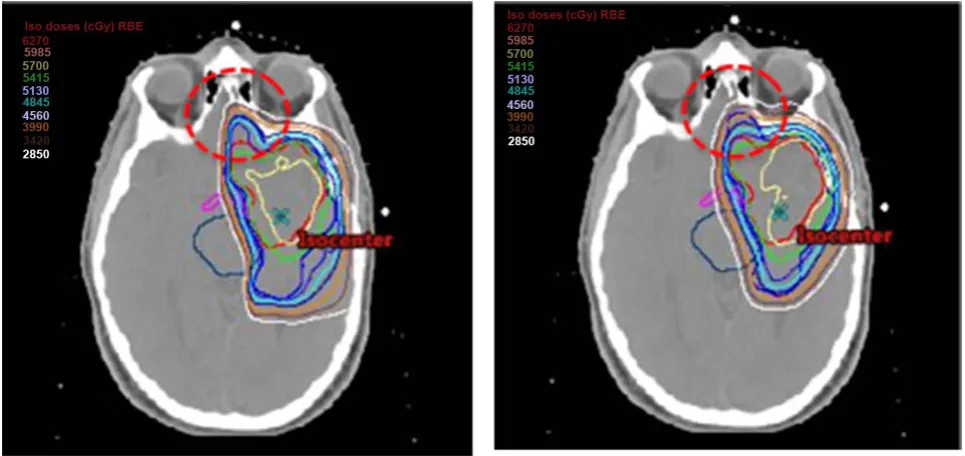
Basically, overestimating the dose to target and underestimating the maximum dose to critical organs by the TPS clinically poses a critical problem. In this analy-sis, the TPS overestimated 400 - 500 cGy (RBE) for the minimum dose to the CTV in the SFO and MFO IMPT plans. Dose difference of the TPS and the FDC for D95 in plan L was 4.8%, which is considered somewhat large. As shown in the red dashed circle region in Figure 6, we found considerable dose deterioration in front of the CTV in FDC for plan L. Since this region consisted of bone, cavi-ty, and soft tissue and therefore had large heterogeneities, beams of 340˚ and 20˚ affected this difference between the TPS algorithm and the FDC.
We also observed a dose difference of about 1000 cGy (RBE) between the TPS and the FDC calculations for right optic nerve in plan G. Thus, these quantities are very large and cannot be ignored in clinical use. We therefore recommend that proton treatment planning be done using a Monte Carlo simulation method such as the FDC.
We were surprised to find that no major differences were seen between SFO IMPT planning and MFO IMPT planning. We have confirmed a one-to-one cor-relation for each difference between these two types of planning, but we did not observe any influence of the irradiation method (R2 = 0.7258).
[image:9.595.58.541.478.706.2]Results for plans F and L were different in nature from those of the other plans. We do not think these extreme plans are suitable for clinical use. Howev-er, it was obvious that dosimetric impact changed drastically with the beam se-lection in them. Therefore, these results reconfirm the importance of beam ar-rangement in IMPT planning. Further study should now be done to determine,
DOI: 10.4236/ijmpcero.2017.64038 430 Int. J. Medical Physics, Clinical Engineering and Radiation Oncology although beam angle optimization [24] and robust optimization techniques [25] may solve a problem of the beam arrangement.
On the other hand, since the FDC can also calculate linear energy transfer, the FDC is a powerful simulation tool in proton treatment planning. Namely, we can obtain a variable RBE by using the FDC. Therefore, we plan to evaluate in-corporation of a variable RBE in IMPT plans by using these parameters in the near future.
5. Conclusion
We evaluated the dosimetric impact of the TPS and the FDC in SFO and MFO IMPT planning for a brain cancer patient. Large dose differences between the TPS and the FDC calculations were observed, and these depended on beam ar-rangement and the presence of a heterogeneous body. Because the magnitude of the dose differences was too large for clinical acceptability when the TPS calcula-tions were used, we suggest that IMPT planning be done using a Monte Carlo me-thod, such as the FDC.
Acknowledgements
The research reported in this publication was supported by the National Cancer Institute of the National Institutes of Health under award number 5U19CA021239. The University of Texas MD Anderson Cancer Center is supported in part by the National Institutes of Health/National Cancer Institute through Cancer Center Support Grant P30CA016672.
References
[1] Olsen, D.R., Bruland, O.S., Frykholm, G. and Norderhaug, I.N. (2007) Proton Thera-py—A Systematic Review of Clinical Effectiveness. Radiotherapy Oncology, 83, 123-132. https://doi.org/10.1016/j.radonc.2007.03.001
[2] Pedroni, E., Bacher, R., Blattmann, H., Bohringer, T., Copay, A., Lomax, A., Lin, S., Munkel, G., Scheib, S., Schneider, U. and Tourovsky, A. (1995) The 200-MeV Pro-ton Therapy Project at the Paul Scherrer Institute: Conceptual Design and Practical Realization. Medical Physics,22, 37-53. https://doi.org/10.1118/1.597522
[3] Gillin, M.T., Sahoo, N., Bues, M., Ciangaru, G., Poenisch, F., Arjomandy, B., Mar-tin, C., Titt, U., Suzuki, K., Smith, A.R. and Zhu, X.R. (2010) Commissioning of the Discrete Spot Scanning Proton Beam Delivery System at the University of Texas M.D. Anderson Cancer Center, Proton Therapy Center, Houston. Medical Physics, 37, 154-163. https://doi.org/10.1118/1.3259742
[4] Kohno, R., Hotta, K., Dohmae, T., Matsuzaki, Y., Nishio, T., Akimoto, T., Tachika-wa, T., Asaba, T., Inoue, J., Ochi, T., Yamada, M. and Miyanaga, H. (2017) Devel-opment of Continuous Line Scanning System Prototype for Proton Beam Therapy. International Journal of Particle Therapy, 3, 429-438.
https://doi.org/10.14338/IJPT-16-00017.1
[5] Kooy, H.M. and Grassberger, C. (2015) Intensity Modulated Proton Therapy. British Journal of Radiology,88, Article ID: 20150195. https://doi.org/10.1259/bjr.20150195 [6] Frank, S.J., Cox, J.D., Gillin, M., Mohan, R., Garten, A.S., Rosenthal, D.I., Gunn,
DOI: 10.4236/ijmpcero.2017.64038 431 Int. J. Medical Physics, Clinical Engineering and Radiation Oncology Zhang, X., Liu, W. and Zhu, X.R.(2014) Multifield Optimization Intensity Mod-ulated Proton Therapy for Head and Neck Tumors: A Translation to Practice. In-ternational Journal of Radiation Oncology Biology Physics, 89, 846-853.
https://doi.org/10.1016/j.ijrobp.2014.04.019
[7] Hong, L., Goitein, M., Bucciolini, M., Comity, R., Gottschalk, B., Rosenthal, S., Se-bago, C. and Urie, M. (1996) A Pencil Beam Algorithm for Proton Dose Calcula-tions. Physics in Medicine and Biology, 41, 1305-1330.
https://doi.org/10.1088/0031-9155/41/8/005
[8] Schaffner, B., Pedroni, E. and Lomax, A. (1999) Dose Calculation Model for Proton Treatment Planning Using a Dynamic Beam Delivery System: An Attempt to In-clude Density Heterogeneity Effects in the Analytical Dose Calculation. Physics in Medicine and Biology, 44, 27-41. https://doi.org/10.1088/0031-9155/44/1/004 [9] Kohno, R., Sakae, T., Takada, Y., Matsumoto, K., Matsuda, H., Nohtomi, A.,
Teru-numa, T. and Tsunashima, Y. (2002) Simplified Monte Carlo Dose Calculation for Therapeutic Proton Beams. Japan Journal of Applied Physics, 41, L294-L297. https://doi.org/10.1143/JJAP.41.L294
[10] Kohno, R., Takada, Y., Sakae, T., Terunuma, T., Matsumoto, K., Nohtomi, A. and Mat-suda, H. (2003) Experimental Evaluation of Validity of Simplified Monte Carlo Me-thod in Proton Dose Calculations. Physics in Medicine and Biology, 48, 1277-1288. https://doi.org/10.1088/0031-9155/48/10/303
[11] Hotta, K., Kohno, R., Takada, Y., Hara, Y., Tansho, R., Himukai, T., Kameoka, S., Matsuura, T., Nishio, T. and Ogino, T. (2010) Improved Dose-Calculation Accuracy in Proton Treatment Planning Using a Simplified Monte Carlo Method Verified with Three-Dimensional Measurements in an Anthropomorphic Phantom. Physics in Medicine and Biology, 55, 3545-3556.
https://doi.org/10.1088/0031-9155/55/12/018
[12] Paganetti, H., Jiang, H., Parodi, K., Slopsema, R. and Engelsman, M. (2008) Clinical Implementation of Full Monte Carlo Dose Calculation in Proton Beam Therapy. Physics in Medicine and Biology, 53, 4825-4853.
https://doi.org/10.1088/0031-9155/53/17/023
Re-DOI: 10.4236/ijmpcero.2017.64038 432 Int. J. Medical Physics, Clinical Engineering and Radiation Oncology search Section A, 506, 250-303. https://doi.org/10.1016/S0168-9002(03)01368-8 [14] Los Alamos National Laboratory (2002) MCNPX User’s Manual Version 2.4.0.
LANL Report LA-CP-02-408.
[15] Fippel, M. and Soukup, M. (2004) A Monte Carlo Dose Calculation Algorithm for Proton Therapy. Medical Physics, 31, 2263-2273. https://doi.org/10.1118/1.1769631 [16] Yepes, P., Randeniya, S., Taddei, P.J. and Newhauser, W.D. (2009) A Track Repeat-ing Algorithm for Fast Monte Carlo Dose Calculations of Proton Radiotherapy. Nuclear Technology,168, 334-337.https://doi.org/10.13182/NT09-A9298
[17] Yepes, P., Randeniya, S., Taddei, P.J. and Newhauser, W.D. (2009) Monte Carlo Fast Dose Calculator for Proton Radiotherapy: Application to a Voxelized Geome-try Representing a Patient with Prostate Cancer. Physics in Medicine and Biology, 54, N21-N28.https://doi.org/10.1088/0031-9155/54/1/N03
[18] Yepes, P., Eley, J.G., Liu, A., Mirkovic, D., Randeniya, S., Titt, U. and Mohan, R. (2016) Validation of a Track Repeating Algorithm for Intensity Modulated Proton Therapy: Clinical Cases Study. Physics in Medicine and Biology,61, 2633-2645.
https://doi.org/10.1088/0031-9155/61/7/2633
[19] Mizutani, S., Takada, Y., Kohno, R., Hotta, K., Tansho, R. and Akimoto, T. (2016) Application of Dose Kernel Calculation Using a Simplified Monte Carlo Method to Treatment Plan for Scanned Proton Beams. Journal of Applied Clinical Medical Physics,17, 315-327.https://doi.org/10.1120/jacmp.v17i2.5747
[20] Frank, S.J., Cox, J.D., Gillin, M., Mohan, R., Garden, A.S., Rosenthal, D.I., Gunn, G.B., Weber, R.S., Kies, M.S., Lewin, J.S., Munsell, M.F., Palmer, M.B., Sahoo, N., Zhang, X., Liu, W. and Zhu, X.R. (2014) Multi-Field Optimization Intensity-Modulated Proton Therapy for Head and Neck Tumors—A Translation to Practice. International Journal of Radiation Oncology Biology Physics, 89, 846-853.
https://doi.org/10.1016/j.ijrobp.2014.04.019
[21] Rechner, L.A., Howell, R.M., Zhang, R., Etzel, C., Lee, A.K. and Newhauser, W.D. (2012) Risk of Radiogenic Second Cancers Following Volumetric Modulated Arc Therapy and Proton Arc Therapy for Prostate Cancer. Physics in Medicine and Bi-ology, 57, 7117-7132. https://doi.org/10.1088/0031-9155/57/21/7117
[22] Rah, J.E., Kim, G.Y., Oh, D.H., Kim, T.H., Kim, J.W., Kim, D.Y., Park, S.Y. and Shin, D. (2016) A Treatment Planning Study of Proton Arc Therapy for Para-Aortic lymph Node Tumors: Dosimetric Evaluation of Conventional Proton Therapy, Proton Arc Therapy, and Intensity Modulated Radiotherapy. Radiation Oncology, 11, 140.https://doi.org/10.1186/s13014-016-0717-4
[23] Shaw, E., Kline, R., Gillian, M., Souhami, L., Hirschfeld, A., Dinapoli, R. and Mar-tin, L. (1993) Radiation Therapy Oncology Group: Radio Surgery Quality Assurance Guidelines. International Journal of Radiation Oncology Biology Physics, 27, 1231-1239.https://doi.org/10.1016/0360-3016(93)90548-A
[24] Cao, W., Lim, G.J., Lee, A., Li, Y., Liu, W., Shu, X.R. and Zhang, X. (2012) Uncer-tainty Incorporated Beam Angle Optimization for IMPT Treatment Planning. Medical Physics,39, 5248-5256.https://doi.org/10.1118/1.4737870
[25] Zaghian, M., Cao, W., Liu, W., Carder, L., Randeniya, S., Mohan, R. and Lim, G. (2017) Comparison of Linear and Nonlinear Programming Approaches for “Worst Case Dose” and “Minimax” Robust Optimization of intensity-Modulated Proton Therapy Dose Distributions. Journal of Applied Clinical Medical Physics,18, 15-25.