Munich Personal RePEc Archive
International practices and situating
public debt management in Oman
Pandow, Bilal
Middle East College
March 2018
Online at
https://mpra.ub.uni-muenchen.de/85651/
FINANCIAL SECTOR IN OMAN
DEVELOPMENTS, ISSUES AND PROSPECTS
College of Banking and Financial Studies, Sultanate of Oman
Chapter No. 2
International practices and situating public debt management in
Oman
Abstract
A significant work is happening globally on the measurements of public sector debt to enhance its sustainability. Though adoption of standards is likely to take time, however, few applications are gradually getting accepted internationally.
In the present chapter an attempt has been made to measure the sustainability of public debt of Oman and provide a framework based on the international practices to review and propose policy options for the Central Bank of Oman (CBO) and Ministry of Finance (MOF).
The Financial Affairs Council (FAC) and the MOF are the two apex authorities responsible for all financial matters in Oman. The FAC is composed of MOF and representatives from the CBO and the Capital Market Authority (CMA). The MOF proposes to the FAC financial policies related to regulations for adoption and also monitors their implementation. Also, the MOF has authority to borrow on behalf of the Government and keeps records of the government’s financial transactions. The specification like the purpose of borrowing, limits of borrowing and objectives of debt management strategy are not spelled out clearly. And, the reporting of debt management activities is not mandated. In addition, there is no Public Debt Act in Oman.
The main objective of this paper is to analyze the global scenario and solutions of public debt management, the current challenges and debt market development in order to identify relevant policy options for the authorities in the Sultanate of Oman.
Introduction
Oman is classified by the World Bank as an upper middle income developing country, with a GDP of U.S. $16,910 per capita on a nominal basis in 2015. The IMF projects that Oman's nominal GDP per capita on a PPP basis will be U.S. $44,470 in 2017. The production and export of crude oil and natural gas is the principal activity of the Omani economy, contributing 28.2 percent of nominal GDP in the first nine months of 2016 and 36 percent of nominal GDP in 2015. As such, the performance of the petroleum industry may directly affect industries that are tangential to, or reliant on, the petroleum industry as well as having more indirect effects on the economy as a whole, such as reductions in consumer purchasing power or mobility. In addition, petroleum activities are the principal source of government revenues (approximately 74.3 percent of total government revenues in 2016) and, therefore, indirectly affect the performance of the non-oil sectors of the economy through their effect on Government allocation of its expenditure in those sectors. As a result, fluctuations in the price of oil is the major contributing factor to Oman's economic performance. The economy's vulnerability to oil price movements as well as the finite nature of oil reserves have led the Government of Oman to exploit significant gas reserves, to promote investment in the non-oil and gas sectors of the economy.
When the income of the government is insufficient to meet its expenses, the government of that country borrows money either within the country or abroad and such a borrowing creates public debt. The public debt is different from private debt as it consists of the obligations of individuals, business firms, and nongovernmental organizations. While, Obligations of government, particularly those evidenced by securities, to pay certain sums to the holders at some future time.
The debt owed by national governments is usually referred to as the national debt and is thus eminent from the public debt of state and local government bodies. In the United States, bonds issued by the states and local governments are known as municipals. In the United Kingdom, debt or loans incurred by local authorities are referred to as corporation, or county, loans, thus distinguishing them from central government debt, which is frequently referred to simply as funds. In the past, paper money was frequently regarded in the United States as a portion of the public debt, but in more recent years money has been regarded as a distinct type of obligation, in part because paper money is usually no longer payable in gold, silver, or other specific items of intrinsic value.
Public debt is an obligation of a government; and, although individuals are called upon in their capacity as taxpayers to provide funds for payment of interest and principal on the debt, their own property cannot be attached to meet the obligations if the government fails to do so. Similarly, government property normally cannot be seized to meet these obligations. With sovereign governments, the debt holders can take only such legal action to enforce payment as the governments themselves prescribe.
1. Forms of public debt can be classified in a number of different ways: 2. Maturity: as short term or long term
3. Issuer: Direct obligations, contingent obligations, or revenue obligation 4. Location of the debt: Internal or external
5. Marketability: Negotiable securities (marketable) or nonnegotiable securities.
Significance of Public Debt Management
Public debt management is the process of establishing and executing a strategy for managing the
Each government faces strategy concerning debt management objectives, its preferred risk tolerance, how to establish sound governance for public debt management. On many of these issues, there is increasing convergence in the global debt management community on what are considered prudent sovereign debt management practices that can also reduce vulnerability to contagion and financial shocks.
These include:
1. Clear objectives for debt management 2. Evaluating risks against cost considerations
3. Separation and coordination of debt and monetary management objectives and accountabilities 4. Limit on debt expansion
5. Developing a sound institutional structure and policies for reducing risk, clear delegation of responsibilities and associated accountabilities among government agencies involved in debt management
The size and complexity of a government’s debt portfolio often can generate substantial risk to the
government’s balance sheet and to the country’s financial stability. Sound debt structures help governments
reduce their exposure to interest rate, currency and other risks.
Developing the market for government securities can also help to stimulate the development of domestic markets for private securities. For example, in Japan the development of the secondary market for government securities is considered to be an important objective for debt management because this market, by virtue of being low credit risk, serves as the foundation for domestic financial markets, and is by far the most actively traded segment of the domestic bond and debenture market.
In all of the countries studied, the legal authority to borrow in the name of the central government rests with the parliament or congressional legislative body. However, practices differ with respect to the delegation of borrowing power from the parliament to debt managers. In most of the countries, legislation has been enacted authorizing the Ministry of Finance to borrow on behalf of the government. In some others, that power has been delegated to the Council of Ministers (the Cabinet), and in case of India power lies directly to the central bank. Whether the delegation is to the Council of Ministers, the Ministry, or Minister of Finance seems to be more of a formality that recognizes country conventions regarding the decision making within the government than a practical matter.
Another example of a legislative debt ceiling is the one used by Poland. Poland has inserted into its constitution a requirement that total government debt, augmented by the amount of anticipated disbursements on guarantees, is not allowed to exceed 60 percent of GDP, the debt limit stipulated by the Maastricht treaty. Denmark and the U.S. are examples of other countries that also have legislative limits on the stock of debt outstanding.
by strong internal governance, accountability, and transparency mechanisms to ensure that the agency performs as expected, and is held accountable for its decisions.
In particular, the debt manager should carefully assess and manage the risks associated with foreign currency and short-term or floating-rate debt, and ensure there is sufficient access to cash to avoid the risk of not being able to honor financial obligations when they fall due.
Besides, the US and other major nations now run record budget deficits, and likely to continue for decades to come amid rising public leverage ratios that approaches levels last ever seen in World War II, which according to Salsman, (2017) is a matter of grave concern and needs to be re-examine the public debt history, theory and practice.
Literature Review
In a study by Chiu & Lee (2017) the results show evidence of the different debt-growth nexus under the different degrees of country risk. Under a high-risk environment, a country's economic growth is harmed by raising its public debt. The negative effects public debt has on economic growth become weak under low political and financial-risk environments, while an increase in public debt could help to stimulate economic growth under low composite and economic risk environments.
It has also been showed by the research by Debortoli, Nunes, & Yared (2017) how the optimal time-consistent maturity structure is nearly flat because reducing average borrowing costs is quantitatively more important for welfare than reducing fiscal policy volatility. Thus, under lack of commitment, the government actively manages its debt positions and can approximate optimal policy by confining its debt instruments to consoles.
There are studies as well conducted on how institution quality, through the international governance index, impacts pilling of public debt in seventeen states of Middle East and North African region. The results have shown that three governance indicators impact the public debt of the region and are political stability and absence of violence index, regulatory quality index and rule of law index (Tarek & Ahmed, 2017). The positive response of the primary surplus to changes in debt also shows that U. S. fiscal policy is satisfying an intertemporal budget constraint (Bohn, 1998). While, as the relationship between public debt and GDP growth varies significantly by period and country (Herndon et.al., 2014).
Also, there is some evidence of nonlinearity with higher levels of initial debt having a proportionately larger negative effect on subsequent growth. Analysis of the components of growth suggests that the adverse effect largely reflects a slowdown in labor productivity growth mainly due to reduced investment and slower growth of capital stock (Kumar & Woo, 2010).
There has also been study conducted on the evolution of debt-to-GDP ratios across country groups for several decades, episodes of debt spikes and reversals, and a pattern of negative correlation between debt and growth (Abbas, 2010).
Since the start of the financial crisis, industrial country public debt levels have increased dramatically. And they are set to continue rising for the foreseeable future. A number of countries face the prospect of large and rising future costs related to the ageing of their populations. There are projections of public debt ratios that suggest the path pursued by fiscal authorities in a number of industrial countries is unsustainable. Drastic measures are necessary to check the rapid growth of current and future liabilities of governments and reduce their adverse consequences for long-term growth and monetary stability (Cecchetti, 2010). A study by Jaimovich & Panizza (2010) finds that industrial countries show a clear trend, with debt increasing from 45 to 60% of GDP over the period under observation. A new data set that includes complete series of central government debt for 89 countries over the period 1991 to 2005 and for 7 other countries for the period 1993 to 2005.
Besides there are finding like Panizza & Presbitero (2014) and Pandow (2001) that there is no evidence that public debt has a causal effect on economic growth is important in the light of the fact that the negative correlation between debt and growth is sometimes used to justify policies that assume that debt has a negative causal effect on economic growth.
Methodology
The debt sustainability in this study was measured on the basis of Gross Domestic Product (GDP), export incomes, and fiscal revenue. In this study, the total debt of the government of Oman is also studies and analyzed. Further the paper employees the following ratio to assess the public debt situation of Oman.
Ratio of Public debt over GDP:The debt over GDP ratio is the ratio between Oman government’s debt and its gross domestic product. A low debt-to-GDP ratio indicates an economy that produces and sells goods and services sufficient to pay back debts without incurring further debt. The reason for using this ratio is that the GDP ratios allows the pointers to be tuned with the size of the economy Ratio of Public debt over Exports: The public debt to export ratio is used to calculate Oman’s total amount of debt in comparison to its total amount of exports. This is an important way for countries like Sultanate of Oman to measure their independent sustainability. The percentage will assists the country to determine its growth rate. Also, the export income ratios indicate whether the country can be projected to generate adequate foreign exchange to meet its external debt requirements in the future;
Ratio of Public debt over Revenue: The public debt to revenue ratio calculated the Oman’s total amount of debt in comparison to its total revenue in that fiscal. Also, the revenue ratios measure
the government’s ability to muster domestic means to return debt.
Situating Public Debt in Oman
In February 2016, S&P downgraded Oman’s long-term foreign and local currency sovereign credit rating to BBB- from BBB+, with a stable outlook. Also, in May 2016, Moody’s downgraded Oman’s long-term issuer rating to Baa1 from A3, with a stable outlook.
Further, in March 2017 Oman's Baa1 rating with a stable outlook reflects its high wealth levels and a still comparatively strong government balance sheet, balanced against credit challenges, including its heavy reliance on the oil and gas sector, Moody's Investors Service reported recently.
A Moody's Senior Credit Officer, Steffen Dyck in the report mentions, “Although we expect government
debt to rise to 40% of GDP by 2018 from less than 5% at the start of the oil price shock, Oman's fiscal buffers will support the country through its process of fiscal and external adjustment.”
For 2016-2020, Moody's forecasts real GDP growth in Oman of around 2.1% per year on average, significantly lower than the 3.8% average annual growth seen between 2011 and 2015. This forecast is based on Moody's expectation of only limited increases in oil and gas production and the dampening effect from ongoing fiscal consolidation on non-oil real GDP growth.
Moody's expects Oman's 2017 fiscal deficit to narrow substantially to OMR3.1 billion ($8.1 billion, 11.4% of GDP) from an estimated OMR5.0 billion ($13.0 billion, 20.1% of GDP) in 2016, and fiscal deficits will continue to decline gradually over the following years.
While Gulf Cooperation Council (GCC) countries are well-positioned on average to withstand external payment pressures, Bahrain and Oman are more exposed due to their low levels of foreign exchange reserves and large current account deficits, Moody's Investors Service said in a recent report.A current account surplus of close to 18% of GDP on average across GCC countries over 2005-2014 has shifted to a deficit of -3.4% in 2016, up from -0.6% in 2015.
In 2016, Oman had the highest current account deficit among GCC countries, which Moody's estimates at 20.1% of GDP, and the highest external breakeven oil price at $78.4 per barrel, according to the International Monetary Fund (IMF). Bahrain and Saudi Arabia registered moderate current account deficits of around 3.3-3.4% of GDP, while Qatar's was much smaller at -0.5%, according to Moody's estimates. The Central Bank of Oman in its Bi-Monthly Publication Special Issue mentions that preliminary calculations suggest that actual fiscal deficit for the fiscal year 2016 is expected to reach RO 5.3 billion, an increase of 60% of the deficit estimated in the Budget, which is considered the highest deficit level in the history of the General Budget. The increase in deficit is caused by several factors, including decline in the actual achieved oil price (from $45 estimated in the Budget to the actual $39), and decrease in the actual achievement of a number of articles of non-oil revenues clauses along with increased general spending on the Budget estimates.
Despite the severity of the challenges faced by the Budget, the government has been able to provide the necessary funding for spending by relying heavily on external borrowing so that domestic liquidity can be made available for the financing needs of private sector in the country. International bonds worth $4 billion were issued together with collective commercial loans worth $5 billion, export proxy guarantee loans worth $2 billion and Islamic Sukuk worth half a billion US dollars.
Rising deficits during the years 2015 and 2016 gave rise to the volume of the State’s general debt to the
GDP by the end of 2016 to 29%, which means debt service rate will rise successively in the coming years.
In accordance with a report ‘Developing Debt Market in Oman: A Road Map’ by Economic Research and
Statistics Department, Central Bank of Oman mentions that the size of borrowing requirement of the Government is determined by the magnitude of budget deficit. Given the size of budget deficit, either the Treasury department or the central bank, on behalf of the Government, conducts primary auctions, manages public debt in terms of timing of issuance, magnitude, type of auction, mode of payment and settlement, maturity of debt based on well-established debt management practices. Often the central bank works as front and/or middle office while back office functions are retained by the Treasury. The secondary market transactions are generally put through stock exchanges although over-the-counter transactions are also allowed in many jurisdictions. Moreover, central banks generally act as depository to public debt issued in domestic currency and thereby facilitate the issuance of domestic public debt in demat form. Besides outright transactions, government securities are also used as collateral in case of inter-bank transactions as well as transactions with the central bank. As stakeholders are many, there is a need for Public Debt Act and guidelines should be well codified with clear responsibilities vested with respective authorities. The Financial Affairs Council (FAC) and the Ministry of Finance (MOF) are the two apex authorities responsible for all financial matters in Oman. The FAC is composed of MOF and representatives from the Central Bank of Oman (CBO) and the Capital Market Authority (CMA). The MOF proposes to the FAC financial policies related to regulations for adoption and also monitors their implementation. According to the Royal Decree 39/96, the MOF has authority to borrow on behalf of the Government and keeps records
of the government’s financial transactions. The decree does not specify the purpose of borrowing, limits of
borrowing and objectives of debt management strategy. Reporting of debt management activities is not mandated. There is no Public Debt Act in Oman.
According to the Banking Law 2000, the CBO can borrow funds on behalf of the Sultanate provided the loans are guaranteed by the Government. To meet temporary cash flow needs of the Government, the CBO can provide short-term credit to the Government by way of overdraft up to a limit. The amount of such overdraft limit from the CBO together with outstanding Treasury Bills issued on behalf of the Government shall not exceed 10 percent of budgeted current revenues and needs to be repaid within 90 days. Public debt management is entrusted to the Treasury department of the MOF. There are two separate units for debt issues, one for external debt and the other for domestic debt. External debt office (Loan Department) performs both front and back office functions. The domestic debt office is known as Treasury Department which mainly performs back office functions. The front office functions for domestic debt are performed by the CBO as an agency of the Government as specified in a memorandum of understanding. A committee of MOF and CBO officials is supposed to meet regularly for the issuance of Treasury Bills and once in every quarter for the issuance of development bonds (DBs). The CBO conducts auctions of Treasury Bills and DBs and keeps a registry of Treasury Bills. Issuance of Treasury Bills has been discontinued since 2005 due to improved fiscal position of the Government. Before every auction of development bonds, the CBO publishes the terms of each issue. As soon as the auctions are over, the CBO transfers the registry of development bonds to the Muscat Clearing and Depository Co. (MCDC) Vide Royal Decree No.82/98, February 25, 1998. Earlier, it was called Muscat Depository and Securities Registration Company (MDSRC).
The share of medium and long-term loans in the total public debt increased steadily form 36.4 percent in 2005 to nearly 75 percent in 2009. Public debt to GDP ratio declined from 8.6 percent in 2005 to 4.2 percent in 2008 before rising to 5.7 percent in 2009. Improvement in the overall fiscal balance, following steady increase in crude oil prices in the global markets contributed to the decline in debt-GDP ratio during the recent years.
The Sultanant of Oman's National Government Debt reached 6.5 USD billion in Dec 2015, compared with 4.0 USD billion in 2014 and was at a record low at 2.5 USD bn in Dec 2008. The Central Bank of Oman provides Government Debt in local currency.
Figure:1
According to the CBO Oman's Net government debt position to the GCC countries remains manageable however, IMF forecasts as can be seen in the figure 1 that the trend will deteriorate further in the coming years. It calls for a significant reduction in current spending, an increase in oil prices in the short to medium run, strengthening of the institutions and a restructuring of the economy in the long run.
Also, protracted low oil prices continue to weigh on Oman’s economy. The OPEC agreement to cut oil production in 2017 and the government’s ongoing commitment to austerity are likely to further depress
growth. Fiscal and current account deficits remain large, and Oman is increasingly resorting to external borrowing to finance its deficits. However, growth is expected to pick up in 2018 as Oman pins hopes for its economic diversification plan on the fisheries and tourism sectors, a report by the World Bank titled GCC: Economic Outlook- April 2017, mentions.
Real GDP growth in Oman is estimated to have slowed down to 2.2% in 2016 from 5.7% in 2015, according to official Omani estimates. Non-hydrocarbon GDP growth is estimated to have dropped to 2% in 2016 from 7% in 2015 as public spending declined with knock-on effects on investment and consumption. Hydrocarbon GDP growth nearly halved in 2016, falling from 4.2% in 2015 to 2.4% in 2016.
Results and Discussion
The Ministry of Finance is the only institution entitled to borrow on behalf of the Government of Oman. Municipalities are not permitted to borrow. The Government of Oman intends to establish a debt management office in the coming years in order to manage its rising debt levels. The following table 1 sets forth the debt of the Government of Oman as at 31 December for each of the seven years ended 31 December 2016.
Table: 1
Debt of the Government of Oman
As on 31 December (OMR millions, except percent) 2010 2011 2012 2013 2014 2015 2016
Government domestic debt (OMR million)
330.0 480.0 630.0 830.0 930.0 2,540.1 2,436.0
Per cent. of Annual GDP 1.5% 1.8% 2.1% 2.8% 3.0% 9.4% 10.5%
Government external debt (OMR million)
806.2 767.3 730.5 656.1 595.7 901.3 5,161.7
Per cent. of Annual GDP 3.6% 2.9% 2.5% 2.2% 1.9% 3.3% 22.2%
Total government debt 1,136.2 1,247.3 1,360.5 1,486.1 1,525.7 3,441.4 7,597.7
Per cent. of Annual GDP 5.0% 4.8% 4.6% 4.9% 4.9% 12.7% 32.6%
Annual GDP 22,547.6 26,122.0 29,353.3 30,061.3 31,450.8 27,013.1 23,301.9(1)
(1)On an annualized basis.
Source: Central Bank of Oman and Ministry of Finance
The tendency of the government debt in the coming years is expected to shoot up and based on the past data, the future projection expects the total government debt to cross the 35,000 OMR millions in near future. It has been indicated that the legislators should follow a sustainable fiscal policy (Baharumshah, Soon & Lau, 2017). Also, the trend for the next couple of years based on the table 1 can be seen in the below mentioned line graph 1 and it is based on the past data and future projection are calculated through quadratic with an equation of the line as below:
Y=346.03X21913.3X+3274.8 R2= 0.9094
Graph 1
Source: Self calculation
1,136.20 1,360.501,525.70 3,441.40
7,597.70
y = 346.03x2- 1913.3x + 3274.8
R² = 0.9094
0.00 5,000.00 10,000.00 15,000.00 20,000.00 25,000.00 30,000.00 35,000.00
2010 2011 2012 2013 2014 2015 2016
De
b
t
(OMR)
Years
Total government debt
Table 2: Ratio of Public debt over GDP
Year
2010 2011 2012 2013 2014 2015 2016Public Debt 1,136.20 1,247.30 1,360.50 1,486.10 1,525.70 3,441.40 7,597.70
GDP 22,547.60 26,122.00 29,353.30 30,061.30 31,450.80 27,013.10 23,301.90
Percent Govt. Debt to Annual
GDP 5.00% 4.80% 4.60% 4.90% 4.90% 12.70% 32.60%
Sources: Central Bank of Oman and Ministry of Finance
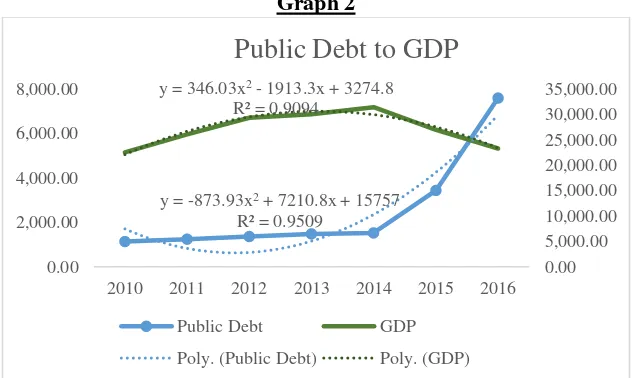
Besides, it is clearly visible from the table 2 that the public debt to GDP ratio has gone up from 5 percent in 2010 to almost 33 percent in 2016 which is a matter of concern for the Oman governemt. The future projection can be see in the graph 2 based on trend line equations. Though there have been no evidence for a generally appropriate threshold effect in the association between public debt and economic growth. Notwithstanding the threshold, however, it has been found substantial a negative effect of increase in public debt on the growth (Chudik, Mohaddes, Pesaran, & Raissi, 2017).
Graph 2
Source: Self calculation
[image:12.612.148.465.307.496.2]Though there has been a drop in the exports however, the country still has managed to raise it to a comprable level of 2011 in 2016. Still the worrying factor is the ratio of public debt over exports which has grown significantly since the year 2011 from 6.89% to almost 47% in 2016. At the present level of the publiic debt which is at 7,597 OMR millions the exports to the tune of 16,367OMR millions is not healthy at all and needs to be brought down to a sustainable level. It can be achieved either by increasing the exports or decreasing the public debt. The trend lines based on the past data shown in the graph 3 are also not favorable.
Table 3: Ratio of Public debt over Exports
Year
2011 2012 2013 2014 2015 2016Public Debt 1,247 1,361 1,486 1,526 3,441 7,597.70
Exports 18,107 20,047 21,697 20,596 13,721 16,367
Percentage Public
debt to Exports 6.89% 6.79% 6.85% 7.41% 25.08% 46.42%
Source: Central Bank of Oman and Ministry of Finance
y = 346.03x2- 1913.3x + 3274.8
R² = 0.9094
y = -873.93x2+ 7210.8x + 15757
R² = 0.9509
0.00 5,000.00 10,000.00 15,000.00 20,000.00 25,000.00 30,000.00 35,000.00
0.00 2,000.00 4,000.00 6,000.00 8,000.00
2010 2011 2012 2013 2014 2015 2016
Public Debt to GDP
Public Debt GDP
Graph 3
Source: Self calculation
[image:13.612.137.475.87.297.2]Similaly, the ratio of public debt over governmnet revenue has sprout up from a single digit i.e almost 9% to 102% which is not usual and is indicates the inorganic growth that the public debt has achieved over the governmnet revenue which is not sustainable and can be observed in table 4 and grpah 4. The government of the Sultanat has to think of ways and means to increase the government revenue to bring down its debt to revenue ratio.
Table 4: Ratio of Public debt over Revenue
Year
2011 2012 2013 2014 2015 2016Public Debt 1,247 1,361 1,486 1,526 3,441 7,597.70
Revenue 12,720.2 14,345.8 14,998.8 14,419.6 9,015.9 7,448.5
Percentage Public
debt to Revenue 9.80% 9.49% 9.91% 10.58% 38.17% 102.00%
Sources: Central Bank of Oman and Ministry of Finance
Graph 4
Source: Self calculation
y = 488.81x2- 2335x + 3535.3
R² = 0.9465
y = -545.92x2+ 2999.1x + 16205
R² = 0.5158
0 5,000 10,000 15,000 20,000 25,000 0 1,000 2,000 3,000 4,000 5,000 6,000 7,000 8,000
2011 2012 2013 2014 2015 2016
Public Debt to Exports
Public Debt Exports
Poly. (Public Debt) Poly. (Exports)
y = 488.81x2- 2335x + 3535.3
R² = 0.9465
y = -717.71x2+ 3797.5x + 9752.2
R² = 0.905
0.0 5,000.0 10,000.0 15,000.0 20,000.0 0 2,000 4,000 6,000 8,000
2011 2012 2013 2014 2015 2016
Public Debt to Revenue
Public Debt Revenue
Furthermore, the primary sources of domestic government debt are GBDs, Treasury Bills and Sukuk. All these instruments are issued in Omani Rial.In 2015, the Government issued a Sukuk of OMR 250 million at a rate of 3.5 per cent. profit rate per annum and in July 2016, the Government issued a Sukuk of OMR 192 million at a rate of 3.5 percent profit rate per annum.The amount of treasury bills outstanding was OMR 306 million as at 31 December 2016 as compared with 465 million as at 31 December 2015.The following table5 sets forth the Government of Oman's domestic debt profile as at 31 December for each of the seven years ending 31 December 2016. According to Ostry, Ghosh, & Espinoza, (2015) where countries hold plenty fiscal space, administrations should not follow strategies that are meant at paying down the debt, as an alternative the government should allow the debt ratio to decline through growth and resourceful revenues, breathing with the debt otherwise.
Table 5: Oman Government Domestic Debt
As on 31 December(OMR millions)
End of Period 2010 2011 2012 2013 2014 2015 2016*
Total government domestic debt 330 480 630 830 930 2,540.10 2,436.00
GDBs(1) 330 480 630 830 930 1,325.10 1,630
Sukuk(1) — — — — — 250 250
Loans from local banks(2) — — — — — 500 250
Treasury Bills(3) — — — — — 465 306
*Preliminary Source: Central Bank of Oman and Ministry of Finance
Note: all instruments issued in local currency
(1) GDBs and Sukuk may be held by non-residents. Full amount of GDB issued is included here. (2) Corresponds to a loan from Bank Muscat contracted in 2015 and due in 2017
(3) Treasury bills are held only by commercial banks Sources: Central Bank of Oman and Ministry of Finance
[image:14.612.70.543.548.698.2]Oman's total external debt as at 31 December 2016 was approximately OMR 5.16 billion as compared to OMR 901.3 million as at 31 December 2015, mostly denominated in U.S. Dollars. The increase from 2015 is primarily the result of an increase in commercial loans and bonds of OMR 4.16 billion, including the U.S.$4 billion issuance of the 3.625 per cent. notes due 2021 and 4.750 per cent. notes due 2026 and the U.S.$4 billion pre-export financing secured by PDO. Most of Oman's external debt is medium-term debt (more than one year to maturity and less than seven years to maturity). Oman's external debt is composed of commercial loans, export credits, loans from development institutions, Sukuk and short term loans.The following table6 sets forth Oman's external debt as at 31 December for each of the six years ended 31 December 2015 and as at 31 December 2016.
Table 6: Oman Government External Debt
As on 31 December(OMR millions)
End of Period 2010 2011 2012 2013 2014 2015 2016
Total external debt 806.2 767.3 730.5 656.1 595.7 901.3 5,161.7 Export credits 241.5 234.1 222.8 185.1 148.9 102.9 675.1 Loans from development
Institutions 439.1 407.6 382.1 345.4 321.2 289.1 325.6 Commercial loans and bonds 125.6 125.6 125.6 125.6 125.6 509.3 3,584.6 Sukuk 0.0 0.0 0.0 0.0 0.0 0.0 192.1 Short term loans 0.0 0.0 0.0 0.0 0.0 0.0 384.3
In addition, in the second quarter of 2016 the Government of Oman represented by the Ministry of Finance entered into a bilateral short-term loan in the amount of U.S. $1 billion with Industrial and Commercial Bank of China Ltd to be repaid in May 2017. Also, as observed by Schclarek (2004), 59 emerging nations from 1970 to 2002 were studied and found that a significant inverse correlation existed between external debt and economic growth.
Regression analysis
[image:15.612.166.448.253.346.2]The regression analysis of the above mentioned data of annual GDP and total government debt of Sultanate of Oman has shown below mentioned results.
Table 7: Descriptive Statistics
Mean Std. Deviation
Public Debt 2776.45 2500.368088 GDP 27883.73333 2982.626051 Exports 18422.5 2983.761904 Revenue 12158.13333 3173.001716
Source: Self calculation
[image:15.612.153.462.418.546.2]The value of R as can be seen in the table 8 to the tune of 0.99 at 1% significance level shows the strong linear relationship between revenue, GDP, exports and public debt. Also, it shows the relevance of the model of taking annual government revenue, exports and GDP as a causal variable that has an impact on the outcome variable which in this case is total government debt of Oman.
Table 8: Regression analysis
Model 1
R R Square
Adjusted R Square
Durbin-Watson
Sig. F Change 0.997424 0.994854 0.987135 2.631165 a. Predictors: (Constant), Revenue, GDP, Exports
b. Dependent Variable: Public Debt
Source: Self calculation
An analysis of the correlation between three variables have shown that the there is an inverse relationship between the public debt and GDP, exports and government revenue which also signifies the above made analysis.
Table 9: Table Correlation
Public Debt GDP Exports Revenue
Public Debt 1
GDP -0.7865 1
Exports -0.58438 0.704286 1
Revenue -0.88854 0.862051 0.888268 1
[image:15.612.154.458.613.710.2]Graph 6
Source: Self calculation
The graph 6 shows how in tandem the annual GDP moves with the total government debt. The annual GDP is drawn against the predicted annual GDP.
Besides, there are empirical studies conducted that have shown evidence of the different debt-growth connection under the different degrees of nation risk. Under a high-risk environment, a nation's economic growth is damaged by hovering its public debt. The negative effects public debt has on economic growth develops feeble under low political and financial-risk settings, while an upsurge in public debt could help to encourage economic growth under low compound and economic risk settings. Also, the variances of nations' income and debt intensities also lead nation risks to have dissimilar effects on the debt-growth connection, proposing that a nation should borrow suitably based on its existing risk settings while enlightening economic enactment (Chiu, et.al., 2017).
Exploring new models
Globally there are plenty of tools available for the debt management and financial analysis provided by many international renowed players in the field. One of the tools that Oman could possibly explore is Commonwealth Secretariat Public Debt Analytical Tool (CS-PDAT) which is specialized middle office/ front office decision support system and is designed to allow policy makers to manage public debt by having a focus on price and risk. The tool is built on an integrated structure for the growth and application of a debt management policy and enables debt administrators to progress and measure the costs and risks of substitute borrowing approaches (see Figure-2).
0.00 20,000.00 40,000.00
2010 2012 2014 2016 2018 2020 2022
Comparative analysis
Figure-2
Source: Commonwealth Secretariat OECD
The tool also permits policy makers to implement and observer their desired policy through the integration of debt management, improvement of an annual borrowing plan including an issuance calendar and liability management processes (for example, buybacks, exchanges, embedded options, restructuring, and swaps). The tool gives policy makers the ability to carry out a range of explorations, from basic to advanced, on the entire public debt collection. It focuses on the costs and risks associated with different borrowing strategies under different scenarios for analyzing substitute policies. Various market risks and refinancing risks are comprehensively analyzed through the application of the CS-PDAT system.
Once the desired strategy is selected, CS-PDAT allows the debt manager to implement the strategy through the development of an annual borrowing plan, including the simulation of an issuance calendar for government securities. For the development of the domestic debt market, the system specifically supports the building up of benchmark bonds through re-openings of existing securities.
Conclusions
The Public Debt Management in Oman should encompass the main financial obligations over which the government exercises control. At the same time, debt managers, fiscal policy advisors, and central bank of Oman should share an understanding of the objectives of debt management, fiscal, and monetary policies given the interdependencies between their different policy instruments. Debt managers should convey to fiscal authorities their views on the costs and risks associated with government financing requirements and debt levels.
Also, there should be a separation of debt management and monetary policy objectives and accountabilities.
The debt management, fiscal, and monetary authorities should share information on the government’s
current and future liquidity needs. The allocation of responsibilities among the ministry of finance, the central bank of Oman, or a separate debt management agency, for debt management policy advice, and for undertaking primary debt issues, secondary market arrangements, depository facilities, and clearing and settlement arrangements for trade in government securities, should be publicly disclosed.
Besides, the significant aspects of debt management operations should be publicly disclosed. The public should be provided with information on the past, current, and projected budgetary activity, including its financing, and the consolidated financial position of the government. The legal framework should clarify the authority to borrow and to issue new debt, invest, and undertake transactions on the behalf of government of Saltant of Oman. The organizational framework for debt management should be well specified, and ensures that mandates and roles are well articulated.
In addition, risks of government losses from inadequate operational controls should be managed according to sound business practices, including well-articulated responsibilities for staff, and clear monitoring and control policies and reporting arrangements. Sound business recovery procedures should be in place to mitigate the risk that debt management activities might be severely disrupted by natural disasters, social unrest.
A framework should be developed to enable debt managers to identify and manage the trade- offs between expected cost and risk in the government debt portfolio. To assess risk, debt managers should regularly conduct stress tests of the debt portfolio on the basis of the economic and financial shocks to which the government and the country more generally are potentially exposed. The government of Oman should strive to achieve a broad investor base for its domestic and foreign obligations, with due regard to cost and risk, and should treat investors equitably.
Reference:
1. Abbas, S. M., Belhocine, N., ElGanainy, A. A., & Horton, M. (2010). A historical public debt database.
2. Ardagna, S., Caselli, F., & Lane, T. (2007). Fiscal discipline and the cost of public debt service: some estimates for OECD countries. The BE Journal of Macroeconomics, 7(1), 28.
3. Baharumshah, A. Z., Soon, S. V., & Lau, E. (2017). Fiscal sustainability in an emerging market economy: When does public debt turn bad?. Journal of Policy Modeling, 39(1), 99-113.
4. Bohn, H. (1998). The behavior of US public debt and deficits. The Quarterly Journal of economics, 113(3), 949-963.
6. Central Bank of Oman (2011). Discussion Paper on Developing Debt Market in Oman: A Road Map
7. Central Bank of Oman (2017). Bi-Monthly Publication of the Central Bank of Oman. March 2017. Vol.42
8. Chudik, A., Mohaddes, K., Pesaran, M. H., & Raissi, M. (2017). Is there a debt-threshold effect on output growth?. Review of Economics and Statistics, 99(1), 135-150.
9. Chiu, Y. B., & Lee, C. C. (2017). On the impact of public debt on economic growth: does country risk matter?. Contemporary Economic Policy.
10. Debortoli, D., Nunes, R., & Yared, P. (2017). Optimal time-consistent government debt maturity. The Quarterly Journal of Economics, 132(1), 55-102.
11. Herndon, T., Ash, M., & Pollin, R. (2014). Does high public debt consistently stifle economic growth? A critique of Reinhart and Rogoff. Cambridge journal of economics, 38(2), 257-279. 12. Jaimovich, D., & Panizza, U. (2010). Public debt around the world: a new data set of central
government debt. Applied Economics Letters, 17(1), 19-24. 13. Kumar, M., & Woo, J. (2010). Public debt and growth.
14. Moody’s Investors Service (2017). Oman's Baa1 rating balances high wealth and government net asset position against challenges from high oil dependence. 23 Mar 201.Retrieved from: https://www.moodys.com/research/Moodys-Omans-Baa1-rating-balances-high-wealth-and-government-net--PR_363975
15. Moody’s Investors Service (2017). Sovereigns -- Gulf Cooperation Council: Currency Risks Still Low on Average, But Rising in Oman and Bahrain. 15 Mar 2017. Retrieved from:https://www.moodys.com/research/Moodys-Currency-risks-rising-in-Oman-and-Bahrain-but-remain--PR_363470
16. Ostry, M. J. D., Ghosh, M. A. R., & Espinoza, R. A. (2015). When should public debt be reduced?. International Monetary Fund.
17. Pandow, B. (2017). Public Debt Management. Germany: LAP LAMBERT Academic Publishing. 18. Panizza, U., & Presbitero, A. F. (2014). Public debt and economic growth: is there a causal effect?.
Journal of Macroeconomics, 41, 21-41.
19. Salsman, R. M. (2017). The Political Economy of Public Debt: Three Centuries of Theory and Evidence. Edward Elgar Publishing.
20. Schclarek, A. (2004). Debt and economic growth in developing and industrial countries. Lund University Department of Economics Working Paper, 2005, 34.