Munich Personal RePEc Archive
Changes in the geographical structure of
trade in Central Asia: Real flows in the
1989-2016 period versus gravity model
predictions
Gharleghi, Behrooz and Popov, Vladimir
Dialogue of Civilizations Research Institute
17 September 2018
Online at
https://mpra.ub.uni-muenchen.de/89041/
1 Changes in the Geographical Structure of Trade in Central Asia: Real Flows in the 1989-2016 Period versus Gravity Model Predictions1
Behrooz Gharleghi*,
Email: Gharleghi.bn@gmail.com
Vladimir Popov*,
Email: vpopov@doc-research.org
* Dialogue of Civilizations Research Institute, Berlin, Germany
Sep 2018
Abstract
In the 1980s, six former southern republics of the USSR (Azerbaijan, Kazakhstan,
Kyrgyzstan, Tajikistan, Turkmenistan, and Uzbekistan), like other former Soviet republics, traded
very intensively both between themselves and with the other Soviet republics, but had a meagre
volume of trade with the rest of the world. After the transition to the market, the deregulation of
foreign trade, and the collapse of the USSR in the 1990s, trade between the former Soviet republics
shrank dramatically and was only partially replaced by trade with other countries, mostly from
Western Europe. In the 2000s and 2010s, the relative importance of trade with Western Europe
has declined and the share of trade with China and other Asian countries has grown.
This paper compares changes in the geographical structure of trade of both former Soviet
republics (Central Asian countries and Azerbaijan) and Turkey, with the predictions of the gravity
model. The gravity model suggests that trade between two countries is proportionate to their
respective GDPs and is inversely related to the geographical distance between them.2 Turkey
serves as a yardstick for comparison. For Turkey, changes in its geographical trade structure
resulted from a rise in the proportion of trade with Asian countries and a decline in the proportion
of trade with other regions in the world economy. In contrast, for the former Soviet republics there
1 This is a working paper at DOC Research Institute that was conducted for the Food and Agriculture Organization
of the United Nations (FAO) on scenarios of agricultural development in Central Asia. The article can be found at
https://doc-research.org/2018/09/geographical-structure-trade-central-asia/
2 The Central Asian region, in accordance with the FAO classification, includes six former Soviet republics –
2
was an additional reason for changes in their geographical trade structure: the collapse of trade
within the former USSR.
Introduction
Tables 1 and 2 provide, to the best of our knowledge, the only available estimate () of the
intensity of trade in republics of the former Soviet Union for 1989. Trade flows are represented in
domestic prices and GDP data is estimated from official data on net material product, so the shares
of trade in GDP for 1989 are not totally comparable with data for the 1990s and 2010s, but the
general picture is so obvious as to not depend on data adjustment; former Soviet republics had a
huge volume of trade with each other and a very modest amount of trade with the outside world.3
‘Domestic’ trade represents trade among former Soviet republics and ‘foreign’ trade represents
[image:3.612.72.526.382.690.2]trade with the rest of the world.
Table 1:Trade flows and trade balances for former Soviet republics, 1989, as a percentage of GNP
Republics Trade flowsa Trade balance
Domestic Foreign Domesticb Foreign Total, in
do-mestic prices
Total in world prices
USSR 21.11 8.27 -0.01(-0.14) -5.76 -5.78 0.21
Russia 12.92 9.37 0.05 (0.02) -6.28 -6.23 5.76
Ukraine 26.90 7.14 2.55 (-0.3) -4.61 -2.05 -2.04
Belarus 44.56 7.39 11.14 (-1.6) -5.42 -5.72 -5.78
Lithuania 47.26 7.21 -6.56 (4.0) -5.83 -12.39 -29.97
Latvia 46.85 7.21 -1.03 (5.2) -6.18 -7.21 -13.39
Estonia 50.11 8.79 -5.27 (5.3) -7.03 -12.31 -22.86
Moldova 45.88 6.37 -1.87 (5.6) -7.86 -9.74 -24.34
Armenia 47.85 5.84 -4.23 (-2.5) -9.70 -13.92 -17.40
Georgia 37.88 5.90 1.98 (-4.9) -6.15 -4.17 -13.43
Azerbaijan 35.38 5.95 13.89 (-2.6) -6.61 -7.28 -3.31
3 We refer to GDP throughout the paper, but due to the limited availability of data, percentages at this point in the
3
Kazakhstan 29.48 4.69 -14.47(-1.3) -5.09 -19.56 -17.69
Uzbekistan 34.10 5.62 -5.78 (-1.4) -0.59 -6.37 -8.71
Turkmenistan 37.58 4.60 -1.53 (-3.0) -3.07 -4.60 0.00
Kyrgyzstan 39.65 5.98 -7.21 (0.4) -10.24 -17.45 -15.86
Tajikistan 37.70 6.01 -15.32 (3.0) -2.10 -17.42 -16.52 Notes:
a (Exports + Imports)/(2xGNP), at domestic prices, assuming the same GNP/NMP ratios for the republics as for the
USSR as a whole. Domestic trade is trade with the rest of the USSR. Foreign trade is trade with the rest of the world.
b Estimates of the balance of tourist trade are shown in brackets.
Source: Commission of European Communities, 1990.
This pattern changed dramatically in the 1990s. Trade within the former Soviet Union
collapsed and began to be replaced by trade with other countries (see tables 2 and 3; also fig. 1),
but the process was extremely slow, such that by 2016 total foreign trade as a percentage of GDP
was still far lower than pre-transition levels of trade with other former Soviet republics and other
foreign countries together.
Tables 2 and 3 and figure 1 show the share of trade as a percentage of GDP at four different
times. Evidently, the relative size of trade was reduced significantly in the beginning of the 1990s.
This was due to the breakdown of the Soviet Union in 1991 and the subsequent collapse of
intra-USSR trade flows in the early 1990s. Trade began to recover between 1996 and 2001, but today
[image:4.612.72.519.72.184.2]the share of trade in GDP is still considerably lower than in 1989.
Table 2: Trade as a percentage of GDP
Country 1989 1996 2001 2016
AZE 41.33 4.97 11.71 12.00
KAZ 34.17 8.26 10.83 13.65
KGZ 45.63 16.26 10.87 25.8
TJK 43.71 8.87 10.33 16.52
TKM 42.18 11.39 16.64 13.59
TUR 25.55 17.61 12.27 17.7
UZB 39.72 11.07 8.5 8.6
Note: AZE: Azerbaijan; KAZ: Kazakhstan; KGZ: Kyrgyzstan; TJK: Tajikistan; TKM: Turkmenistan; TUR: Turkey; UZB: Uzbekistan
4
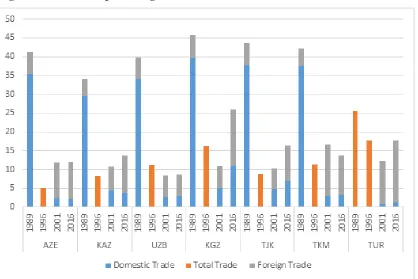
Figure 1 shows changes in the share of actual trade in GDP in former Soviet republics and in
Turkey over the period 1989-2016. Even though 1989 data is not totally comparable with the
following years, the comparison is very telling. The share of foreign trade in GDP fell dramatically
in the early 1990s and has not yet recovered to the old Soviet level. All former Soviet republics
traded much more intensively in Soviet times – mostly among themselves. Today they trade mostly
with other countries, but the relative size of this trade is way below the levels of trade reached
during the era of the USSR.
Table 3: Breakdown of trade flows for Central Asian republics and for Turkey as a percentage of GDP (domestic refers to trade between the Central Asian countries, plus Russia, while foreign trade refers to US+EU+China+ rest of the world)4
Country
1989 1996 2001 2016
domestic foreign Total domestic foreign domestic foreign
AZE 35.38 5.95 4.97 2.26 9.45 2.13 9.87
KAZ 29.48 4.69 8.26 4.41 6.42 3.74 9.91
KGZ 39.65 5.98 16.26 5.02 5.85 11.04 14.77
TJK 37.70 6.01 8.87 4.78 5.55 6.87 9.65
TKM 37.58 4.60 11.39 2.97 13.66 3.23 10.36
TUR 25.55 17.61 0.88 11.39 1.24 16.47
UZB 34.10 5.62 11.07 2.83 5.67 3.02 5.58
Note: AZE: Azerbaijan; KAZ: Kazakhstan; KGZ: Kyrgyzstan; TJK: Tajikistan; TKM: Turkmenistan; TUR: Turkey; UZB: Uzbekistan
Source: Commission of European Communities, 1990; WDI; COMTRADE.
4 For 1989, domestic trade includes trade with other former Soviet republics as well (the three Baltic states,
[image:5.612.76.510.280.477.2]5 Figure 1: Trade as a percentage of PPP GDP
Source: Commission of European Communities, 1990; WDI; authors’ calculations.
The model
We use the gravity model of international trade, which incorporates both economic
potential and distance as determinants of trade flow. The model was first introduced to economics
by Isard (1954). Among other factors, the economic size of trading partners and trade resistance
are crucial determinants of trade flows. Geographical resistance between countries is used as a
proxy for trade resistance, so the formula for trade flows between two countries, i and j, is as
follows:
𝑇𝑟𝑎𝑑𝑒 𝐹𝑙𝑜𝑤 = 𝜏𝐺𝐷𝑃𝑖
𝛼∗ 𝐺𝐷𝑃 𝑗𝛽 𝐷𝐼𝑆𝑇𝑖𝑗𝛾
Where GDPi and GDPj are Gross Domestic Product for countries i and j; 𝐷𝐼𝑆𝑇𝑖𝑗 is the distance
6
We make a very crude estimate by assuming all parameters are equal to 1 instead of
estimating them from a regression equation. But this crude estimate is sufficient at this point to
demonstrate the major discrepancies between predicted and actual trade patterns.
Very often a dummy variable is introduced into gravity models to account for common
culture, language, and history; landlocked status; and memberships in trading blocs and the WTO.
Some of these factors (culture and language) have been taken into account in augmented gravity
models by various scholars (e.g., Filippini and Molini, 2003).
Landlocked status is an important consideration for Central Asian countries and Azerbaijan
because all of them are landlocked. Conventional understandings of trade believe landlocked status
harms development by reducing trade and the gravity model seems to confirm this opinion (see
Carmignani, 2015). However, there is no evidence of a systematic relationship between landlocked
status and the trade-to-GDP ratio. Switzerland and Austria are landlocked countries, but their
trade-to-GDP ratios are very high. Carmignani explored the possibility that landlocked status
might affect GDP independently. He suggested that landlocked status has a negative impact on
GDP but that this impact is transmitted through institutions rather than through trade.
The results from the study by Ariekot (2017) show that landlocked countries are negatively
affected by the time taken by importing. However, these delays are only associated with a 0.19%
decrease in trade.
Data
In order to compute predicted trade, we used GDP at Purchasing Power Parity (GDP PPP).
GDP at PPP is a good representative of the economic condition of the country as it does not
incorporate the impact of the exchange rate.
Data for distance between countries was taken from the CEPII, a French international
economics research centre which produces research and data on the world economy; GDP data
comes from the World Bank’s World Development Indicators database; trade data was collected
from the UN’s COMTRADE database.
The distance used in this report is the distance between the capital cities of trade
counterparts. However, in order to estimate a distance between these economies and the rest of the
7
Brazil); Europe (represented by Berlin, Germany); Africa (represented by N'Djamena, Chad);
Australia and Oceania (represented by Canberra); East Asia (represented by Tokyo, Japan); and
South Asia (represented by New Delhi, India), took the distances of the respective Central Asian
countries from these locations, and divided the sum of these distances by six. To estimate the
distances between the countries of Central Asia – for interregional trade – we added up the
distances between each pair of Central Asian countries and then divided by six.
Trends
Comparing trade flows in 2001 and in 2016 shows that the relative volume of trade as a
percentage of GDP remained almost the same, but the magnitude of trade changed. Trade with
China has increased considerably in 2016, compared to 2001, partially at the expense of trade with
the EU and partially at the expense of the rest of the world. This is in line with the implications of
the gravity concept. It is not just that the Chinese economy is now the largest in the world, but also
the fact that it has been growing faster in recent decades than most other countries and regions.
Figure 2 depicts the predicted trade share vs actual trade share with different foreign trading
partners for Turkey and Central Asian countries in 2001. It demonstrates that overall, Central
Asian countries trade with Russia more than the gravity model predicts. This is also true with
respect to trade between Central Asian countries themselves. Russia and Central Asian countries
are considered to be ‘overtraded’ countries – where actual trade is higher than predicted – whereas
China, the US, the EU, and the rest of the world are ‘under-traded’ regions for Central Asian
countries. To be more precise, the EU was an under-traded region for all countries except for
Azerbaijan and Uzbekistan. And the rest of the world trade also traded less than would have been
8 Figure 2: Predicted vs actual trade share with various regions as a percentage of total trade in 2001 Overtraded countries: 2001 Under-traded countries: 2001 Russia Intra-Trade China US EU
Rest of the world (ROW)
Note: AZE: Azerbaijan; KAZ: Kazakhstan; KGZ: Kyrgyzstan; TJK: Tajikistan; TKM: Turkmenistan; TUR: Turkey; UZB: Uzbekistan
Source: COMTRADE, WDI, CEPII, authors’ calculations.
Figure 3 presents predicted trade and actual trade for different regions as a percentage of
total trade for 2016. Central Asian countries, except Turkey, traded with Russia more than the
gravity model would have predicted. Intra-regional trade had a higher than predicted share of total
trade for all countries. China traded less than the gravity model would have predicted with all
countries except for Tajikistan and Turkmenistan; China’s trade with Kyrgyzstan was virtually
equal to the level predicted. Trade with the US was lower than predicted for all countries of Central
Asia, and trade with the EU was below the level predicted for all countries except for two oil rich
economies, Azerbaijan and Kazakhstan. Trade with the rest of the world was lower than predicted
for most Central Asian countries except for Azerbaijan and Turkey. 0% 10% 20% 30% 40% 50% 60% 70% 80% 90% 100% Pre d ic te d A ctu al Pre d icte d A ctu al Pre d ic te d A ctu al Pre d ic te d A ctu al Pre d ic te d A ctu al Pre d ic te d A ctu al Pre d ic te d A ctu al
AZE KAZ KGZ TJK TKM TUR UZB
9 Figure 3: Predicted vs actual trade share with various regions as a percentage of total trade in 2016 Overtraded countries: 2016 Under-traded countries: 2016 Russia
Intra-regional trade
China
US
EU
Rest of the world (ROW) Source: COMTRADE, WDI, CEPII, authors calculations.
The overall 2016 geographical trade structure was more in line with what the gravity model
would have predicted than the 2001 structure, but Russia and Central Asia were still overtraded
regions, whereas China, the EU, the US and the rest of the world were under-traded.
Trade with China increased considerably in 2016, compared to 2001, partially at the
expense of trade with the EU and partially at the expense of trade with the rest of the world. This
highlights the importance of China as a neighbouring country in the region and of the rapid growth
of China’s GDP.
Interpretation
The greater-than-predicted trade between Russia and Central Asian countries, and between
Central Asian countries themselves, has a natural explanation: that these countries all belonged to 0% 10% 20% 30% 40% 50% 60% 70% 80% 90% 100% Pre d ic te d A ctu al Pre d ic te d A ctu al Pre d ic te d A ctu al Pre d ic te d A ctu al Pre d ic te d A ctu al Pre d ic te d A ctu al Pre d ic te d A ctu al
AZE KAZ KGZ TJK TKM TUR UZB
10
the former Soviet Union and still have some common socio-cultural features and a common
language, which obviously facilitate trade.
In contrast, trade with the EU goes through Russia, creating customs-related problems in
addition to the simple problem of remote distance. For trade with China, transportation facilities
are scarce – roads and railways being hampered by difficult mountainous landscapes on one hand
and a history of strained geopolitical relations between China and USSR since the late 1960s on
the other hand. However, the new One Belt One Road (OBOR) initiative aims to improve trade
connectivity between China and Central Asian countries. Central Asia is bound to become one of
the major transportation routes for Chinese trade with Europe and Middle East.
An oil pipeline from Kazakhstan to China and a gas pipeline from Turkmenistan to China
were recently completed. Khorgos Gateway, a dry port on the China-Kazakh border that is seen as
a key cargo hub on the new Silk Road, began operations in August 2015. In December 2017, at
the tripartite meeting between China, Uzbekistan, and Kyrgyzstan, decisions were taken on the
Uzbekistan-Kyrgyzstan-China railway project. This project will shorten the route to China and
provide access to the Middle East and to Europe through the Transcaucasian corridor.
The Mazar-e-Sharif–Herat railway, which is a continuation of the existing Hairatan–
Mazar-e-Sharif rail line, connects Uzbekistan to Afghanistan. Based on expert estimates, a direct
railway link between the Iranian port of Chabahar and Mazar-e-Sharif and Herat could increase
foreign trade turnover by almost 50% in Afghanistan which is a neighbouring country to Central
Asia.5 By having access to the Iranian port of Chabahar, the railway will grant market access to
India. In return, India will have access to Central Asia and the wider Eurasian region. Another
railway development between the Iranian city of Khaf and Herat in Afghanistan is also expected
to increase the volume of trade in the region.
Conclusions
For all countries considered, the geographical structure of trade changes in the direction of
the structure predicted by the gravity model: less trade with Russia and Europe; more trade with
China and Rest of the world. But this process is happening faster for former Soviet republics rather
than for Turkey. For some of these countries – Kyrgyzstan, Tajikistan, Turkmenistan – trade with
5 Zilola Karimova of the Center for International Relations Studies, Tashkent, a body affiliated to Uzbekistan’s
11
China was already close to one-third or over of total trade (between 29% and 49%) and was even
higher than the predictions of the gravity model.
This is probably explained by the fact that former Soviet republics, after experiencing the
collapse of trade with the former Soviet Union, were less and still are less involved in international
trade than other countries of the same size and level of development. Their trade-to-GDP ratios
are similar to that of Turkey (fig. 1), which is a much bigger economy, whereas smaller countries
normally have higher ratios for external trade-to-GDP. Unlike Turkey, which is restructuring its
trade by finding new partners in China instead of old partners in Europe, former Soviet republics
are building up their foreign trade from scratch, and, like in many other cases, building anew turns
out to be easier than restructuring. The external trade of former Soviet republics will likely
continue to grow at an accelerated pace, predominantly due to the expansion of trade with China
and Asia.
References
Ariekot, C. (2017). Trade Facilitation and Landlocked countries. Lund University, school of
economics and management.
Carmignani, F. (2015). The curse of being landlocked: Institutions rather than trade. The World
Economy, 38(10), 1594-1617.
Chowdhury, A., V. Popov (2016b). What Uzbekistan tells us about industrial policy that we did
not know? - DESA working paper No. 147. February 2016.
Commission of European Communities (1990). Stabilization, Liberalization and Devolution:
Assessment of the Economic Situation and Reform Process in the Soviet Union. A Report,
prepared by Commission of the European Communities. December 1990, p. 173. (Data is
derived from official Soviet statistics); Narodnoye Khozyaistvo SSSR v 1989 godu (National
Economy of the USSR in 1989). Moscow, 1990, p. 638.
12
Filippini, C. and Molini, V. (2003). “The Determinants of East Asian Trade Flows: A Gravity
Equation Approach, Journal of Asian Economics 14(5), 695-711.
Isard, W. (1954). Location Theory and Trade Theory: Short-Run Analysis. Quarterly Journal of
Economics, 68(2), p. 305. doi:10.2307/1884452
Karimova, Z. (2018, April 12). Connecting Asia: Uzbekistan looks to capitalize on Central
Asia’s transport potential. The Diplomat. Retrieved from
https://thediplomat.com/2018/04/connecting-asia-uzbekistan-looks-to-capitalize-on-central-asias-transport-potential/.
WDI (2017). World Development Indicators 2017. Excel Data. 15.09.2017.
– Washington, DC: International Bank for Reconstruction and Development / The World Bank,
2017. Avaiable under: https://data.worldbank.org/data-catalog/world-development-indicators