ORIGINAL RESEARCH
Do Apparent Diffusion Coefficient Measurements
Predict Outcome in Children with Neonatal
Hypoxic-Ischemic Encephalopathy?
L. Liauw G. van Wezel-Meijler S. Veen M.A. van Buchem J. van der Grond
BACKGROUND AND PURPOSE: Diffusion-weighted imaging (DWI) permits early detection and quanti-fication of hypoxic-ischemic (HI) brain lesions. Our aim was to assess the predictive value of DWI and apparent diffusion coefficient (ADC) measurements for outcome in children with perinatal asphyxia.
MATERIALS AND METHODS:Term neonates underwent MR imaging within 10 days after birth because of asphyxia. MR imaging examinations were retrospectively evaluated for HI brain damage. ADC was measured in 30 standardized brain regions and in visibly abnormal areas on DWI. In survivors, developmental outcome until early school age was graded into the following categories: 1) normal, 2) mildly abnormal, and 3) definitely abnormal. For analysis, category 3 and death (category 4) were labeled “adverse,” 1 and 2 were “favorable,” and 2–3 and death were “abnormal” outcome. Differ-ences in outcome between infants with and without DWI abnormalities were analyzed by using2 tests. The nonparametric Mann-WhitneyUtest analyzed whether ADC values in visible DWI abnor-malities correlated with age at imaging. Logistic regression analysis tested the predictive value for outcome of the ADC in each standardized brain region. Receiver operating characteristic analysis was used to find optimal ADC cutoff values for each region for the various outcome scores.
RESULTS: Twenty-four infants (13 male) were included. Mean age at MR imaging was 4.3 days (range, 1–9 days). Seven infants died. There was no difference in outcome between infants with and without visible DWI abnormalities. Only ADC of the posterior limb of the internal capsule correlated with age. ADC in visibly abnormal DWI regions did not have a predictive value for outcome. Of all measurements performed, only the ADC in the normal-appearing basal ganglia and brain stem correlated significantly with outcome; low ADC values were associated with abnormal/adverse outcome, and higher ADC values, with normal/favorable outcome (basal ganglia:P⫽ .03 for abnormal,P ⫽.01 for adverse outcome; brain stem:P⫽.006 for abnormal,P⫽.03 for adverse outcome).
CONCLUSIONS:ADC values in normal-appearing basal ganglia and brain stem correlated with out-come, independently of all MR imaging findings including those of DWI. ADC values in visibly abnormal brain tissue on DWI did not show a predictive value for outcome.
N
eonatal hypoxic-ischemic (HI) brain injury is one of the most important causes of neurologic disabilities during childhood, accounting for more than half of the cases of cere-bral palsy.1,2MR imaging is an established tool to detectneo-natal brain injury, and it plays an important role in the pre-diction of neurologic outcome in neonates with HI brain injury.2-6MR imaging findings of the brains of neonates with HI encephalopathy (HIE) have been described by many au-thors.1,3,4,6,7Conventional T1- and T2-weighted images are
used most often but findings may be normal despite signifi-cant brain injury, especially when imaging is performed early, during the first few days after the event.1,3,6,7
Diffusion-weighted imaging (DWI) often reveals HI brain injury at an earlier stage than conventional MR imaging8-11; in
addition, it provides quantitative apparent diffusion coeffi-cient (ADC) values in brain tissue.12-16It has been proposed
that these quantitative measures may have additional diagnos-tic value, especially in cases with diffuse lesions that may re-main below the threshold of visual detection. Some articles have published normal values for ADC in different regions of
the normal brain in young infants.12,13,16,17Others have
re-ported abnormal ADC values in severely abnormal (as shown by MR imaging) white matter and deep gray matter, during the first week after the HI event.11-13,18-22However, in none
of these studies were ADC values related to longer follow-up.11-13,18-22In addition, none of these study outcomes were
related to ADC in normal-appearing brain regions. To our knowledge, only 1 relatively small study in 11 neonates de-scribed the predictive value of DWI and ADC measurements for outcome at 24 months of age in children born asphyxiat-ed.23Predictive values of DWI or ADC were not calculated. In
that study, DWI was measured only in the basal ganglia and periventricular white matter. No discrimination between re-gions with visible DWI abnormalities and normal-appearing regions was made.
In the present study, we investigated the value of DWI for outcome prediction until early school age in neonates with HIE. Our aim was to assess the following: 1) the relation be-tween visible DWI abnormalities and outcome, and 2) the relation to outcome of ADC values in regions with and with-out visible DWI abnormalities.
Materials and Methods
Subjects
The institutional review board approved this retrospective study and waived informed consent. Brain MR imaging studies performed
be-Received June 15, 2008; accepted after revision August 11.
From the Departments of Radiology (L.L., M.A.v.B., J.v.d.G.) and Neonatology (G.v.W.-M., S.V.), Leiden University Medical Center, Leiden, the Netherlands.
Please address correspondence to L. Liauw, MD, Department of Radiology/667, Radboud University Nijmegen Medical Center, PO Box 9101, 6500 HB Nijmegen, the Netherlands; e-mail: [email protected]
tween January 2001 and December 2003 in infants who were born at a gestational age of⬎37 weeks and who underwent MR imaging to assess brain injury due to perinatal asphyxia were selected as previ-ously described.24All MR imaging examinations were performed within 10 days after birth. All 24 infants included in our study were born at or transferred to our institution and were admitted to our tertiary neonatal intensive care unit. They were included if they ful-filled all the following criteria: 1) signs of fetal distress before delivery (abnormal cardiotocographic recording such as decreased variability, late deceleration, baseline bradycardia); 2) Apgar score of⬍7 after 5 minutes; 3) umbilical cord blood pH level of⬍7.2; 4) clinical signs of HIE25; and 5) radiologic evidence of HI brain injury on MR imaging as reported by the attending neuroradiologist.
Evaluation of the clinical history, retrospectively based on data from individual patient documentation, was performed by 1 author (S.V., having 23 years of experience in neonatology and neonatal fol-low-up). This author was blinded to the results of the brain MR im-aging examinations and ADC measurements. Neonatal clinical clas-sification of HIE was retrospectively graded according to Sarnat and Sarnat.25HIE stage 1 indicates a mild encephalopathy, lasting⬍24 hours with normal findings on electroencephalography (EEG). HIE stage 2 indicates a moderate encephalopathy, with the infant being lethargic and hypotonic and having seizures. In HIE stage 3, there is a severe encephalopathy with the infant being comatose and severely
hypotonic with decreased or absent reflex activity and a severely de-pressed EEG finding.25
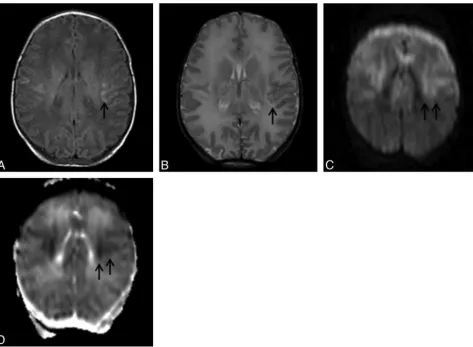
Surviving infants visited the outpatient clinic of our institution or the referring hospital at regular intervals, at the ages of 3 months, 1 year, 2 years, and 5 years. If necessary as judged by the clinical condi-tion, additional visits were scheduled. All surviving infants underwent developmental and neurologic examinations performed by experi-enced and specially trained neonatologists, pediatricians, or child neurologists. In surviving children, developmental outcome at clini-cal follow-up was graded as follows21: 1) normal—that is, normal neurologic examination findings, normal cognitive developmental history, and normal Van Wiechen examination findings (a Dutch child health care developmental assessment tool based on the devel-opmental scales of Gesell and adapted by Touwen and Hempel26,27); 2) mildly abnormal—that is, mildly abnormal neurologic findings (mild hypertonia, hypotonia, and/or asymmetry) and/or mildly ab-normal cognitive developmental history (such as mild speech and language delay, mild behavioral disorders, and/or the need for reme-dial teaching at school) and/or mildly abnormal Van Wiechen exam-ination findings; and 3) definitely abnormal—that is, children with major neurologic problems, such as cerebral palsy and/or severe cog-nitive function disorders and/or epilepsia and/or severely abnormal Van Wiechen examination findings. Outcome was classified in cate-gory 4 in case of neonatal death. For analysis, outcome categories 1 Fig 1.A, T1-weighted image: TR/TE, 550/14 ms; signals acquired, 2; matrix, 205/256; section thickness, 5 mm; section gap, 0.5 mm; FOV, 16 cm.B, T2-weighted image: TR/TE, 5405/120 ms; signals acquired, 2; matrix, 205/256; section thickness, 5 mm; section gap, 0.5 mm; FOV, 16 cm.C,b⫽1000 DWI image: TR/TE, 4299/74 ms; section thickness, 6 mm; b-value of 1000 s/mm2
.D, ADC image. These images are of an infant of outcome group 3 (definitely abnormal outcome at 4 years 9 months of age). The T1-weighted (A) image shows irregular high SI in and around the peri-Rolandic cortex (arrow). The T2-weighted image (B) shows abnormal high SI in the subcortical white matter around the peri-Rolandic area (arrow). Theb⫽1000 DWI (C) shows high SI in the peri-Rolandic area and the central white matter (arrows). The ADC image (D) shows low SI in the peri-Rolandic area and the central white matter (arrows).
PEDIATRICS
ORIGINAL
[image:2.594.59.533.40.387.2]and 2 were labeled “favorable”; categories 3 and 4, “adverse”; and categories 2– 4, “abnormal.” Outcome was retrospectively graded by 1 author (S.V.), again blinded to the MR imaging findings and also to the neonatal clinical classification. Outcome classification was based on a compilation of all available information of all follow-up visits.
MR Imaging
If necessary, the infants were sedated. In ventilated sedated infants or infants on antiepileptic medication, this sedation was performed by increasing the dosage of the sedative or antiepileptic medication just before the MR imaging procedure. Those who were not on sedatives or antiepileptic medication received chloral hydrate, 50 –70 mg/kg, administered orally 30 minutes before imaging. Infants were posi-tioned supine and snuggly swaddled in blankets during the imaging procedure. Ear protection was used and consisted of commercially available neonatal ear muffs (MiniMuffs; Natus Medical, San Carlos, Calif) placed over the ears. The infant’s head was immobilized by molded foam put around the head during the imaging procedure. The temperature was maintained and heart rate and oxygen saturation were monitored throughout the procedure. A physician experienced in neonatal resuscitation was always present during imaging and transportation to and from the MR imaging unit.
Images were obtained with superconducting magnets (Gyroscan ACS-NT 15; Philips Medical Systems, Best, the Netherlands) operat-ing at a field strength of 1.5T. T1-weighted spin-echo sequences (TR/ TE, 550 –560/14 –20 ms), T2-weighted spin-echo sequences (TR/TE, 5406 – 6883/100 –120 ms), fluid-attenuated inversion recovery se-quences (TR/TE, 6000 – 8000/110 –120 ms; TI, 2000 ms), T1-weighted gadolinium-enhanced spin-echo sequences (TR/TE, 550 – 560/14 –20 ms), and DWI were performed. DWI was performed by using a single-shot spin-echo echo-planar sequence (TR/TE, 5132– 4200/74 ms) with a b-value of 1000 s/mm2. All sequences were per-formed in transverse planes. Section thickness was 4 –5 mm with an intersection gap of 0.4 – 0.5 mm. For DWI, section thickness was 6 mm. Because this was a retrospective study, MR spectroscopy was not routinely performed in this patient group.
MR Imaging Data Collection
All MR images were retrospectively evaluated by 2 authors, a neona-tologist and a neuroradiologist, both experienced in neonatal neuro-imaging (G.v.W.-M. and L.L.; G.v.W.-M. having 16 and L.L. having 9 years of experience). Both reviewers were blinded to the infants’ iden-tities and thus to the clinical history of the infants. DWI abnormalities were independently assessed on a 5-point scale. The confidence of the investigator for the detection of the abnormality was scored with a diagnostic confidence score, assigned by using a 5-point scale: defi-nitely abnormal, probably abnormal, equivocal, probably normal, or definitely normal. In a consecutive consensus reading, final DWI ab-normalities were assessed. In this consensus reading, conventional T1- and T2-weighted images were also assessed, and it was indicated whether brain injury was present and which type of injury pattern was present in each infant. Consensus was reached in all cases.24
ADC Measurements
ADC measurements were independently performed in 30 standard-ized regions of the brain by 1 author (L.L.), who was blinded to the patient’s identity, by using Philips Medical Systems proprietary software. In addition, ADC measurements were performed in brain regions that appeared visibly abnormal on DWI. All measurements were retrospec-tively performed on the MR imaging operator console. All MR imaging
examinations were reloaded from the archives. Trace maps were used to calculate ADC values in all regions of interest. Because of image defor-mation in the DWI acquisition, regions of interest were identified on the original T2-weighted images and visually matched and positioned on the
b⫽0 image of the DWI acquisition, which can be considered as fast T2-weighted echo-planar MR imaging. From there, the region of interest was copied onto the corresponding ADC map. Oval regions of interest were used for all regions. Regions of interest were drawn to include as much of the structure as possible. Care was taken to avoid inclusion of CSF in any region of interest. In both hemispheres, regions of interest were drawn in the white matter of the semioval center anteriorly and posteriorly, close to the central sulcus, head of the caudate nucleus, pu-tamen and globus pallidus, posterior limb of the internal capsule (PLIC), frontal and posterior white matter at the level of the basal ganglia, medial and lateral part of the thalamus, middle cerebellar peduncle, temporal and occipital white matter, white matter in the cerebellar hemispheres, and the cerebral peduncles in the brain stem at the level of the red nu-cleus. Care was taken not to place the region of interest in the dentate nucleus or the cerebellar folia when measuring the cerebellar white mat-ter. The area of each region of interest was 0.3–1 cm2, except in the PLIC and central sulcus, where the region-of-interest areas were 0.15– 0.2 cm2.
Statistical Analysis
All statistical analyses were performed by 1 author (J.v.d.G.) by using the Statistical Package for the Social Sciences software (SPSS for Win-dows, Version 14.0.2; SPSS, Chicago, Ill). To study whether outcome (adverse-favorable, abnormal-normal) differed between infants with and without visible DWI abnormalities, we used2tests. The non-parametric Mann-WhitneyUtest was used to analyze whether ADC values in visible DWI abnormalities and in normal-appearing brain regions displaying no visible abnormalities on conventional MR im-aging, DWI, and ADC images correlated with the postnatal age at imaging. To investigate the predictive value on outcome of ADC val-ues in each brain region, we used logistic regression analysis in which age at imaging was entered as a covariate. Receiver operating charac-teristic analysis was used to find optimal ADC cutoff values for each region for the various developmental outcome scores. AP⬍.05 was considered statistically significant.
Results
Outcome
Twenty-four infants (13 male) were included in this study. Mean age at MR imaging was 4.3 days (range, 1–9 days), mean postconceptional age was 41 weeks (range, 37⫹4 ⫺ 43⫹3 weeks). Of the infants who were included in this study, 10 were sedated; the other 15 infants did not require (additional) med-ication. MR imaging showed no prevailing HI injury pattern. Table 1 shows outcome in relation to the neonatal clinical classification. Outcome of the surviving infants was scored at the minimum age of 2 years (range, 2.08 –5.75 years; mean, 3.75 years; median, 3.46 years; SD, 1.28). In all 7 children (4 males) who died (mean, 8.4 days after birth; median, 7 days; range, 4 –13 days), the cause of death was respiratory failure and/or multiorgan failure due to perinatal asphyxia.
DWI Findings
following 36 abnormalities were seen on DWI (Fig 1): 5 SI changes in the basal ganglia, 1 SI change in the thalamus, and 6 SI changes in the PLIC. Five abnormalities were recognized as arterial infarction; 6, as borderzone infarction; and 3 le-sions, as punctate white matter lesions. In 10 infants, the white matter of the cerebral hemispheres had diffusely abnormal SI on DWI.
There was no difference in outcome between infants with and without visible DWI abnormalities. A significant correla-tion between ADC values in visible DWI abnormalities (in 10⫺6/mm2/s) and age at imaging was found only for the PLIC,
showing a strong correlation between ADC values and post-natal age at imaging (R⫽0.823,P⫽.003). ADC values in visibly abnormal regions on DWI did not have any predictive value for outcome (corrected for age at imaging).
Normal-Appearing Brain Tissue Findings
Normal-appearing brain tissue displayed no visible abnormal-ities on conventional MR imaging, DWI, and ADC images. In 4 normal-appearing brain regions, ADC was significantly re-lated to age at imaging. Higher ADC values were found with increasing age in the occipital white matter (R⫽0.622,P⫽
.011), temporal white matter (R⫽0.578,P⫽.024), PLIC (R⫽
0.501,P⫽.025), and medial thalamus (R⫽0.451,P⫽.027). In none of the other normal-appearing regions was a signifi-cant correlation found.
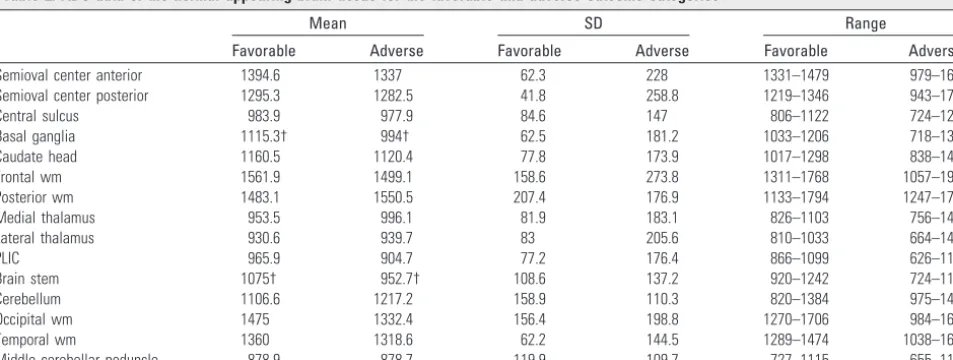
Table 2 shows the ADC values in the normal-appearing regions (on conventional MR imaging and DWI) for neonates of the favorable (groups 1–2) and adverse (group 3, death) outcome groups. In the normal-appearing basal ganglia and brain stem, we found significantly lower ADC values in the
subgroup of neonates with abnormal/adverse outcome than in infants with normal/favorable outcome. The ADC in both re-gions correlated significantly with outcome (corrected for age at imaging: basal ganglia,P⫽.03 for abnormal,P⫽.01 for adverse outcome; and brain stem,P⫽.006 for abnormal,P⫽
.03 for adverse outcome). For none of the other normal-ap-pearing brain regions were significant correlations found with outcome.
Tables 3– 6 show the results of the receiver operating char-acteristic analyses (sensitivity, specificity, positive- and nega-tive predicnega-tive values [PPVs, NPVs], and multiple cutoff val-ues of ADC of the basal ganglia and brain stem) for abnormal (outcome groups, 2–3 and death) and adverse (outcome group 3 and death) outcomes, respectively. For abnormal out-come, the ADC cutoff level of the basal ganglia for a 100% sensitivity (0% specificity) is 1357⫻10⫺6/mm2/s and for a 100% specificity (67% sensitivity) is 1018⫻10⫺6/mm2/s (P⫽
.035). For adverse outcome, the ADC cutoff level for a 100% sensitivity (0% specificity) is 1357⫻10⫺6/mm2/s and for a
100% specificity (71% sensitivity) is 1018⫻10⫺6/mm2/s (P⫽
.014). For abnormal outcome, the ADC cutoff level of the brain stem for a 100% sensitivity (33% specificity) is 1182⫻ 10⫺6/mm2/s and for a 100% specificity (67% sensitivity) is 988 ⫻10⫺6/mm2/s (P⫽.006). For adverse outcome, the ADC cutoff level for a 100% sensitivity (29% specificity) is 1182⫻ 10⫺6/mm2/s and for a 100% specificity (47% sensitivity) is 897 ⫻10⫺6/mm2/s (P⫽.03).
For abnormal outcome, the ADC cutoff level of the basal ganglia for a 100% PPV (55% NPV) is 1018⫻10⫺6/mm2/s
(P⫽.035). For adverse outcome, the ADC cutoff level for a 100% PPV (64% NPV) is 1018⫻10⫺6/mm2/s (P⫽.014). For
Table 1: Outcome in relation to neonatal clinical classification
Neonatal classification According
to Sarnat and Sarnat25 No.
Outcome
Normal (n⫽6)
Mildly Abnormal (n⫽1)
Definitely Abnormal (n⫽10)
Died (n⫽7)
HIE grade 1 3 2 0 1 0
HIE grade 2 18 4 1 9 4
HIE grade 3 3 0 0 0 3
[image:4.594.57.534.160.340.2]Note:—HIE indicates hypoxic-ischemic encephalopathy.
Table 2: ADC data of the normal-appearing brain tissue for the favorable and adverse outcome categories*
Mean SD Range
Favorable Adverse Favorable Adverse Favorable Adverse Semioval center anterior 1394.6 1337 62.3 228 1331–1479 979–1644 Semioval center posterior 1295.3 1282.5 41.8 258.8 1219–1346 943–1775
Central sulcus 983.9 977.9 84.6 147 806–1122 724–1248
Basal ganglia 1115.3† 994† 62.5 181.2 1033–1206 718–1388
Caudate head 1160.5 1120.4 77.8 173.9 1017–1298 838–1443
Frontal wm 1561.9 1499.1 158.6 273.8 1311–1768 1057–1942
Posterior wm 1483.1 1550.5 207.4 176.9 1133–1794 1247–1791
Medial thalamus 953.5 996.1 81.9 183.1 826–1103 756–1401
Lateral thalamus 930.6 939.7 83 205.6 810–1033 664–1412
PLIC 965.9 904.7 77.2 176.4 866–1099 626–1160
Brain stem 1075† 952.7† 108.6 137.2 920–1242 724–1182
Cerebellum 1106.6 1217.2 158.9 110.3 820–1384 975–1447
Occipital wm 1475 1332.4 156.4 198.8 1270–1706 984–1628
Temporal wm 1360 1318.6 62.2 144.5 1289–1474 1038–1611
Middle cerebellar peduncle 878.9 878.7 119.9 109.7 727–1115 655–1151
Note:—wm indicates white matter; ADC, apparent diffusion coefficient; PLIC, posterior limb of the internal capsule. * Data are shown calculated from the ADC value (in 10⫺6/mm2/s).
abnormal outcome, the ADC cutoff level of the brain stem for a 100% PPV (50% NPV) is 988⫻10⫺6/mm2/s (P⫽.006). For
adverse outcome, the ADC cutoff level for a 100% PPV (44% NPV) is 897⫻10⫺6/mm2/s (P⫽.03).
Discussion
The aim of this study was to investigate the value of DWI and ADC for outcome prediction until early school age in neonates with HIE. Although ADC values in visibly abnormal brain tissue on DWI did not correlate with outcome, ADC of the normal-appearing basal ganglia and brain stem correlated with outcome, independent of all MR imaging findings, in-cluding DWI.
Apart from case reports, only a few published studies have so far addressed the predictive value of ADC measurements in
neonates with HI brain damage.10,12,13,21,23Wolf et al12
stud-ied 13 term neonates with suggested HIE within 12 days after birth. Clinical follow-up was short, but not specified. ADC values were measured in predefined brain regions; no distinc-tion was made between regions with visible DWI abnormali-ties and normal-appearing regions. Wolf et al12 found
de-creased ADC values in the PLIC, corona radiata, posterior frontal white matter, and parietal white matter in patients with HIE compared with control subjects, but they did not assess the predictive value of ADC values for outcome.
Rutherford et al13studied 63 term neonates who presented
[image:5.594.55.535.68.145.2]with early seizures, of whom 49 with HIE had undergone re-petitive MR imaging. Reduced ADC in the centrum semiovale, anterior and posterior white matter at the level of the basal ganglia, central sulcus, lentiform nucleus, medial and lateral Table 3: ROC analysis showing sensitivity, specificity, PPV, and NPV for abnormal outcome of multiple cutoff levels of ADC (in 10ⴚ6/mm2/s) of the basal ganglia*
Cutoff Level Sensitivity 95% CI† Specificity 95% CI† PPV NPV
⬍574 6.67 1.1–32.0 100.00 54.1–100.0 100.0 30.0
⬍1018.5 66.67 38.4–88.1 100.00 54.1–100.0 100.0 54.5
⬍1036.5 66.67 38.4–88.1 83.33 36.1–97.2 90.9 50.0
⬍1109.5 80.00 51.9–95.4 50.00 12.4–87.6 80.0 50.0
⬍1174 86.67 59.5–98.0 16.67 2.8–63.9 72.2 33.3
⬍1239 93.33 68.0–98.9 0.00 0.0–45.9 70.0 0.0
Note:—ROC indicates receiver operating characteristic analysis; CI, confidence interval; PPV, positive predictive value; NPV, negative predictive value. * Area under the ROC curve⫽0.767. Significance levelP(area⫽0.5)⫽.0347.
[image:5.594.51.534.202.277.2]† 95% CI⫽0.533– 0.920.
Table 4: ROC analysis showing sensitivity, specificity, PPV, and NPV for adverse outcome of multiple cutoff levels of ADC (in 10ⴚ6/mm2/s) of the basal ganglia*
Cutoff Level Sensitivity 95% CI† Specificity 95% CI† PPV NPV
⬍574 7.14 1.2–33.9 100.00 58.9–00.0 100.0 35.0
⬍1018.5 71.43 41.9–91.4 100.00 58.9–100.0 100.0 63.6
⬍1061.5 78.57 49.2–95.1 71.43 29.3–95.5 84.6 62.5
⬍1104.5 78.57 49.2–95.1 57.14 18.8–89.6 78.6 57.1
⬍1148 85.71 57.2–97.8 28.57 4.5–0.7 70.6 50.0
⬍1239 92.86 66.1–98.8 0.00 0.0–41.1 65.0 0.0
* Area under the ROC curve⫽0.786. Significance levelP(area⫽0.5)⫽.0135. † 95% CI⫽0.554 – 0.931.
Table 5: ROC analysis showing sensitivity, specificity, PPV, and NPV for abnormal outcome of multiple cutoff levels of ADC (in 10ⴚ6/mm2/s) of the brain stem*
Cutoff Level Sensitivity 95% CI† Specificity 95% CI† PPV NPV
⬍736.5 5.56 0.9–7.4 100.00 54.1–100.0 100.0 26.1
⬍988 66.67 41.0–86.6 100.00 54.1–00.0 100.0 50.0
⬍995 66.67 41.0–86.6 83.33 36.1–97.2 92.3 45.5
⬍1093 83.33 58.6–96.2 50.00 12.4–87.6 83.3 50.0
⬍1151.5 94.44 72.6–99.1 33.33 5.3–77.3 81.0 66.7
⬍1182 100.00 81.3–100.0 33.33 5.3–77.3 81.8 100.0
* Area under the ROC curve⫽0.815. Significance levelP(area⫽0.5)⫽.0061. † 95% CI⫽0.605– 0.941.
Table 6: ROC analysis showing sensitivity, specificity, PPV, and NPV for adverse outcome of multiple cutoff levels of ADC (in 10ⴚ6/mm2/s) of the brain stem*
Cutoff Level Sensitivity 95% CI† Specificity 95% CI† PPV NPV
⬍736.5 5.88 1.0–28.8 100.00 58.9–100.0 100.0 30.4
⬍897 47.06 23.0–72.1 100.00 58.9–100.0 100.0 43.7
⬍942.5 47.06 23.0–72.1 85.71 42.2–97.6 88.9 40.0
⬍1151.5 94.12 71.2–99.0 28.57 4.5–0.7 76.2 66.7
⬍1182 100.00 80.3–100.0 28.57 4.5–0.7 77.3 100.0
[image:5.594.54.533.330.406.2] [image:5.594.60.532.459.525.2]thalamus, PLIC, brain stem, and cerebellum allowed early de-tection of infarction. However, this study did not investigate the relation between ADC and long-term clinical follow-up. Boichot et al21studied the predictive value of conventional
MR imaging and DWI for neurologic outcome in 30 term neonates with severe HIE. Imaging was performed in the first 12 days after birth; outcome was evaluated after at least 12 months. A mixed pattern of cortical and basal ganglia SI ab-normalities on MR imaging was associated with unfavorable outcome. Significantly reduced ADC values were noted in all measured brain regions, especially the basal ganglia, in the unfavorable outcome group but only if MR imaging was per-formed during the first 6 days after birth.
To our knowledge, the study by L’Abee et al23is the only
one relating DWI to longer follow-up until 24 months of age in a group of 11 asphyxiated neonates. ADC values were mea-sured in the basal ganglia and the periventricular white matter of the parieto-occipital region, and neurodevelopment was assessed in survivors at 24 months. Nine of the 11 neonates had a poor outcome. ADC values in the basal ganglia were abnormally low in 5 and in the parietal white matter in 4 of the 7 patients who died. Although low ADC values had predictive value, normal ADC values were also seen in children with poor outcome. In none of these studies was ADC related to fol-low-up longer than infancy.
The most important result of our study is that ADC values in the basal ganglia and brain stem were predictive of out-come. The ADC values in the normal-appearing brain stem and basal ganglia in infants with perinatal asphyxia correlated with abnormal or adverse outcome, independent of all MR imaging findings including DWI; low ADC values were asso-ciated with abnormal/adverse outcome and higher ADC val-ues, with normal/favorable outcome. Normal-appearing brain tissue displayed no visible abnormalities on conven-tional MR imaging, DWI, and ADC images. Our finding is in accordance with several conventional MR imaging studies showing motor outcome to be related to the severity of basal ganglia and internal capsule involvement in infants with HIE.4,5,28-30
Our finding is also in agreement with the results of several other studies on ADC measurements in neonatal HIE. Boichot et al21found reduced ADC in the basal ganglia in infants with
abnormal outcomes after neonatal HIE. However, they did not discriminate between regions with visible DWI abnormal-ities and normal-appearing regions. L’Abee et al23found ab-normally low ADC values in the basal ganglia in 5 of 7 patients who died. Again, no discrimination between regions with vis-ible DWI abnormalities and normal-appearing regions was made. In a group of neonates with HIE, Vermeulen et al20
showed lower ADC in the brain stem compared with that of controls. They did not relate ADC values to outcome. Our study also seems to be in agreement with Barkovich et al,31 who showed that on follow-up imaging, abnormalities may be seen in regions of formerly normal-appearing white and gray matter. In other words, brain tissue may be abnormal despite normal appearance on (early) MR imaging. We, therefore, hypothesize that quantitative ADC measurements are more reliable in detecting abnormal brain tissue than visual analysis of conventional and DWI images.
In our clinical setting, the other important finding was that ADC values in visibly abnormal regions on DWI did not have any significant predictive value for outcome (corrected for age at imaging). There are 2 probable explanations for this re-markable finding. First, we studied a group of infants with HIE having various HI brain lesions. Possibly, if we had selected a large group of infants with a specific type of brain injury, we would have found a predictive value of ADC for outcome in abnormal-appearing regions as did Hunt et al.19They showed
that high ADC values in the PLIC were associated with survival in term infants with HIE. The lowest ADC values in the PLIC were found in survivors with severe disability and in survivors with global brain injury. Second, we imaged infants between 1 and 10 days after birth. Although 13 of 24 infants underwent imaging between 1 and 4 days after birth and only 2 infants were older than 7 but younger than 10 days, timing of imaging was still variable. It is well known that ADC values vary with time after HI as a result of the ongoing pathologic processes and that areas of abnormal diffusivity may “pseudonormalize” within the first 2 weeks of life.31
We found a strong association only between the ADC value of the PLIC, either visibly abnormal or normal, and postnatal age at imaging. Other authors have reported abnormal ADC values in injured brain tissue during the first week after the HI event; ADC values later became higher before returning to normal values.11-13,18-22Our finding may be explained by the fact that our group was relatively small and heterogeneous. It is possible that if a larger number of infants had been studied, we would have found associations between ADC values and postnatal age at imaging in more structures.
As mentioned previously, an imperfection of our study may be the timing of the MR imaging examinations, taking place up to 10 days after birth, whereas on DWI, SI abnormal-ities gradually diminish and are most obvious between 1 and 4 days after the incident.11,13,32Although postnatal age at
imag-ing was used as a covariate in our analyses, it would have been more appropriate to consider time since the inciting event. However, in most cases of perinatal asphyxia, the exact time of the inciting event is difficult to determine.1Another limitation
is that we did not perform follow-up imaging in the first 2 weeks after birth; normal ADC values do not exclude the pres-ence of abnormal tissue in neonates with HI brain dam-age.13,31Finally, because of the heterogeneity of the group we studied, showing various injury patterns, the number of in-fants with specific injury patterns was limited. This may have influenced our results, showing no predictive value of ADC in brain tissue appearing abnormal on DWI.
Conclusions
We conclude that in neonates with HIE, low ADC values of the normal-appearing basal ganglia and brain stem correlate with abnormal or adverse outcome, independently of all imaging findings. In this group of neonates with heterogeneous injury patterns, ADC values in visibly abnormal brain tissue on DWI did not have predictive value for outcome.
Acknowledgments
References
1. Cowan F, Rutherford M, Groenendaal F, et al.Origin and timing of brain lesions in term infants with neonatal encephalopathy.Lancet 2003;361: 736 – 42
2. Cowan F.Outcome after intrapartum asphyxia in term infants.Semin Neona-tol2000;5:127– 40
3. Rutherford MA.The asphyxiated term infant.In: Rutherford MA, ed.MRI of the Neonatal Brain.London: WB Saunders; 2002:99 –128
4. Rutherford MA, Pennock JM, Counsell SJ, et al.Abnormal magnetic resonance signal in the internal capsule predicts poor neurodevelopmental outcome in infants with hypoxic-ischemic encephalopathy.Pediatrics1998;102:323–28 5. Cowan FM, de Vries LS.The internal capsule in neonatal imaging.Semin Fetal
Neonatal Med2005;10:461–74
6. Barkovich AJ.Brain and spine injuries in infancy and childhood.In: Barkovich AJ, ed.Pediatric Neuroimaging.Philadelphia: Lippincott Williams & Wilkins; 2005:190 –290
7. Rutherford M, Pennock J, Schwieso J, et al.Hypoxic-ischaemic enceph-alopathy: early and late magnetic resonance imaging findings in relation to outcome.Arch Dis Child Fetal Neonatal Ed1996;75:F145–51
8. Cowan FM, Pennock JM, Hanrahan JD, et al.Early detection of cerebral infarc-tion and hypoxic ischemic encephalopathy in neonates using diffusion-weighted magnetic resonance imaging.Neuropediatrics1994;25:172–75 9. Inder T, Huppi PS, Zientara GP, et al.Early detection of periventricular
leu-komalacia by diffusion-weighted magnetic resonance imaging techniques.
J Pediatr1999;134:631–34
10. Liu AY, Zimmerman RA, Haselgrove JC, et al.Diffusion-weighted imaging in the evaluation of watershed hypoxic-ischemic brain injury in pediatric pa-tients.Neuroradiology2001;43:918 –26
11. Forbes KP, Pipe JG, Bird R.Neonatal hypoxic-ischemic encephalopathy: de-tection with diffusion-weighted MR imaging. AJNR Am J Neuroradiol
2000;21:1490 –96
12. Wolf RL, Zimmerman RA, Clancy R, et al.Quantitative apparent diffusion coefficient measurements in term neonates for early detection of hypoxic-ischemic brain injury: initial experience.Radiology2001;218:825–33 13. Rutherford M, Counsell S, Allsop J, et al.Diffusion-weighted magnetic
reso-nance imaging in term perinatal brain injury: a comparison with site of lesion and time from birth.Pediatrics2004;114:1004 –14
14. Neil JJ, Shiran SI, McKinstry RC, et al.Normal brain in human newborns: apparent diffusion coefficient and diffusion anisotropy measured by using diffusion tensor MR imaging.Radiology1998;209:57– 66
15. Lovblad KO, Schneider J, Ruoss K, et al.Isotropic apparent diffusion coeffi-cient mapping of postnatal cerebral development. Neuroradiology
2003;45:400 – 03
16. Tanner SF, Ramenghi LA, Ridgway JP, et al.Quantitative comparison of intra-brain diffusion in adults and preterm and term neonates and infants.AJR Am J Roentgenol2000;174:1643– 49
17. Toft PB, Leth H, Peitersen B, et al.The apparent diffusion coefficient of water
in gray and white matter of the infant brain.J Comput Assist Tomogr
1996;20:1006 –11
18. Barkovich AJ, Westmark KD, Bedi HS, et al.Proton spectroscopy and diffusion imaging on the first day of life after perinatal asphyxia: preliminary report.
AJNR Am J Neuroradiol2001;22:1786 –94
19. Hunt RW, Neil JJ, Coleman LT, et al.Apparent diffusion coefficient in the posterior limb of the internal capsule predicts outcome after perinatal as-phyxia.Pediatrics2004;114:999 –1003
20. Vermeulen RJ, Fetter WP, Hendrikx L, et al.Diffusion-weighted MRI in severe neonatal hypoxic ischaemia: the white cerebrum. Neuropediatrics
2003;34:72–76
21. Boichot C, Walker PM, Durand C, et al.Term neonate prognoses after perina-tal asphyxia: contributions of MR imaging, MR spectroscopy, relaxation times, and apparent diffusion coefficients.Radiology2006;239:839 – 48 22. Zarifi MK, Astrakas LG, Poussaint TY, et al.Prediction of adverse outcome
with cerebral lactate level and apparent diffusion coefficient in infants with perinatal asphyxia.Radiology2002;225:859 –70
23. L’Abee C, de Vries LS, van der Grond J, et al.Early diffusion-weighted MRI and 1H-magnetic resonance spectroscopy in asphyxiated full-term neonates.Biol Neonate2005;88:306 –12
24. Liauw L, van der Grond J, van den Berg-Huysmans AA, et al.Hypoxic-ischemic encephalopathy: diagnostic value of conventional MR imaging pulse se-quences in term-born neonates.Radiology2008;247:204 –12
25. Sarnat HB, Sarnat MS.Neonatal encephalopathy following fetal distress: a clinical and electroencephalographic study.Arch Neurol1976;33:696 –705 26. Gesell A, Amatruda CS.Developmental diagnosis: normal and abnormal child
development.In: Knobloch HPBH, ed.Developmental Diagnosis; the Evaluation and Management of Normal and Abnormal Neuropsychologic Development in Infancy and Early Childhood.3rd ed. New York: Harper and Row; 1974 27. Brouwers-de Jong EA, Burgmeijer RJF, Laurent de Angulo MS.
Ontwikkeling-sonderzoek op het consultatiebureau. Handboek bij het vernieuwde Van Wiechenonderzoek. [in Dutch] Assen, the Netherlands: Van Gorcum; 1996;1–343
28. Krageloh-Mann I, Helber A, Mader I, et al.Bilateral lesions of thalamus and basal ganglia: origin and outcome.Dev Med Child Neurol2002;44:477– 84 29. Mercuri E, Barnett AL.Neonatal brain MRI and motor outcome at school age
in children with neonatal encephalopathy: a review of personal experience.
Neural Plast2003;10:51–57
30. Rutherford M, Srinivasan L, Dyet L, et al.Magnetic resonance imaging in peri-natal brain injury: clinical presentation, lesions and outcome.Pediatr Radiol
2006;36:582–92
31. Barkovich AJ, Miller SP, Bartha A, et al.MR imaging, MR spectroscopy, and diffusion tensor imaging of sequential studies in neonates with encephalopa-thy.AJNR Am J Neuroradiol2006;27:533– 47