ISSN Online: 2153-120X ISSN Print: 2153-1196
DOI: 10.4236/jmp.2017.812121 Nov. 28, 2017 2013 Journal of Modern Physics
Explanation for the Mpemba Effect
Ilias J. Tyrovolas
Nafplio Regional Quality Control Centre Laboratory, Nafplio, Greece
Abstract
Water molecules are oriented dipoles joined by hydrogen bonds. When water is heated, this structure collapses (i.e., the entropy increases). When water is re-cooled to a lower temperature, the previous structure is not re-formed im-mediately. Sometimes, when the re-cooling is performed within a freezer, there is not enough time for the structure to re-form because of the high cooling rate. The entropy reduction curve as a function of the temperature, S = f(T), shows retardation (a lag) relative to the entropy growth curve. Water that has been heated and re-cooled to the initial temperature shows greater entropy than that before it was heated. This means that, while its molecules now have the same kinetic energy, their thermal motion after heating is less oriented with respect to the structure mentioned above. After re-cooling, random collisions are more likely, owing to this the temperature decreases more quickly.
Keywords
Entropy, Water, Specific Heat
1. Introduction
This case study proposes an explanation for the Mpemba effect, which is consi-dered as the phenomenon wherein, under uncertain conditions, hot water freez-es faster than cold water. The fact that the water has been warmed previously contributes to its rapid freezing. Hence many people, when they want to cool water quickly, begin by placing it in the sun. Named after Erasto Mpemba in 1963 [1], the Mpemba effect was reported by Aristotle, Bacon, and Descartes and has been discussed widely in both research as well as popular scientific journals [2]. Auerbach claims that it is different from the supercooling effect [2], but Brownridge argues that it is actually the same [3]. A latest study (2016) [4] total-ly disputes the phenomenon, although a more recent study [5] shows that the effect is present in granular fluids.
How to cite this paper: Tyrovolas, I.J. (2017) Explanation for the Mpemba Effect. Journal of Modern Physics, 8, 2013-2020. https://doi.org/10.4236/jmp.2017.812121
Received: October 24, 2017 Accepted: November 25, 2017 Published: November 28, 2017
Copyright © 2017 by author and Scientific Research Publishing Inc. This work is licensed under the Creative Commons Attribution International License (CC BY 4.0).
DOI: 10.4236/jmp.2017.812121 2014 Journal of Modern Physics
The explanations that have been suggested can be divided in two general cat-egories. The first one, which for ease can called “physicals”, includes theories like these: evaporation [6], frost [7], conduction [8], solutes [9], supercooling [10]. Second category, called for ease “chemicals”, includes theories involving hydro-gen bonds like these: crystallization [11] and hydrogen bonding [12]. But, the main query remains unanswered: Why does not the effect always occur?
In this study, this unique effect is defined as the phenomenon wherein, under certain conditions, hot water cools faster than cold water that is, it reaches faster a temperature point close to 0˚C: this perspective is adopted by Lasanta et al. [5], and described based on macroscopic parameters. Further, the underlying me-chanism responsible for the effect is proposed and the randomness of the phe-nomenon is explained.
Let us consider two jars, A and B, with each containing an identical quantity of water at the same temperature (T), such that the water in A has more entropy than that in B. This means that the water molecules of both jars have the same energy; however, those in jar A are moving randomly in all directions, whereas the thermal motion of those in jar B is restricted by the structure mentioned above. Therefore, in the case of the water sample in jar A, random collisions are more likely to occur than in the case of the sample in jar B, resulting in the water molecules losing more kinetic energy (E) on average. This results in a reduction in the temperature according to the relationship E = (3/2)bT, where b is the Boltzmann constant. Therefore, the water in jar A cools faster than that in jar B.
Convection is the dominant form of heat transfer in liquids. According to Newton’s law of cooling, during the cooling of a material body, the rate of tem-perature decrease (cooling rate = q) is proportional to the temperature (T):
0
d d eht
q= T t= −hT⇒ =T T − (1)
where t is the time, h is the heat transfer coefficient, and T0 is the initial temper-ature. The half-time period (HTP) is equal to ln2/h. The greater the value of h, the higher is the cooling rate, so q is more likely to cause Mpemba effect: this is my aspect discussed below in Discussion Section. Heat transfer coefficient is de-pendent upon the physical properties of the water and the physical situation. However, h is affected by many factors such as the container’s shape and materi-al and the air circulation within the freezer, among others. For example, Equa-tion (2) applies to a PET bottle assuming a planar geometry [13]:
(
)
11 2
1 1
h= h +δ k+ h − (2)
h: overall heat transfer coefficient;
h1: heat transfer coefficient inside the bottle;
h2: heat transfer coefficient outside the bottle;
δ: PET layer thickness;
k: PET thermal conductivity.
DOI: 10.4236/jmp.2017.812121 2015 Journal of Modern Physics
2. Method
An experiment was performed to elucidate the effect of preheating on the cool-ing duration, wherein three bottles, A, B, and C, each containcool-ing the same quan-tity of water, were placed in a freezer with an internal temperature of −18˚C. The temperature of the water in bottle A was 50˚C while that of the water samples in B and C was 25˚C. The water in bottle C was first heated to 50˚C and then cooled to 25˚C. After 1.5 h, it was observed that the temperature of the water samples in bottles A and C reached 2˚C sooner than that for the water in B. It is likely that samples A and C followed the same cooling process; that is to say, the coefficient h was the same for both A and C, while it was larger for B. The HTP for both A and C was the same and lower than that of B. This experiment was conducted at the laboratory of the Nafplio Regional Quality Control Centre, which had met the requirements of the standard ISO/IEC 17,025: 2005 since 2009 (accreditation body: ESYD S.A., certificate number: 609).
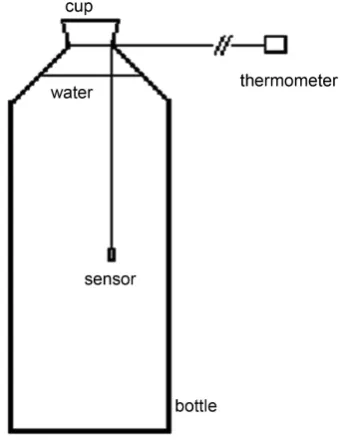
Commercial PET bottles with a volume of 500 mL were filled with 500.00 g of distilled water produced by a distiller (Bibby Sterilin, model: A 4000D, conduc-tivity of water: 1 - 2 μS/cm). The ambient temperature within the laboratory was adjusted to 25˚C. The water in bottle C was heated to 50˚C in a Pyrex glass using a hot plate and then left to cool to 25˚C. The water in bottle A was heated to 50˚C. The water was poured immediately into the bottles, which were at the am-bient temperature. The sensors (pins) of the digital alert thermometers used for the temperature measurements were inserted from the top to the middle of the bottles. With no relaxation time, the bottles were capped then immediately placed in a freezer and cooled to 2˚C (Figure 1).
[image:3.595.286.457.488.710.2]Digital alert timers were used to measure the duration time. Measurements were carried out under the plan one bottle per day. Initial conditions are kept
DOI: 10.4236/jmp.2017.812121 2016 Journal of Modern Physics
[image:4.595.208.539.328.397.2]the same in the different repeated runs. The experimental results are shown in Table 1.
Number of samples = 10 per type (total 30).
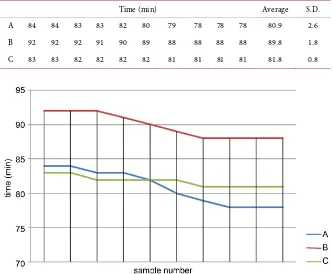
The experimental results are presented in more detail in Table 2 arranged in descending order.
Data are illustrated in Figure 2.
The average values were compared using the F test. First, the average value of the B samples (Bav) was compared with those of samples A and C ((Aav + Cav)/2), in order to check whether preheating affected the duration of cooling. Next, Aav and Cav were compared to determine whether they were equal within the limits of experimental uncertainty. In the first case, the F value, F1, was cal-culated to be 136.8. Further, the F tables with a significance level of 0.1% gave F = 13.6 F1, showing that the preheating of the water strongly affected the cooling duration. In the second case, F2 was calculated to be 1.16, which is sig-nificantly less than 13.6 (F1). This meant that Aav = Cav.
Table 1. Average weight and cooling duration.
Sample Average weight (g) Cooling duration (min) Standard error (min)
C 500.006 82 1
B 500.001 90 2
[image:4.595.207.540.429.703.2]A 500.003 81 3
Table 2. Cooling duration.
Time (min) Average S.D. Α 84 84 83 83 82 80 79 78 78 78 80.9 2.6 Β 92 92 92 91 90 89 88 88 88 88 89.8 1.8 C 83 83 82 82 82 82 81 81 81 81 81.8 0.8
DOI: 10.4236/jmp.2017.812121 2017 Journal of Modern Physics
3. Discussion
DOI: 10.4236/jmp.2017.812121 2018 Journal of Modern Physics
of the water molecules leads to increased entropy (S). The increase in the entro-py (dS) when water is heated from a lower temperature T1 to a higher tempera-ture T2 can be calculated as follows:
(
2 1)
ln
dS=mc T T (3)
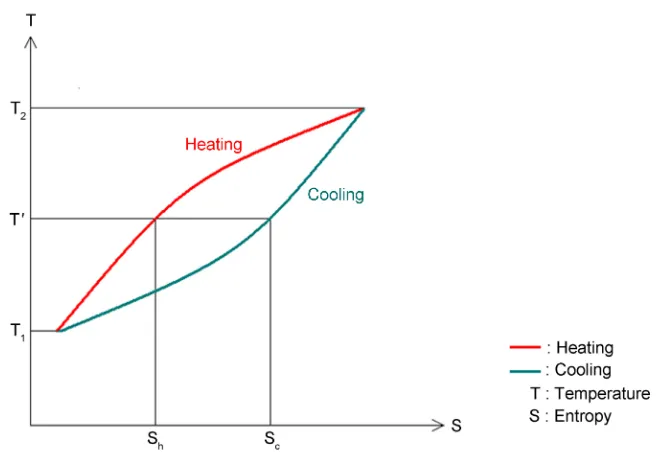
[image:6.595.209.541.480.708.2]where m is the mass of water and c is the specific heat. However, the structure does not extensively re-form immediately upon cooling, as the reconstruction process requires time. My aspect is that if the cooling process is very fast and performed using a freezer, the water molecules do not get sufficient time to re-structure. In contrast, when water remains for a long time in a fridge, wherein a stable temperature of 5˚C is maintained, the water molecules have sufficient time to reorder. When the water is cooled to an initial low temperature, the structure does not form instantaneously, that is, its entropy does not decrease immediately. During the cooling process, the water structure does not instanta-neously return to the ordered state, as hydrogen bonds do not form instantly. This thermodynamic process or cycle can be visualized in a “temperature vs. en-tropy diagram” or T-S diagram [16]. In our case (Figure 3) the area enclosed by the circle is the energy consumed to deconstruct the “structure”. The curve for entropy reduction as a function of the temperature, S = f(T), lags relative to the entropy growth curve. As we see in Figure 3, at any temperature T', the entropy during heating, Sh, is less than the entropy during cooling, Sc. After being heated and then cooled to the starting temperature, the water now has greater entropy and fewer hydrogen bonds than it did immediately prior to being heated, even though the temperature is now the same. At any temperature T, the heat capaci-ty mc (=S/lnT) upon cooling is greater than that during heating. Thus, the spe-cific heat is larger in the former case: cc > ch. Specific heat of water is not con-stant but it is a function of temperature [17] and it is in average 1 cal/gr ˚C =
DOI: 10.4236/jmp.2017.812121 2019 Journal of Modern Physics
4.18 J/gr ˚C in the range 25˚C - 60˚C:
3 5 2 7 3 9 4
4.214 2.286 10 4.991 10 4.519 10 1.857 10
c= − × −T+ × − T − × −T + × − T (4)
(T in Celcius, unit is J/gr ˚C).
Formula (4) is not an equation derived from physical laws but is just a poly-nomial best fitted to experimental measurements. Provided that it is produced by a FORTRAN code can be called “empirical”. Therefore it is possible that the specific heat is furthermore affected from other unknown variables. Conse-quently the supposition: cc > ch has a large possibility to be correct.
4. Conclusion
Warm water is cooling faster than cold because it contains more entropy when it comes to its temperature. The grid structure is more extended in cold water. Any dissolved salts present in the water affect the structure of the water molecules, as the ions are hydrated. Consequently, in the case of water containing dissolved ions, the water network is smaller, and the molecules are less organized than in pure water. Thereby, the effect of preheating is expected to be weaker.
Acknowledgements
I would like to thank Editage (https://www.editage.com/) for English language editing.
References
[1] Mpemba, E. and Osborne, D. (1979) Physics Education, 14, 410.
https://doi.org/10.1088/0031-9120/14/7/312
[2] Auerbach, D. (1995)American Journal of Physics, 63, 882.
https://doi.org/10.1119/1.18059
[3] Brownridge, J. (2010) Physics Education. https://arxiv.org/abs/1003.3185 [4] Burridge, H.C. and Linden P.F. (2016) Scientific Reports, 6, Article ID: 37665.
https://doi.org/10.1038/srep37665
[5] Lasanta, A., Vega Reyes, F., Prados, A. and Santos, A. (2017) Physical Review Let-ters, 119, Article ID: 148001.https://doi.org/10.1103/PhysRevLett.119.148001
[6] Kell, G.S. (1969) American Journal of Physics, 37, 564-565.
https://doi.org/10.1119/1.1975687
[7] Monwhea, J. (2006) American Journal of Physics, 74, 514.
https://doi.org/10.1119/1.2186331
[8] Kowalewski, T. (2004) International Centre for Mechanical Sciences (Courses and Lectures), 449, 171-218.
[9] Katz J.I. (2009) American Journal of Physics, 77, 27-29.
https://doi.org/10.1119/1.2996187
[10] Vynnycky, M. and Kimura, S. (2015) International Journal of Heat and Mass trans-fer, 80, 243-255. https://doi.org/10.1016/j.ijheatmasstransfer.2014.09.015
[11] Jin, J. and Goddard, W.A. (2015) The Journal of Physical Chemistry C, 119, 2622-2629. https://doi.org/10.1021/jp511752n
DOI: 10.4236/jmp.2017.812121 2020 Journal of Modern Physics
and Computation, 13, 55. https://doi.org/10.1021/acs.jctc.6b00735
[13] Liga, A., Montesanto, S., Mannella, G., La Carrubba, V., Brucato, V. and Cammalle-ri, Mo. (2016) Heat and Mass Transfer, 52, 1479-1488.
https://doi.org/10.1007/s00231-015-1652-x
[14] Ignatov, I. and Mosin, O.V. (2014) Nanotechnology Research and Practice, 3, 141-158. https://doi.org/10.13187/ejnr.2014.3.141
[15] Chaplin, M. (2017) Water Structure and Science. http://www1.lsbu.ac.uk/water [16] Engineers Edge (2010) Temperature Entropy Diagram—Thermodynamics.
Engi-neers Edge.
http://www.engineersedge.com/thermodynamics/temp_enthalpy_th_diagram.htm
[17] Pramuditya, S. (2011) Water Thermodynamic Properties. ITB Physics Department —Technical Document
https://syeilendrapramuditya.wordpress.com/2011/08/20/water-thermodynamic-pr