Koushi Harada
1Norihiko Fujita
Kousuke Sakurai
Yoshinori Akai
Keiko Fujii
Takahiro Kozuka
Received October 30, 1990; revision requested January 28, 1991; revision received April 24, 1991; accepted May 3, 1991.
This work was supported by a grant-in-aid from the Ministry of Education, Japan.
'All authors: Department of Radiology, Osaka University Medical School, 1-1-50, Fukushima, Fu-kushima-ku, Osaka 553, Japan. Address reprint requests to K. Harada.
0195-6108/91/1206-1143
© American Society of Neuroradiology
Diffusion Imaging of the Human
Brain:
A New Pulse Sequence
Application
for a 1.5-T Standard MR System
We developed a new pulse sequence and investigated whether the anisotropic diffusion in the human brain can be detailed with a standard whole-body MR imager. Apparent diffusion coefficient maps were produced by the proposed sequence using a 1.5-T MR unit. The sequence employed simultaneous application of three orthogonal gradients to achieve an optimal signal attenuation for imaging the brain without any increase in echo time. The orientation of the effective diffusion-encoding gradient was off-axis. On the in vivo apparent diffusion coefficient maps of four healthy volunteers, white matter tracts (the internal capsule and the corpus callosum) and the cortical and deep white matter showed anisotropic diffusion. In the gray matter, such as basal ganglia and thalami, anisotropic diffusion was not observed.
A typical whole-body imager can provide in vivo human brain diffusion images of clinical quality. This technique has promising implications for the evaluation of brain development and the diagnosis of degenerative diseases.
AJNR 12:1143-1148, November/December 1991
MR diffusion
imaging
has been attracting increased interest in
recent
years
[1-6]. One of the
promising capabilities of this imaging
method is
in vivo visualization
of the
orientation
of white matter fibers through anisotropic diffusion. Moseley et
al. [4] obtained clear images of anisotropic diffusion
in cats' brains and spinal cords
using an experimental MR system. The presence of anisotropic diffusion was also
demonstrated in the human brain by Chien et al. [5] using a whole-body clinical
imaging unit. In general, however, the quality of in vivo human diffusion images has
been less than optimal.
In this study, we developed a pulse sequence that employed simultaneous
application of three orthogonal gradients and
investigated whether the anisotropic
diffusion in the human brain can be detailed with a typical whole-body MR system.
Materials and Methods
Pulse Sequence Description
Two spin-echo sequences were acquired: diffusion-sensitive and nonsensitive. The appar-ent diffusion coefficiappar-ent (ADC) was calculated for each pixel on the basis of the signal
intensities in order to generate an ADC map. The b value (the value of the gradient attenuation
factor) (6) of the diffusion-nonsensitive sequence was calculated to be 3 sec{mm2 . It was much smaller than that of the diffusion-sensitive sequence. Hence, this value could be
ignored, and the ADC for each pixel was calculated according to
ADC(x,y)
=
ln[SaH(x,y)/Son(X,y))/ban.where Saff and San are signal intensities of the diffusion-nonsensitive and sensitive sequences, respectively, and ban is the b value of the diffusion-sensitive sequence [6, 7).
1144
HARADA ET AL. AJNR:12, November/December 19910
D
0
D
Fig. 1. -Diffusion-sensitive sequence. In all three axes, additional gra-dients are placed before and after the 180° pulse; all have the same duration and amplitude.
we developed a diffusion-sensitive sequence that simultaneously employs three orthogonal gradients. Gradients were placed in all three axes before and after the 180° pulse. They had the same duration and amplitude (Fig. 1 ). The effective diffusion-encoding gradient is the vectorial addition of the three gradients (Fig. 2). The strength is the square root of three times that of one gradient. Hence, the pulse sequence is three times more efficient in diffusion effects,
since the latter are proportional to the square of the gradient strength.
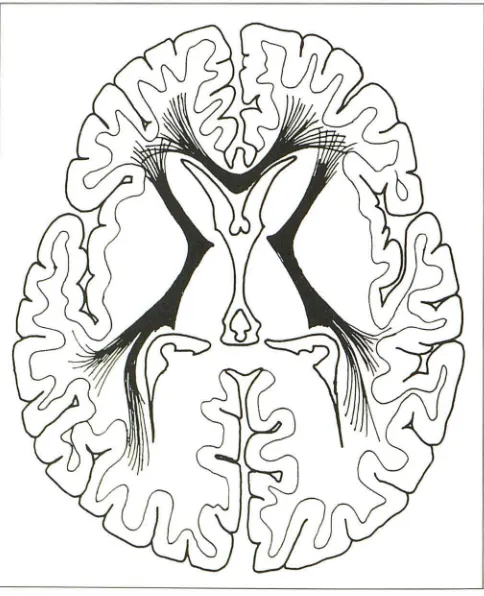
The orientation of the effective gradient is oblique to all three of the orthogonal planes (Fig. 2): that is, from the left anterior caudad to the right posterior cephalad of examinees. On the other hand, the
structure of the human brain is virtually symmetric against the sagittal plane. Therefore, if anisotropic diffusion is present in a pair of left and right white matter pathways that run obliquely against a sagittal plane, such as corticospinal tracts running through internal capsules and forceps minor, the pathways are expected to appear assymetric with different areas of brightness on an ADC image acquired by our method. Those white matter pathways that are not parallel to the orientation of the effective diffusion-encoding gradient will appear different from fiber tracts that are parallel.
Although the maximum gradient strength achievable with our sys
-tem is 10 mT jm, the amplitude of the additional gradients was set to
8 mTjm because the use of a stronger amplitude increased the
dynamic instrumental instabilities (gradient oscillations and vibration of gantry, couch, etc.).
The diffusion-sensitive sequence was optimized for a two-point fit
calculation of the ADC of the human brain so as to minimize the measurement error. The optimization was achieved by controlling the duration of the diffusion-encoding gradient (8]. As a result, the
duration was determined to be 30 msec. The b value for the diffus ion-sensitive sequence was calculated to be 600 secjmm2 (bs
= 213, b1
=
195, bp=
192 if phase encoding had not been performed) (7].Phantom Studies
The accuracy of the diffusion measurements was tested with a
water phantom at room temperature (23°C). ADC images, 500/120/
1 (TR/TEjexcitation), were obtained. The other imaging parameters
used in the experiments were as follows: slice thickness = 10 mm, field of view = 23 em, acquisition matrix = 128 x 256, and single slice acquisition.
To test the utility of our imaging method in the assessment of anisotropic diffusion, two axial ADC images (500/120/1) of a fresh
y
:.·
..
-- . ---···.f
..
-.---~------·.jp.::;;;.--~ ... ---·---
-X
·.
-
:
_
-
.--.--
-
---
-
-
--
-
-
----
-
-
-~:~ z [image:2.612.316.557.73.325.2]Fig. 2.-Effective diffusion-encoding gradient. The effective gradient is the vectorial addition of the three gradients. Largesf arrow is the effective gradient; smaller arrows are actually applied gradients in frequency, phase-encoding, and slice-selective axes.
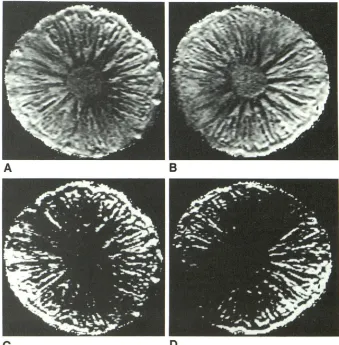
[image:2.612.55.308.77.232.2] [image:2.612.315.557.388.686.2]pineapple were obtained with and without changing the orientation of the effective diffusion-encoding gradient (normal-direction and re-versed-direction gradient images) [4, 5, 9]. The change of the orien-tation was achieved by the reversal of the gradient's polarity in the frequency axis (left-right direction on the ADG images). The imaging parameters were the same as those used in the water phantom study.
Normal Patient Studies
Human brain studies were performed in four healthy volunteers ages 28-39 years old. A transverse plane through the basal ganglia and thalamus was imaged in each subject. The reasons for selecting this plane were as follows: (1) the plane includes deep gray matter as well as deep white matter; (2) there is an internal capsule in which projection fibers run obliquely through the plane; and (3) it includes the genu of the corpus callosum and the forceps minor, whose fibers run obliquely within the plane (Fig. 3). The imaging parameters were the same as those used in the water phantom study except for TR and excitations. In the human studies, EGG-gated ADG images (3R-R/120/2) were obtained. The effective TRs were about 3000 msec. Averaging was performed by adding separately calculated images,
because averaging of sequentially recorded image data is superior to direct averaging of data from individual phase-encoding steps [1
OJ.
The regional ADGs were measured by region-of-interest (ROI) operation on the normal-direction gradient images. The areas of the ROI were 0.5 cm2 for the caudate head, putamen, thalamus, and
Fig. 4.-Apparent diffusion coefficient (ADC)
images (500/120) of a pineapple. There is
marked direction dependency of the images. On
the normal-direction gradient image, faster ADC
area (brighter on the image) runs from upper left
to lower right region of the pineapple.
Con-versely, it moves from the upper right to the
lower left region of the pineapple on the
re-versed-direction gradient ADC image. A, Normal-direction gradient ADC image. 8, Reversed-direction gradient ADC image.
C and D, Display window is narrowed down
from images A and 8, respectively.
A
c
frontal white matter; and 0.2 cm2 for the corpus callosum and internal
capsule. On measuring the ADG of the right posterior limb of the internal capsule, the ROI was placed over the brightest area.
To confirm direction dependence of diffusion-that is, anisotropic diffusion of the human brain-we changed the orientation of the effective diffusion-encoding gradient in the same way as described above. The resulting orientation was from the right anterior caudad to the left posterior cephalad of examinees. In two of the volunteers,
an additional EGG-gated ADG image (3R-Rf120/2) of the same transverse plane was produced by the proposed method with the reversed-direction gradient. The ADG images were compared with corresponding normal-direction gradient images.
All studies were acquired on a 1.5-T whole-body MR unit (Siemens,
Erlangen, Germany) without special hardware modifications. The gradient system was not a shielded-gradient type.
Results
The diffusion coefficient of water measured by the
pro-posed sequence with normal- and reversed-direction
gra-dients in the frequency axis was 2.28
±
0
.
03 and 2
.
27
±
0
.
02
x
10
-
3mm
2jsec, respectively, showing close agreement with
each other. These diffusion coefficients are compatible with
previously reported values [5-7].
On the normal-direction gradient ADC image (500/120) of
the pineapple, which consists of a central fibrous core and
B
[image:3.612.221.560.392.737.2]1146
HARADA ET AL.
AJNR:12, November/December 1991TABLE 1: Apparent Diffusion Coefficients on the Normal-Direction Gradient Images
Volunteer
Region Average
A B
c
DPutamen
L 44 72 93 61 68
R 83 56 74 83 74
Caudate
L 63 82 84 66 74
R 62 54 70 69 64
Thalamus
L 31 71 68 70 60
R 63 84 91 75 78
Posterior limb of internal capsule
L 30 70 65 56 55
R 119 120 129 103 118
Genu of corpus callosum
L 131 90 150 141 128
R 48 36 58 46 47
Frontal white matter
L 101 87 111 129 107
R 63 64 82 57 67
Note.-L =lett, R =right. All coefficients calculated by the equation {x10-s mm2fsec).
radiating juicy fibrous columns around it, an asymmetric dif
-fusion pattern against the midline was observed. Part
of
the
fruit, where the fibrous columns run more
closely
parallel to
the effective diffusion-encoding gradient, showed faster
dif-fusion (brighter on the image) (Figs
.
4A and 4C). On the
reversed-direction gradient image, the diffusion pattern was
reversed against the midline (Figs
.
48 and 40). These facts
demonstrate that our imaging method can reflect the direction
dependency
of
diffusion on image contrast
and
illustrate the
presence of anisotropic diffusion
.
All ADC 3R-R/120 images
of
the volunteers were slightly
degraded by phase-shift artifacts. The regional ADCs
meas-ured on the normal-direction gradient are summarized in Table
1
.
On all of the normal-direction gradient ADC 3R-R/120
im-ages of the volunteers, some white matter pathways showed
conspicuously faster diffusion (brighter on the images) than
the corresponding contralateral regions
.
These areas included
the right posterior limb of the internal capsule, the right side
of the splenium
,
and the
left
side of the genu of the corpus
callosum (Table 1 and Fig
.
5)
.
The appearance of the cerebral
white matter was asymmetric (Figs
.
5
and 6A)
.
It was
partic-ularly prominent in the frontal region
.
The ADCs of the bilateral
frontal white matter were significantly different (Table 1 )
.
The
gray matter
,
such as basal ganglia and thalami
,
did not show
any significant difference between the cerebral hemispheres
(Table 1 and Figs
.
5 and 6A)
.
The asymmetric diffusion pattern
was thought to be due to anisotropic diffusion
.
On the reversed-direction gradient ADC 3R-Rf120 image
of the two volunteers
,
the contrast characteristics of the left
and right cerebral hemispheres were interchanged as
com-pared with the corresponding normal-direction gradient
im-ages (Figs
.
6A and 68)
.
This result confirmed that the
asym-metric diffusion pattern was caused by diffusional anisotropy
.
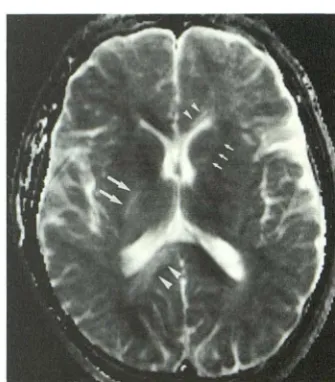
Fig. 5.-Normal-direction gradient apparent diffusion coefficient image
{3R-R/120) of a healthy volunteer. The following regions reveal faster
diffusion (brighter on the image) than the contralateral correspondents:
the right posterior limb of the internal capsule (large arrows), the left
anterior limb (small arrows), the right side of the splenium of the corpus
callosum (large arrowheads), and the left side of the genu (small arrow·
heads). Difference in diffusion pattern is observable between the left and right frontal region.
Discussion
Although efforts have been made to improve
diffusion
imaging [7
,
11-13] (Chenervert TL. Paper
presented at the
annual meeting
of
the
Society of Magnetic Resonance
in
Medicine, Amsterdam, August 1989)
,
in
vivo
measurements
are highly susceptible to motion artifacts
.
These
artifacts
are
caused by patient motion
,
CSF
pulsation
,
brain
tissue
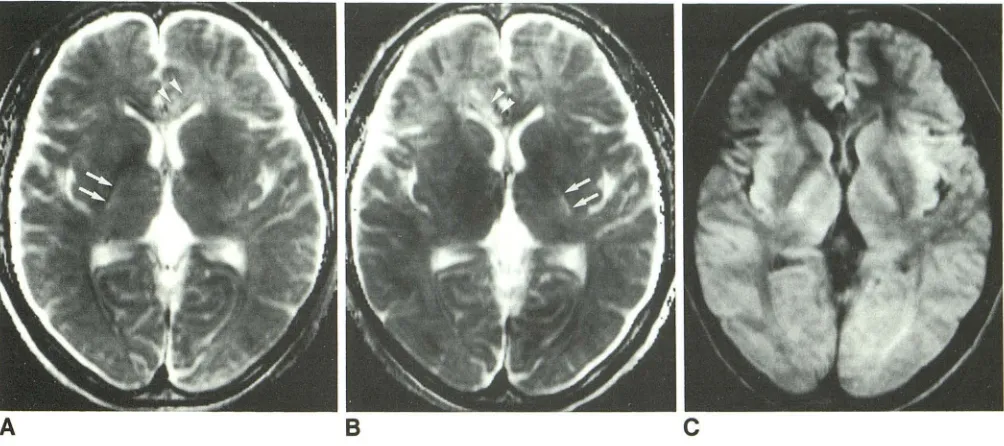
[image:4.615.130.496.90.273.2] [image:4.615.352.520.337.528.2]A
B
c
Fig. 6.-Apparent diffusion coefficient (ADC) maps and the diffusion-weighted image of a healthy volunteer.
A, Normal-direction gradient ADC image (3R-R/120). Right posterior limb of internal capsule (arrows) and left side of the genu of the corpus callosum
(arrowheads) show faster diffusion (brighter on the image) than corresponding contralateral regions. The diffusion pattern was asymmetric in the frontal white matter. The gray matter, such as the basal ganglia and thalami, does not show any significant difference between the cerebral hemispheres.
8, Reversed-direction gradient ADC image (3R-Rf120). Roughly, this is a mirror image of the normal-direction gradient image. Left posterior limb of
internal capsule (arrows) and right side of the genu of the corpus callosum (arrowheads) reveal faster diffusion. There is no significant directional dependence in the gray matter.
of strong magnetic
gradients. A relatively large
,
effective b
value
,
used in
the present study
,
suppresses phase-shift
artifacts originating from CSF pulsation
,
because signal
inten-sity of CSF considerably decreases owing to its high diffusion
coefficient (Fig
.
6C)
.
The
use of a large b value also improves
tissue
contrast
[9].
A combination of single-slice acquisition
and long TR
was useful for reducing the effects of the dynamic
instrumental instabilities.
Potentially, the
ADC
measured
by our method reflects
processes
other than diffusion in living subjects
,
such as
perfusion and
physiological
pulsation
.
The
use of a large b
value decreases
the effects of perfusion on the ADC image.
On
the basis of the theory described by
Le
Bihan et al. [14
,
15], the
effects of perfusion
on
our diffusion measuremen
t
s
is estimated
to be
less than 8
%.
The effects of perfusion o
r
physiological pulsation have
been ruled out as the major
cause
of anisotropic diffusion in
the white matte
r
because of
the similarity
of
premortem
and immediate postmort
e
m im
-ages
[4]
.
Using a sequence that simultaneou
s
ly employed thr
ee
or-thogonal
gradients
to sensitize diffusion
,
w
e
d
e
tail
e
d t
he
diffusion pattern of the
human
brain. In the volunt
ee
r
s
tudy
,
we demonstrated the anisotropic diffusion in the majo
r
whi
te
matter
pathways and
in
the
cortical
and deep
w
hite matt
e
r.
In
the gray
matter
,
such as the basal ganglia and thalam
i,
anisotropic diffusion was not observed
.
These findings ar
e i
n
agreement with the results of earlier studies
[
4, 5, 9
, 12
,
13]
(Nomura Y
.
Paper presented at the annua
l
m
e
eti
ng o
f
t
h
e
Society of Magnetic Resonan
c
e in Med
ic
in
e,
New York
,
Au-gust 1990)
.
In conclusion
,
a typical whole-body
imager can provide an
in vivo human brain diffusion image of clinical quality. Although
much wor
k
remains to be done before we have a good
understanding of anisotropi
c
diffusion in the human brain
, w
e
thin
k
that the application of this technique is p
ro
mi
s
ing in the
evaluation of brain developm
e
nt
a
nd th
e
di
ag
n
os
i
s o
f d
ege
n
-er
a
tive disease
s.
ACKNOWLEDGMENT
We are grateful to Mr. K. Mishio of Saitama Cancer Center for his
help in transferring image data.
REFERENCES
1. Wesbey GE, Moseley ME, Ehman RL. Translational molecular self-diffusion in magnetic resonance imaging. 2. Measurement of the self-diffusion coefficient. Invest Radio/1984; 19:491-498
2. Thomsen C, Henricksen 0. Ring P. In vivo measurement of water self diffusion in the human brain by magnetic resonance imaging. Acta Radio!
1987;28:353-361
3. Tsuruda JS, Chew WM, Moseley ME, Norman D. Diffusion-weighted MR imaging of the brain: value of differentiating between extraaxial cysts and epidermoid tumors. AJNR 1990; 11 :925-931
4. Moseley ME, Cohen Y. Mintrovitch J, et al. Diffusion-weighted MR imaging
of anisotropic water diffusion in cat central nervous system. Radiology
1990; 176:439-445
[image:5.612.55.557.84.307.2]1148
HARADA ET AL.
AJNR:12, November/December 1991imaging of the human brain. J Comput Assist Tomogr 1990; 14:514-520 6. Le Bihan D, Breton E, Lallemand D, Greiner P, Cabanis E, Lavai-Jeantet
M. MR imaging of intravoxel incoherent motions: application to diffusion and perfusion in neurologic disorders. Radiology 1986; 161:401-407 7. Ahn CB, Lee SY, Nalcioglu 0, Cho ZH. An improved nuclear magnetic
resonance diffusion coefficient imaging method using an optimized pulse sequence. Med Phys 1986; 13:789-793
8. Hrovat Ml, Wade CG. NMR pulsed gradient diffusion measurements. 2. Residual gradients and lineshape distortions. J Magn Reson 1981; 45: 67-80
9. Moseley ME, Cohen Y, Mintrovitch J, et al. Early detection of regional
cerebral ischemia in cats: comparison of diffusion-and T2-weighted MRI and spectroscopy. Magn Reson Med 1990; 14:330-346
10. Merboldt KD, Bruhn H, Frahm J, Gyngell ML, Haenicke W, Deimling M. MRI of "diffusion" in the human brain. New results using a modified CE
-FAST sequence. Magn Reson Med 1989; 9:423-429
11. Moseley ME, Kucharczyk J, Mintrovitch J, et al. Diffusion-weighted MR imaging of acute stroke: correlation with T2-weighted and magnetic sus-ceptibility enhanced MR imaging in cats. AJNR 1990; 11:423-429 12. Doran M, Hajnal JV, Van Bruggen N, King MD, Young IR, Bydder GM.
Normal and abnormal white matter tracts shown by MR imaging using directional diffusion weighted sequences. J Comput Assist Tomogr 1990; 14:865-873
13. Hajnal JV, Doran M, Hall AS, et al. MR imaging of anisotropically restricted diffusion of water in the nervous system: technical, anatomic, and patho-logic considerations. J Comput Assist Tomogr 1991; 15:1-18
14. Le Bihan D, Breton E, Lallemand D, Aubin ML, Vignaud J, Lavai-Jeantet M. Separation of diffusion and perfusion in intravoxel incoherent motion MR imaging. Radiology 1988; 168:497-505