Fat Suppression in Combination with Multiple
Overlapping Thin-Slab
3-D Acquisition MR Angiography: Proposed Technique for
Improved
Vessel Visualization
Ronald 0. Robison, 1·2·6 Duane D. Blatter, 1'7 Dennis L. Parker,2 Ping Hou,3 JohnS. Collins,4 and William Wesley Barnel
PURPOSE: To study the parameters of the 1331 fat saturation pulse (saturation pulse flip angle (SPFA) and interpulse delay (T)) in order to identify values that provide optimal vessel visibility. METHODS: Carotid bifurcations of three healthy subjects were studied. RESULTS: The optimal values for the SPFA and T were 60° (7.5°, -22.5°, 22.5°, -7.5°) and 2.0-3.0 msec, respectively. At these values there was a 1.56-fold increase (SD = ±.12, P< .01) in the contrast-to-noise ratio between the left internal carotid artery and fat compared to the study without fat saturation. A 3.0-fold increase was noted for the smaller left occipital artery. Additionally, there was no statistically significant reduction in the vessel-muscle contrast-to-noise ratio nor in the absolute vessel signal-to-noise ratio at these values. CONCLUSION: Implementation of fat saturation into carotid MR angiography markedly improves visualization of vascular anatomy without increasing imaging time.
Index terms: Magnetic resonance, technique; Magnetic resonance, fat suppression; Magnetic resonance angiography (MRA); Arteries, carotid
AJNR 13:1429-1434, Sep/Oct 1992
Time-of-flight (TOF) magnetic resonance an-giographic (MRA) techniques (1, 2) are highly T1-weighted and produce a relatively bright signal for fat due to the short T1 of fat and the resulting incomplete saturation of the fat signal. Depending on the parameters of the sequence used, the abundant fat frequently present in the neck sur-rounding the carotid sheath can have a greater
Received May 6, 1991; accepted contingent on revision July 17; revision received November 19.
This work was supported by a grant from the Deseret Foundation of the LOS Hospital.
1
Department of Radiology, LOS Hospital, Salt Lake City, Utah. 2
Department of Medical informatics, LOS Hospital/University of Utah, Salt Lake City, Utah.
3
Department of Physics, University of Utah, Salt Lake City, Utah. 4 Medical Student, Tulane School of Medicine, New Orleans, Louisiana. 5
Medical Student, University of Utah School of Medicine, Salt Lake City, UT.
6
Present address: Mallinckrodt Medical, Inc., 675 McDonnell Blvd., P.O. Box 5840, St. Louis, MO 63134.
7
Address reprint requests to Duane D. Blatter, MD, LOS Hospital, Department of Radiology, 8th Avenue and C Street, Salt Lake City, Utah 84143.
AJNR 13:1429-1434, Sep/Oct 1992 0195-6108/92/1305-1429 © American Society of Neuroradiology
signal intensity than flowing blood. This is partic-ularly true for small vessels and in patients that have reduced flow secondary to stenosis. Thus, in maximum intensity projection (MlP) (3) images of TOF MR angiograms, vessel visibility may be limited primarily by the signal intensity of the background fat.
A number of methods to reduce signal intensity from fat in magnetic resonance (MR) imaging have been developed including, spectroscopic (4, 5) and gaussian presaturation (6) techniques. Hore (7) initially described the 1331 fat saturation pulse and several hybrid techniques have been subse-quently developed by Szumowski (8). Preliminary results of attempts at combining fat saturation techniques with MRA have been reported (9).
We have recently described a novel hybrid TOF MRA technique that utilizes multiple overlapping thin-slab 3-D acquisition (MOTSA) (10, 11). MOTSA combines the noise reduction of 3-D acquisition with the improved vessel signal of multiple thin-section (2-D TOF) techniques. We have implemented a 1331 fat saturation pulse into the MOTSA sequence to enhance the visi-bility of smaller vessels and improve the robust-ness of the technique in slow flow states. The
1430 ROBISON AJNR: 13, September /October 1992
e
=
+ 11.25 delay by 'te
= -33.75delay by 't
e
e
= + 33.75 delay by 'te
= -
11.25e
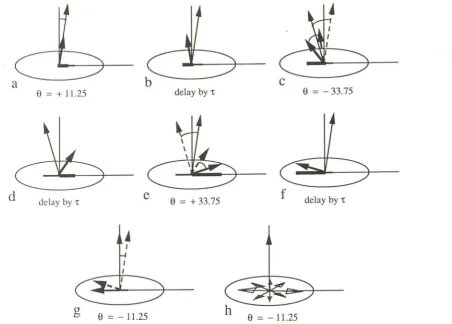
= - 11.25Fig. 1. Illustration of the fat saturation 1331 pulse. a, At time t = 0, a short RF pulse is used to tip both water (long vector) and fat
(short vector) an angle (+a) away from the z-axis. b, Because fat processes at a slightly lower frequency than water, after a short
interval (T) the transvers component of the fat vector is 180° out of phase with the water vector. c, A short RF pulse rotates the magnetization vectors by the angle, - 3a. d, After a 2nd interval, T, the water and fat magnetizations are again 180° out of phase. e, A
third pulse of angle +3a rotates the vectors back, with fat now close to the transverse plane and water close to the z-axis. f, Finally, after a 3rd interval, T, the water, and fat magnetizations are again 180° out of phase. g, A fourth pulse of - a rotates the water vector
back to the z-axis and the fat component into the transverse plane. h, A spoiler gradient is then used to spread the fat magnetization throughout the transverse plane.
purpose of this study was to evaluate the
effec-tiveness and determine the optimal parameters
for a 1331 fat saturation in MOTSA MRA. We
report a significant improvement in vessel
visibil-ity (contrast-to-noise ratio (CNR)) and describe
the optimal values of the radio frequency (RF)
saturation pulse flip angle (SPF A) and interpulse
delay (7) of the 1331 fat saturation pulse.
Methods
Subjects
Multiple cervical carotid artery MRA were performed on three healthy volunteers. All three subjects were young
adult men with an average age of 29.
J'l1RA
Imaging was performed at 1.5 T using an unmodified
GE Signa MR scanner (GE Medical Systems, Milwaukee,
WI) with a quadrature head coil and standard patient positioning. MRA images were obtained using the MOTSA TOF technique that has been described in detail by Parker
et al ( 10, 12). Briefly, the technique consists of 3-D acqui
-sition of multiple overlapping thin slabs within which an
arbitrary number of sections may be present. To this technique we added a standard 1331 fat saturation pulse
described by Hore (7). The fat saturation pulse consists of four RF pulses separated in time such that at each pulse
the relative phase of the fat magnetization is shifted by an additional 180° with respect to that of water (see Fig. 1 ). The waveform timing diagram is shown in Figure 2. The SPFA and interpulse delay (T) of these four pulses were varied to identify the values of optimal fat saturation. The SPFA ranged from 0° to 200° (expressed as the sum of the flip angles of the four RF pulses) and T extended from
1.5 to 3.5 msec.
The three subjects were imaged in the axial plane just
above the carotid bifurcation using the SPF A and T values
described above and the following imaging parameters: 55/
[image:2.614.103.556.78.402.2]AJNR: 13, September/October 1992
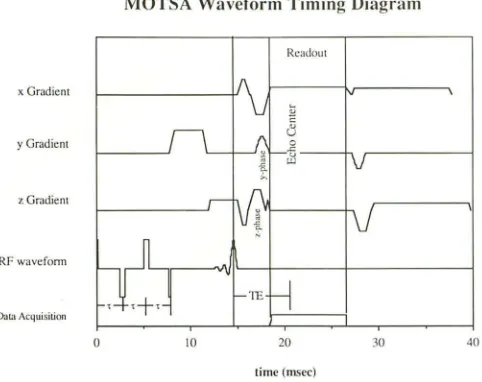
MOTSA Waveform Timing Diagram
Readout
x Gradient
y GrJdicnt
z Gradient
RF wavcfonn
Dat:.1/\cquisition
0 10 20 30 40
time (mscc)
Fig. 2. Diagram of the MOTSA pulse sequence with
imple-mentation of the 1331 fat saturation pulse. Note that each of the
four pulses in the RF waveform are separated by the interpulse
delay (r). The vertical lines serve as timing guides for the center
of the RF pulse, the start, and end of the signal readout time,
respectively.
X 128 image matrix. For each comparison study, images
were acquired in thin slabs of 16 images covering 15 mm
or 16 mm giving a section thickness of 0.94 mm or 1.0
mm. Overlap between multiple slabs was 50%. Imaging
time was approximately 113 sec/slab.
In addition, a 6.8-cm segment of the carotid arteries at
the bifurcation were imaged on one subject in the axial
plane with and without implementation of the 1331 fat
saturation pulse using the transmit-and-receive quadrature
head coil. This scan was then repeated using' the anterior
neck surface coil (receive only) for comparison.
Data Analysis
The average signal intensity normalized to noise
(signal-to-noise ratio (SNR)) of fat, muscle, and vessel (left internal
carotid artery (LICA) and left occipital artery (LOA))
subre-gions were calculated for the subjects at various SPF A and
T values. These two arteries were chosen to cover the
interesting range of vessel sizes and flow rates. It is
ex-pected that the smaller vessel with slower flow (ie, less
blood contrast) will show the largest improvement from
the reduction in fat signal. The CNRs between LICA and
fat, LICA and muscle, LOA and fat, and LOA and muscle
were calculated for each of the various fat saturation pulse
parameters. Vessel regions of interest (ROls) were circular,
centered over the vessel cross-section to include only pixels
that were vessel. The fat ROI was an elliptical shape, placed in the subcutaneous fat in the posterior neck region. The
muscle ROI was placed in the muscle deep to the
subcu-taneous fat in the posterior neck. Noise was computed as
the standard deviation in a region external to any tissue
signal. Computed in this manner, the noise measure is
consistently lower than the true image noise but avoids
FAT SUPPRESSION IN MRA 1431
problems associated with signal intensity. The statistical
significance of differences in the absolute signal intensity
and CNRs following implementation of the fat saturation
pulse into the MOTSA technique was based on the Stu
-dent's t-test.
Results
In an attempt to optimize the 1331 fat satura-tion pulse for the MOTSA MRA sequence, SNRs for arteries, fat, and muscle were measured as a
function of RF saturation pulse flip angle (SPF A)
and interpulse delay (T) of the 1331 fat saturation pulse. Figure 3 shows the effect of SPF A on fat and muscle for all three subjects studied. In each subject, the SNR of both fat and muscle decreases as the SPFA increases. However, as expected, fat shows a more pronounced decline in signal inten
[image:3.612.55.296.84.275.2]-sity.
Figure 4 demonstrates the effect of SPF A on the SNR of the LICA, LOA, fat, and muscle subregions for one subject. This data is typical of that seen for all three subjects. The signal inten-sity from fat rapidly declines as the SPF A in
-creases. The fat signal becomes isointense with muscle when the SPF A (expressed as the sum of
the four RF pulses) reaches 60° (7.5°, -22.5°,
22.5°, -7 .5°). It continues to decline until a signal intensity less than 35% that of muscle is observed at a SPF A of 120°. The average SNRs of the LICA and LOA remain relatively constant until the SPFA reaches 80°, at which time the intensity begins to decrease with increasing SPF A. Addi-tionally, it can be noted that the average SNR of the LICA is larger than that of the smaller LOA. This is due primarily to relative differences in vessel size with resulting partial volume effect and possibly to differences in blood velocity within these vessels.
Figure 5 shows the effect of T on the SNR of
arteries, fat, and muscle intensity for the same subject with the SPF A held constant. The fat signal demonstrates the characteristic trough shape described by Hore (7). The optimal value
of T for fat suppression ranges between 2.0-3.0
msec (167-250 Hz) with the fat signal reaching a nadir at 2.5 msec (200 Hz). The signal intensity of the LICA and LOA fluctuates slightly with the peak noted at 2.5 ms.
A plot of the artery-fat and artery-muscle CNRs
are shown in Figure 6. The CNRs are plotted
1432 ROBISON AJNR: 13, September /October 1992
UCA
LICA
20
~
~
·
~
~
:
::
·
~·
60
20
~
WA
~
~Mu/
""'
S&:Ic0 20 40 60 80 100 120 140 160 lBO 200 0 20 40 GO 80 100 120 \.tO 160 180 200 15 20 25 30 3.5 4.0 Saturn lion l"ulsr Flip An~l(' (:-ii'FA)
lult·qml.<it•l>l'lay r (msl'C)
Fig. 3. Fat and muscle SNRs vs SPFA for all three subjects. (Open symbols are fat,
closed symbols are muscle, box = subject 1, triangle = subject 2, and diamond =
subject 3.
Fig. 4. Left internal carotid artery (LICA), left occipital artery (LOA), fat, and muscle
SNRs vs saturation pulse flip angle (SPFA) for subject 1. Notice that the SNR for the
smaller LOA is much closer to the intensity of fat compared with the larger LICA.
Fig. 5. Left internal carotid artery (LICA), left occipital artery (LOA), fat, and muscle
[image:4.615.56.388.76.232.2]SNRs vs interpulse delay (T) for subject 1. The SPFA has been held constant at 80° (10°, -30°, 30°, -10°).
Fig. 6. CNR of artery-muscle and artery-fat (LICA and LOA) vs SPFA for subject 1.
Observe that the CNR between artery-fat increases rapidly surpassing the CNR between
artery-muscle at a SPFA of 60°.
saturation. At the point where the CNR of
LICA-fat crosses the CNR of LICA-muscle (SPF A =
60°) a 1. 7 -fold increase in the CNR was observed.
For the three subjects studied, an average
in-crease in the CNR of LICA-fat of 1.56 (SD
±
0.12,P
<
.01) was observed at this intersection pointcompared to the same conditions without fat
saturation. Although the CNR of LICA-muscle and
the absolute SNR of the LICA decreases at large
SPF As, there was no statistically significant
re-duction in these values at a SPF A of 60°
com-pared with no fat saturation.
The LOA-fat CNR increases 3.0-fold at a SPF A
of 80° compared with no fat saturation. The LOA
shows a greater increase in the artery-fat CNR
compared with the LICA because the signal
inten-sity of this smaller artery is closer to that of fat
tissue when fat saturation is not implemented.
Once again, at a SPF A of 60° no statistically
significant reduction is noted in the LOA-muscle
CNR nor in the absolute SNR of the LOA.
The improvement in CNR between arteries-fat
can be appreciated in Figure 7 which shows MIP
images of the carotid bifurcation. Figure 7 A was
obtained without the 1331 fat saturation pulse and shows the bifurcation of the left common carotid artery. The same segment of vessel with
implementation of the 1331 fat saturation pulse is shown in Figure 78. Note that the fat signal from the connective tissue planes and carotid sheath surrounding the vessels has been greatly reduced without significant loss of signal from
the vessels. The images in Figures 7 A and 7B
were obtained with a quadrature transmit-and-receive head coil. Figure 7C shows a MIP image obtained using a receive-only anterior neck
sur-face coil. As evident, there is significant
degra-dation of image quality that occurs as a result of using the body coil to transmit the RF pulses.
This is due to inhomogeneity of 80 and the
resulting saturation of blood by the 1331 pulse outside the field of interest.
Discussion
TOF MRA techniques are highly T1-weighted
and produce a relatively bright signal for tissues
with short T1 such as fat. Increasing the
excita-tion flip angle causes an increase in saturation
and a reduction in signal from stationary tissues.
Thus, 2-D TOF techniques, which use large flip
angles (typically
>
60°) have less contributionfrom the bright fat. The use of large flip angles
[image:4.615.71.559.80.395.2] [image:4.615.390.556.84.394.2]AJNR: 13, September/October 1992 FAT SUPPRESSION IN MRA 1433
A B
c
Fig. 7. MIP images of the left carotid artery of subject 1 without fat saturation (A), with implementation of the fat saturation pulse
(B) (both A and B were obtained using a quadrature transmit-and-receive head coil). Note the improved vessel visibility due to decreased
signal from background tissue. For example, marked improvement in the facial artery is apparent (arrows). Figure Cis a MIP image of
the same left carotid artery using fat saturation, however, a receive only anterior neck surface coil was used. Obvious degradation of
image quality is noted when the body coil is used to transmit due to saturation of blood outside the field of interest and inhomogeneities
of Bo.
signal from saturation of blood that remains in the imaging region for multiple excitation pulses. To minimize signal loss in 3-D TOF techniques, flip angles of 15° to 20° are typically used. This compromise in flip angle results in a relatively large signal from fat and still results in significant signal loss from blood that has remained in the slab for multiple pulses. The MOTSA technique, which allows the use of thin slabs, still requires the use of smaller flip angles (typically 30°) to minimize signal saturation in small blood vessels. Thus MOTSA images, which show less vessel signal loss due to saturation than conventional, single-volume, 3-D techniques, still result in a significant signal from fat.
In addition to signal reduction due to partial saturation, the bright fat signal can be reduced by frequency-selective presaturation and also by using frequency-selective timing in echo readout
(8). Selecting echo times such that fat and water are out of phase actually provides significant
reduction in the fat signal. Unfortunately, such echo times are not always coincident with the minimum achievable echo time required for max-imal blood vessel signal. The effects of such out-of-phase techniques were not evaluated in this study.
A variety of fat presaturation techniques have been described in the literature. The 1331 fat saturation pulse has the advantages of being very selective in a homogeneous B0 field and adds
relatively little to the imaging time. In fact, we have found that implementation of the 1331 fat saturation pulse into the MOTSA MRA technique
has resulted in no significant increase in the
imaging time at a TR of 40 msec. Alternatively, the Gaussian presaturation technique is poten-tially less sensitive to inhomogeneities of B0 but
requires a much longer RF pulse duration to achieve the same frequency selectivity as the
1331 pulse, and thus requires a much greater TR
[image:5.612.53.553.81.402.2]1434 ROBISON
We have observed significant improvement in the CNR between vessels and fat of healthy sub-jects through implementation of the 1331 fat saturation pulse into the MOTSA technique. This
improvement is greatest for regions of low blood
velocity (ie, distal to a stenosis), small vessels,
and where the vessel is surrounded by fat. Based
upon our measurements for the three healthy
subjects, the optimal values for SPF A and T of
the 1331 pulse are 60° and 2.0-3.0 msec,
re-spectively. The use of these parameters results
in the improvement observed between Figures
7B and 7 A. In this figure, there is marked
im-provement in vessel visibility due to decreased
signal from background tissue. For example, we
note the improvement in the facial artery
(ar-rows).
As can be seen from Figure 7C, implementa-tion of fat saturaimplementa-tion using a large volume coil can result in a decrease in blood signal. This is apparently due to the saturation of blood from outside the imaging region due to variations in
B0. We would conclude that implementation of a
1331 fat saturation pulse requires the use of a
restricted volume transmit/receive coil such that
80 remains homogeneous in the excited region to
avoid saturation of blood outside the field of
interest. This may require the development of
special purpose cervical and thoracic transmit/ receive coils to replace the use of receive-only surface coils for cervical carotid imaging.
The intensity variation (venetian blind artifact) that is seen at each slab boundary interface is due to several complicating factors and does make image interpretation more difficult. Since the conclusion of this study, this artifact has been
substantially reduced by optimization of imaging
parameters and improvements to the
postpro-cessing algorithm. Specifically, the artifact is now
reduced by increasing the slab excitation width relative to the imaged width and by combining image detail from overlapping sections.
In older patients who have an inherently lower CNR between vessel and fat due to reduced flow
states, stenosis, or increased fatty tissue in the
AJNR: 13, September /October 1992
neck, this technique may provide significant
im-provement in vessel visibility. Additional work is needed to evaluate the potential utility of this technique in a broad patient population.
Acknowledgments
The authors wish to thank Julie Cha, Gerri Jelaco, and Kathy Taylor for technical assistance and Richard A. Robb,
Ph.D. at the Mayo Foundation for use of the ANALYZE software package. This work was supported in part by a grant from the Deseret Foundation of the LOS Hospital.
References
1. Gullberg GT. Wehrli FW. Shimakawa A, Simons MA. MR vascular
imaging with a fast gradient refocusing pulse sequence and refor
-matted images from transaxial sections. Radiology 1987;165:
241-246
2. Wehrli FW, Shimakawa A, Gullberg GT, MacFall JR. Time-of-flight
MR flow imaging: selective saturation recovery with gradient refoc
us-ing. Radiology 1986; 160:781-785
3. Rossnick S, Laub G, Braeckle R, et al. Three dimensional display of blood vessels in MRI. In Proceedings of the IEEE Computers Cardio l-ogy Conference. New York: New York Institute of Electrical and Electronic Engineers, 1986:193-196
4. Dixon WT. Simple proton spectroscopic imaging. Radiology 1984;
153:189-194
5. Blatter DD, Morris AH, Ailion DC, Case TA, Cutillo AG. Asymmetric spin-echo sequences: a new method for obtaining NMR 'H images.
Invest Radiol1985;20:845-853
6. Frahm J, Haase A, Hanicke W, Matthaei D, Bomsdorf H, Helzel T.
Chemical shift selective MR imaging using a whole-body magnet.
Radiology 1985; 156:441-444
7. Here PJ. Solvent suppression in Fourier transform nuclear magnetic resonance. J Magn Reson 1983;55:283-300
8. Szumouski J, Eisen JK, Vinitski S, Haake PW, Plewes DB. Hybrid
methods of chemical-shift imaging. Magn Reson Med 1989;9:
379-388
9. Laub G, Lewin JS, Tkach JA. Fat-suppressed time-of-flight MR
angiography (abstr). In: Book of abstracts: Society of Magnetic
Resonance in Medicine 1990. Berkeley, CA: Society of Magnetic Resonance in Medicine, 1990:219
10. Parker DL, Yuan C, Blatter DD. MR angiography by multiple thin slab
3D acquisition. Magn Reson Med 1991 ;17:434-451
11. Blatter DD, Parker DL, Robison RO. Cerebral MR angiography with
multiple overlapping thin slab acquisition. I. Quantitative analysis of
vessel visibility. Radiology 1991; 179:805-811
12. Parker DL, Yuan C, Simons MA, Gullberg GT. Time-of-flight vessel