Knowledge of the foraging ecology of marine endotherms is increasing rapidly, principally as a result of advances in sophisticated technology (e.g. Le Boeuf et al. 1988; Jouventin and Weimerskirch, 1990; Ponganis et al. 1990). However, it is only recently that attempts have been made to determine when feeding actually takes place. For example, Bornemann (1994) used a strain gauge on Weddell seals Leptonychotes weddellii to examine jaw movement and thus to elucidate feeding patterns. Several researchers have opted for a stomach temperature sensor as a means of determining prey ingestion (Wilson et al. 1992a; Gales and Renouf, 1993; Hedd et al. 1995; see also Sakamoto et al. 1990), the idea being that ectothermic prey, being considerably cooler than their endotherm predators, will elicit a temporary temperature drop in the stomach. As a consequence, there are now published data on feeding activity in a number of free-living penguin species (Wilson et al. 1992b, 1993, 1994; Pütz, 1994; Pütz and Bost, 1994; Wilson and Wilson, 1995; Wilson, 1995), wandering albatrosses, Diomedea exulans (Weimerskirch and Wilson, 1992; Wilson et al. 1992a; Cooper et al. 1993), bank
cormorants, Phalacrocorax neglectus (Grémillet and Plös, 1994), and Weddell seals (J. Plötz, personal communication) as well as a number of studies on captive species such as harp seals Phoca groenlandica (Gales and Renouf, 1993; Hedd et al. 1995) and great cormorants Phalacrocorax carbo (Grémillet and Plös, 1994).
Utilization of stomach temperature sensors is, however, not particularly straightforward and interpretation of data is subject to a number of biases, none of which has really been examined in any depth in the literature (but see Grémillet and Plös, 1994). Here we examine stomach temperature data from free-living and captive animals, as well as data from laboratory stomach simulations to assess the reliability and applicability of using stomach temperature sensors to measure feeding activity in marine endotherms.
Materials and methods Measurement of stomach temperature
We used two types of stomach temperature archival units
Printed in Great Britain © The Company of Biologists Limited 1995
We examined the accuracy of stomach temperature archival units (STAUs), which are typically used to determine feeding activity in marine endotherms, with regard to determination of the time of prey ingestion as well as the number of prey items ingested and their masses. Units were deployed in nine species of free-living seabirds, where feeding conditions were uncontrolled, eight species of captive seabirds, where feeding conditions could be partially controlled, and in laboratory stomach simulations, where variables could be strictly controlled. The quality of data obtained on the timing of feeding, the mass ingested and the number of prey items ingested was subject to two main sources of error (i) those induced by changes in animal activity and (ii) those resulting from the physical form of the STAUs themselves. Animal activity factors considered important included the following:
variability in (a) body temperature, (b) stomach blood perfusion, (c) consistency of stomach contents and (d) stomach churning and changes in body orientation. The physical form (size and buoyancy) of the STAU affected the location of the unit within the stomach, and thus the likelihood that ingested prey comes into contact with the sensor. The timing of prey ingestion can generally be determined accurately; however, considerable errors in mass estimates can occur if data acquired using STAUs are not critically assessed. An understanding of these sources of errors will allow researchers to construct STAUs appropriate to the species being studied and to analyze data critically so that errors are reduced.
Key words: stomach temperature, seabirds, endotherms, ingestion, feeding.
Summary
RELIABILITY OF STOMACH TEMPERATURE CHANGES IN DETERMINING
FEEDING CHARACTERISTICS OF SEABIRDS
RORY P. WILSON1, KLEMENS PÜTZ1, DAVID GRÉMILLET1, BORIS M. CULIK1, MANDY KIERSPEL1,
JANA REGEL1, CHARLES A. BOST2, JOCHIM LAGE2 ANDJOHN COOPER3
1Institut für Meereskunde, Düsternbrooker Weg 20, D-24105 Kiel, Germany, 2Centre d’Ecologie et Physiologie Energetiques, CNRS, 23 rue Becquerel, 67087 Strasbourg, France and 3Percy FitzPatrick Institute of African
Ornithology, University of Cape Town, Rondebosch 7700, South Africa
Accepted 12 January 1995
(STAUs). One, the Einkanaliger Automatischer Temperatur Logger (EATL; Elkutec Electronic GmbH, D-84174 Eching, Germany) consisted essentially of a 32 kbyte memory chip which could record temperature over the range 20–45 ˚C via a sensor, with relative accuracy of better than 0.1 ˚C and an absolute accuracy of better than 1.0 ˚C (no drift) at intervals of 8, 16 or 32 s. The timing was based on a quartz clock. EATLs were powered by a 6 V lithium battery. The electronic unit was housed in a titanium tube closed by an O-ring and so orientated that the temperature sensor lay flush with one end of the housing. The high conductivity of the titanium ensured that temperature changes in the housing were transmitted rapidly to the sensor. When ready for deployment, the EATL had a mass of approximately 80 g, was 100 mm long and had a diameter of 23 mm. The second unit, the Single Channel Unit Processor (SICUP; Driesen and Kern GmbH, Am Hasselt 25, D-24576 Bad Bramstedt, Germany) was essentially very similar to the EATL except that it had a memory of 128 kbytes and recorded temperature every 16 s. Since SICUPs were built using surface-mounted technology, the units were considerably smaller than EATLs. A number of differently sized units were deployed, the smallest being 69 mm long and 12 mm in diameter with a mass of 16 g, while the largest was 95 mm long, had a diameter of 19 mm and a mass of 30 g. SICUPs measured temperature between 0 and 50 ˚C, 16 and 41 ˚C or 20 and 45 ˚C, depending on model types and had relative accuracies of better than 0.2 ˚C and absolute accuracies of better than 1.0 ˚C (no drift). Both SICUPs and EATLs were regularly calibrated in waterbaths.
In the worst case, the STAUs represented less than 3 % of the body mass and 10 % of the maximum stomach volume of the species in which they were deployed. In the case of the smaller penguin species, these units may have occupied up to half the total length of the stomach and it must be considered that this, in itself, may have been enough to induce unnatural digestive processes, although examination of captive birds with, and without, such units showed no evidence that this was the case. Seabirds may swallow single prey items in excess of 10 % of their own body mass (R. P. Wilson, unpublished data), which may explain their tolerance of the STAUs.
Three approaches were adopted to examine the temperature changes in endotherm stomachs in relation to ectothermic prey ingestion. Data were collected (1) from free-living animals, in which changes in stomach temperature could be observed but the causes of these changes only inferred, (2) from captive animals fed known quantities of food under well-defined conditions so that many of the uncontrolled parameters in the free-living animals could be assessed and (3) from experiments using balloons in waterbaths to simulate stomachs in endotherms. Here, the precise physical conditions of the system could be carefully controlled.
Data from free-living animals
Between April 1991 and March 1994, 125 individuals from nine free-living, breeding seabird species were successfully equipped with STAUs (Table 1). Birds were captured at, or near, their nest sites and induced to swallow a unit before being set
free. STAUs were recovered after one or more foraging trips (deployment duration between 8 and 576 h) either because the units were regurgitated as pellets (see Grémillet and Plös, 1994) or by stomach flushing (Wilson, 1984). According to the distribution at sea of the species studied, the temperature of the prey items swallowed would have varied between 21 and 22 ˚C.
Data from captive animals
Between August 1991 and March 1994, 65 individuals from nine captive species were used in feeding experiments (Table 2). Birds were either induced to swallow STAUs or, in the case with the great cormorants at Neumünster Zoo, were trained to swallow fish ad libitum within which STAUs were implanted. Units were recovered after periods ranging between 4 and 696 h either as pellets or by stomach flushing (Wilson, 1984). The effects of bird activity on STAU response were studied by feeding great cormorants while the birds were engaged in two different activities. Birds were either fed while resting on land or while actively swimming and diving in a 10 m31 m31 m water tunnel similar to that used by Culik and Wilson (1991) for penguins.
Data from laboratory stomach simulations
Balloons of varying sizes and thicknesses were used in waterbaths to simulate stomachs in endotherms (see Wilson et al. 1992a). Here, a passive centre (balloon/stomach) is warmed by an active exterior (waterbath/endotherm body). STAUs were placed in the balloons and the balloons ‘fed’ at specific times with known quantities of material at defined temperatures.
Three partially interrelated factors were considered to be important in determining the way STAUs reacted to the ingestion of cold food: (1) the degree of stomach mixing; (2) the probability of contact between sensor and cold food; and (3) the amount of heat transfer that occurs between the body cavity outside the stomach and the stomach itself.
Degree of stomach mixing
This is dependent on (i) the consistency of the stomach contents and (ii) the degree of stomach churning. The effect that the consistency of the stomach contents might have on STAU reaction to the ingestion of cold food was examined by ‘feeding’ balloons in waterbaths with measured quantities of water or squid. Balloons filled with water are liable to have a much more uniform temperature than those filled with squid because the mixing process in them is facilitated. The effect that stomach churning might have on STAU reaction to the ingestion of food was examined by subjecting balloons in waterbaths to varying degrees of mechanical manipulation. After being ‘fed’ squid, balloons were left completely still, or shaken lightly using a shaker function in the waterbath or kneaded by hand.
The probability of contact between sensor and food
(i.e. whether or not they are buoyant). In order to control for variability in the size of the stomach with respect to the size of the sensor, balloons with volumes of between 120 and
[image:3.609.52.556.88.348.2]1500 ml were used with standard-sized STAUs and were ‘fed’ squid at regular intervals until the balloon was full. In addition, temperature profiles within the balloons were determined by Table 1. Free-living species used for STAU experiments
Number of individuals Unit successfully
Species deployed equipped Locality
King penguin EATL 31 Possession Island, Southern Indian Ocean
Aptenodytes patagonicus SICUP 29
African penguin EATL 10 Dassen Island, South Africa
Spheniscus demersus
Magellanic penguin EATL 2 Chubut, Argentina
Spheniscus magellanicus
Adélie penguin EATL 18 King George Island, Antarctica
Pygoscelis adeliae
Chinstrap penguin EATL 17 King George Island, Antarctica
Pygoscelis antarctica
Wandering albatross EATL 2 Marion Island, Southern Indian Ocean
Diomedea exulans EATL 3 Possession Island, Southern Indian Ocean
SICUP 1
Bank cormorant SICUP 7 Dassen Island, South Africa
Phalacrocorax neglectus
Cape cormorant SICUP 3 Bird Island, South Africa
Phalacrocorax capensis
Cape gannet SICUP 2 Bird Island, South Africa
Sula capensis
Species are only listed when data were successfully obtained. The list does not include occasions when units were lost by regurgitation or data transfer did not successfully occur for technical reasons.
Table 2. Species used in captivity for STAU experiments Number of
Unit individuals Number of
Species deployed equipped times used Locality
Emperor penguin EATL 12 16 Drescher Inlet, Antarctica
Aptenodytes forsteri
King penguin EATL 15 15 Possession Island, Southern Indian Ocean
Aptenodytes patagonicus SICUP 7 7
Humboldt penguin SICUP 3 14 Laboratory, Chile
Spheniscus humboldti
Magellanic penguin EATL 1 1 Chubut, Argentina
Spheniscus magellanicus
African penguin EATL 5 5 Dassen Island, South Africa
Spheniscus demersus
Macaroni penguin SICUP 11 11 Possession Island, Southern Indian Ocean
Eudyptes chrysolophus
Rockhopper penguin SICUP 1 1 Possession Island, Southern Indian Ocean
Eudyptes chrysocome
Wandering albatross EATL 1 1 Possession Island, Southern Indian Ocean
Diomedea exulans
Great cormorant EATL 4 28 Zoo Neumünster, Germany
Phalacrocorax carbo SICUP 5 56
[image:3.609.46.564.421.660.2]using a Testo 701 thermometer equipped with a technotherm probe (diameter 2.4 mm3140 mm length) inserted directly through the centre of the stomach contents until it reached the lower limits. The effect of the position of the sensor within the stomach on STAU measurements was examined by equipping larger balloons with two types of STAU, one that was buoyant with respect to the stomach contents (STAUfloat) and one that
was denser than the stomach contents (STAUsink). Balloons
were then ‘fed’ with known quantities of squid.
Heat transfer
The amount of heat transfer that occurs between the body cavity and stomach depends on (i) animal activity, which can lead to higher body temperatures (Wilson et al. 1992b, 1993; Grémillet and Plös, 1994) and (ii) the degree of blood flow around the stomach, which varies the effective insulation around the stomach. We examined the effect of animal activity by looking at the reaction of STAUs in balloons being ‘fed’ water while immersed in waterbaths at 38, 39 or 40 ˚C. The effect of the degree of insulation around the stomach on STAU measurements was examined by putting STAUs in single balloons and in balloons used in a triple layer. Balloons were then ‘fed’ known quantities of water at precise intervals.
Analysis of data from STAUs
Drops in measured stomach temperature due to the ingestion of food were analysed according to methods given in Wilson et al. (1992a) and Grémillet and Plös (1994). Factors considered important in determining the change in temperature occurring in the stomach after the ingestion of cold food in endotherms are as follows: the mass (Mf), the temperature (Tf)
and the specific heat capacity (SHCf) of the food. The energy
(E) that must be invested by the endotherm to heat the ingested mass is given by:
E = SHCf3Mf3(Ta2Tf) , (1)
where Ta is the temperature to which the ingested food must
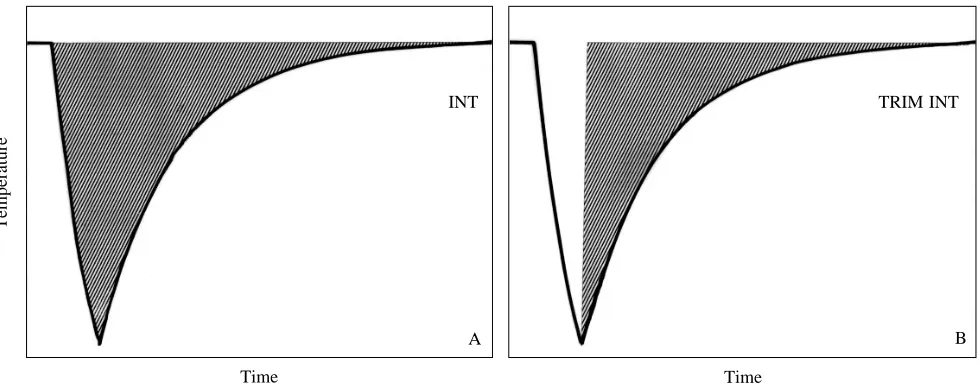
be heated. Typically, after the ingestion of cold food, STAUs record a precipitous temperature drop followed by an approximately exponential rise (a PDER event, see Wilson et al. 1992a; Fig. 1A). The integral of this drop from the moment the food is ingested until the temperature reaches the asymptote (INT) (Fig. 1A) is considered to be linearly related to E so that:
INT = m3E , (2)
where m describes the gradient of the slope (˚C s J21) and is a
measure of the speed with which the heat produced by the endotherm is transferred to the ingesta (itself dependent on many factors, e.g. stomach insulation, churning, etc.). Consequently:
INT = m3SHCf3Mf3(Ta2Tf) . (3)
Theoretically, therefore, knowledge of the relationship between INT and E enables researchers to calculate the mass of food ingested by free-living endotherms using:
M = INT/[m3SHCf3(Ta2Tf)] . (4)
Grémillet and Plös (1994) modified calculations of INT as suggested by Wilson et al. (1992a) so that the integral below the asymptote was only derived between the point of maximum temperature drop and the asymptote during the ingesta warming phase (Fig. 1B). They called integrals thus derived TRIM (integrals derived from the temperature rise integration method). This method was developed because in cormorants, the birds with which they worked, the PDER events do not always have a precipitous temperature drop, but rather the temperature falls in stages. The relationship between TRIM and E shows less variability around a straight-line fit than that between INT and E in great cormorants so this method may prove better for calculation of masses ingested (see later).
Time Time
B A
INT TRIM INT
[image:4.609.59.549.523.717.2]Temperature
Results
Results from free-living animals
The classic example of prey ingestion illustrated by a PDER event, as defined by Wilson et al. (1992a), occurred frequently in wandering albatrosses (Fig. 2). Here, the temperature drop subsequent to ingestion was always abrupt and the rise generally smooth and well-approximated by an exponential curve fit. Essentially three types of ‘ideal’ PDER were recorded (i) where the pre-ingestion and asymptotic temperatures were the same, (ii) where the pre-ingestion temperature exceeded the post-ingestion asymptotic temperature and (iii) where the post-ingestion asymptotic temperature exceeded the pre-ingestion temperature.
Approximately 20 % of the PDER events recorded by STAUs in wandering albatrosses had temperature rises that were not well fitted by exponential curves (Fig. 3). Such temperature rise phases were also recorded from all other species in which STAUs were used. Although in wandering albatrosses PDER events were generally separated by clear asymptotes, apparent multiple prey ingestion led to multiple, overlapping PDER events where a true asymptote was only reached after the last prey item had been ingested (Fig. 4A). This situation appeared most extreme in king penguins, where many overlapping small PDER events could lead to a substantial overall temperature drop over the course of several hours before a significant temperature rise phase was apparent (e.g. Fig. 4B). In extreme cases, this temperature drop could exceed 20 ˚C.
There was clear evidence that STAUs in free-living animals might occasionally record apparent small PDER events even though it was unlikely that cold material was swallowed at that time. For example, king penguins equipped with STAUs, and whose activity was simultaneously monitored by depth
recorders, generally showed precipitous drops in temperature associated with diving activity. Occasionally, however, such multiple temperature drops were even recorded in birds that were apparently resting on the sea surface and not engaged in any diving behaviour (Fig. 5). Such multiple temperature drops only occurred directly after diving activity where feeding had taken place, ceased after a maximum of 2 h subsequent to the last dive, and never led to an overall drop in measured stomach temperature (e.g. Fig. 5).
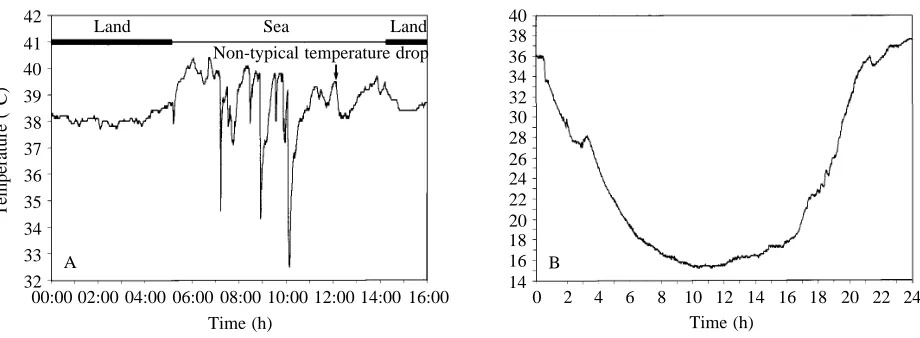
Detailed analysis of stomach temperature in Adélie Pygoscelis adeliae, African Spheniscus demersus and chinstrap Pygoscelis antarctica penguins in relation to diving activity showed that post-diving multiple temperature drops, such as were occasionally found in king penguins, did not occur. However, temperature drops were sometimes recorded during diving bouts when the birds were at the surface, even though swimming speed and depth measurements of preceding dives were highly indicative of feeding behaviour at depth (Wilson and Wilson, 1995). This appeared to be due to latency in the response of the STAU to prey ingestion. Assessment of feeding activity in penguins that encountered prey for the first time on a foraging trip, and thus had empty stomachs, indicated that STAUs initially recorded prey ingestion with little or no latency. However, as the stomach filled, the response of the units became progressively more displaced until apparent feeding activity failed to co-incide with dives (Fig. 6).
Penguins foraging to feed their chicks showed a further departure from the classic PDER event which, when it occurred, always took place at the end of the foraging period. Here, stomach temperature dropped in a series of steps, but there was little or no temperature rise between apparent ingestion events so that overall the temperature fell for periods encompassing several hours before it slowly rose to asymptotic levels, approximating a sigmoid curve (Fig. 7A,B)
Captive animals
Observation of all captive animals revealed that precipitous 38.2
38.0
37.8
37.6
37.4
37.2
37.0
36.8
36.6
Temperature (°C)
0 2 4 6 8 10 12 14 16 18 20 22 24 26 Time (min)
37 38 39 40
36 35 34 33 32 31 30 29
Temperature (°C)
[image:5.609.52.297.492.670.2]0 20 40 60 80 100 120 140 160 180 200 Time (min)
Fig. 2. Temperature change recorded by a STAU in the stomach of a wandering albatross as a result of prey ingestion. The change in temperature shows a typically precipitous temperature drop followed by a rise approximated by an exponential curve (PDER event, see text). The steps are derived from the resolution of the unit, which was good to 0.1 ˚C.
[image:5.609.331.551.530.692.2]temperature drops (drops greater than 0.2 ˚C per 32 s interval) never occurred unless the animals had ingested cold food or water.
General features of single prey ingestion
STAUs in captive birds that had been fed prey of known mass and temperature showed very variable responses both inter- and intraspecifically. For example, STAUs in emperor penguins Aptenodytes forsteri fed on squid generally recorded a fairly marked temperature drop and a subsequent rise which approximated a classic PDER event. STAUs in great cormorants fed a single prey item, however, tended to record a precipitous temperature drop which proceeded in stages and even showed minor temperature rises at intervals (Fig. 8). The warming phase approximated a classic PDER event, although momentary temperature drops of up to 0.1 ˚C per 16 s recording interval were occasionally observed.
Prey size
The relationship between INT and E in birds fed prey items of different sizes appeared to be linear, with correlation coefficients (r2) typically being of the order of 0.6. The use of
calculated regression fits to determine prey masses directly from the integrals under the asymptotes and then comparing them with known masses showed that errors of up to 210 % could occur in mass estimations, although mean errors were generally less than 30 %.
38 40
36
34
32
30
28
26
Temperature (°C)
0 10 20 30 40 50 60 70 80 90 Time (min)
A
39 40
38
37
36
35
34
33
32
0 2 4 8 10 12 14 16 18
Time (h) 6
[image:6.609.76.526.72.239.2]B
[image:6.609.51.285.288.450.2]Fig. 5. Changes in stomach temperature (centre trace) in relation to diving depth (upper trace) in a king penguin. There was no evidence of diving activity after 21:31 h. Bars linked to the x-axis show points where temperature drops in excess of 0.2 ˚C occurred per 32 s, which is generally taken to be a indication of prey ingestion. Bar height is proportional to temperature drop.
Fig. 4. Multiple PDER events where prey item n+1 is apparently ingested before asymptotic temperatures following ingestion of prey item n are reached. Examples from (A) a wandering albatross and (B) a king penguin.
90 30
70
110 130 150 50 10
22:00 12:00 14:00 18:00 20:00 24:00
Time (h) 16:00
Dive depth (m)
Temperature (°C)
36 40
38
34
32
30
0 5
5
10
15 10 15
09:07 09:19 09:25
1 2 3
Time (h) 09:13
Depth (m)
Swim speed (km
h
−
1)
Temperature
(°C)
42 40 38
[image:6.609.315.558.292.453.2]Multiple prey ingestions
The response of the STAUs to multiple prey ingestion in captive birds was much more variable per ingestion event than that of STAUs to the first prey item. In great cormorants fed prey at intervals of approximately 3 min, the first ingestion event was almost always recorded (Fig. 9), but there was a tendency for temperature drops presumed to occur in the stomach associated with the ingestion of subsequent prey items to be missed. Consequently, the gradient of the fit between INT and E decreased and relatively fewer PDER events were recorded with increasing number of prey items swallowed. For example, the mean value of m for first prey items ingested by swimming great cormorants was significantly higher than that for second prey items [m=0.16±0.09 ˚C s J21 (mean ± S.D.),
N=11, for the first event and m=0.05±0.08 ˚C s J21, N=8 for the
second; t=2.75, P<0.05] (Table 3).
Water calibrations
STAU response to water calibrations performed on captive animals, where previously fasting individuals were induced to swallow particular amounts of water, closely approached classic PDER events (Fig. 10). For any particular amount of water, there was also little variability in the two values of m intraspecifically (Table 4). Most variation resulted from the 39
40 41 42
38 37 36 35 34 33 32
10:00
00:00 02:00 06:0008:00 12:00 14:00 16:00 Time (h)
04:00
Temperature (°C)
Land Sea Land
Non-typical temperature drop
B A
34 36 38 40
32 30 28 26 24 22 20 18 16 14
[image:7.609.77.537.67.236.2]0 2 4 6 8 10 12 14 16 18 20 22 24 Time (h)
[image:7.609.324.559.340.519.2]Fig. 7. Extended temperature drop in a penguin stomach associated with prey ingestion followed by an increase in temperature not approximated by an exponential curve. (A) For a chinstrap penguin Pygoscelis antarctica (arrow). Normal PDER events mid-way through the period at sea are apparent. Periods when the bird was on land and at sea are shown by the upper bars. Substantial increases in stomach temperature occur at the onset of foraging, presumably as a result of heat generated by muscles during swimming. Note that these changes in stomach temperature, and those incurred by the bird when on land, do not occur as rapidly as those associated with prey ingestion (see text). (B) Detailed picture of such an extended temperature drop and subsequent rise using data derived from a king penguin. During the period under consideration the bird was actively diving.
Fig. 8. Response of a STAU to changes in stomach temperature incurred as a result of a great cormorant swallowing a single prey item. The recording shows small increases in temperature between precipitous drop phases.
41.5
41.0
40.5
40.0
39.5
39.0
38.5
38.0
Temperature (°C)
Prey ingestion
0 5 10 15 20 25 30 35 40
Time (min)
4000
3500
3000
2500
2000
1500
1000
500
0
Integral (°C
s
−
1)
0 5 10 15 20 25 30
Energy (kJ)
[image:7.609.66.290.341.501.2]amount of water used in the calibration. Here, larger amounts of water led to decreasing values of m so that the relationship between INT and E was not linear (Table 4). STAU responses to water calibrations performed on captive animals with full stomachs were much more variable, although PDER events were always recorded in the smaller species (body masses below 6 kg). In approximately 40 % of 18 cases where king penguins with full stomachs were given water (volumes between 100 and 300 cm3), no temperature drop was noted.
Bird activity
Previously fasted great cormorants fed single prey items while swimming and diving had significantly different values of m compared with birds that were fed while inactive on land (m=0.16±0.09 ˚C s J21, N=11, in active birds and
m=0.30±0.23 ˚C s J21, N=26, in inactive birds, one-tailed
t=1.94, P<0.05). In both cases, prey were sometimes ingested with no temperature drop being measured by the STAUs (9 % of all cases for swimming birds and 4 % for resting birds). There was no significant difference in values of m between swimming and diving birds and birds on land with regard to second ingested fish (m=0.05±0.08 ˚C s J21, N=8, for active
birds and m=0.05±0.10, N=13, for inactive birds, t-test,
P>0.05) or third-ingested fish (m=0.070±0.112 ˚C s J21, N=5,
for active birds and m=0.0±0.0 ˚C s J21, N=7, for inactive birds,
t-test, P>0.05).
Experiments in waterbaths Simulations of degree of stomach mixing
Consistency of stomach contents. The consistency of the stomach contents, as simulated by a balloon in a waterbath, was an important factor in the determination of the relationship between INT and E. In general, the more fluid the balloon contents, the higher the value of m. For example, STAUsink
values in non-moving balloons in a waterbath at 40 ˚C fed with just water indicated that the relationship between INT and E gave a value for m of 2.59 ˚C s J21 (INT=2.59E2102.7,
r2=0.96, N=14), whereas balloons fed with squid gave a value
for m of 1.59 ˚C s J21 (INT=1.59E21268.7, r2=0.55, N=26).
[image:8.609.56.560.101.218.2]The difference is significant (F-test, P<0.001).
Table 3. Calculated mean values of m as a function of the timing at which sequential prey are fed to great cormorants (m) is the gradient of the slope of the integral of the temperature drop plotted against energy, see equation 2
Birds on land; prey ingested Birds in water; prey ingested
First Second Third First Second Third
Mean value of m (°C s J−1) (all data) 0.30 0.05 0 0.16 0.05 0.07
S.D. 0.23 0.10 0 0.09 0.08 0.11
Mean value of m (°C s J−1) (values>0) 0.32 0.17 0 0.18 0.11 0.18
S.D. 0.23 0.12 0 0.08 0.09 0.11
Percentage of prey items discovered 96 31 0 91 50 40
Number of prey given 26 13 7 11 8 5
Birds were either actively swimming or resting on land.
34 36 38 40 42
32 30 28 26 24 22 20 18
0 3 6 9 12 15 18 21 24 27
Time (h)
Temperature (°C)
[image:8.609.55.281.239.408.2]Fig. 10. Response of a STAU in a captive chinstrap penguin to the ingestion of 50 ml of sea water at 1 ˚C.
Table 4. Calculated mean values of m for penguins fed differing amounts of cold water
Water Percentage Mean volume of body m-value
Species (ml) mass (°C s J−1) S.D. N
King penguin 100 0.9 0.58 0.05 4
Aptenodytes patagonicus 200 1.8 0.43 0.10 31
300 2.8 0.39 0.14 15
500 4.6 0.33 0.09 4
African penguin 50 1.7 1.56 0.09 3
Spheniscus demersus 100 3.3 1.13 0.05 5
200 6.7 1.08 0.11 4
Gentoo penguin 50 0.9 0.65 – 1
Pygoscelis papua
Adélie penguin 50 1.0 0.36 0.08 8
Pygoscelis adeliae
Chinstrap penguin 50 1.2 0.39 0.28 7
Pygoscelis antarctica
In king penguins, m-values for birds ingesting 100 and 200 ml, 100 and 300 ml and 200 and 500 ml are significantly different (t-test;
P<0.05), as are the m-values for African penguins ingesting 50 and
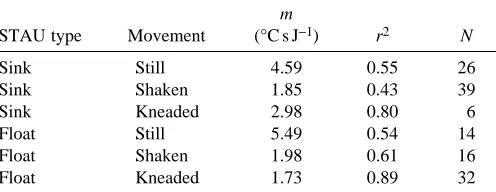
[image:8.609.308.561.268.456.2]Degree of stomach peristalsis. The attempts to simulate varying degrees of stomach peristalsis by subjecting balloons in waterbaths to different degrees of movement while using squid to simulate ingestion events showed that values of m were strongly dependent on the degree of stomach churning. In general, the more the stomach was churned the lower the value of m (Table 5).
Probability of contact between STAU and ingested food Stomach size in relation to STAU size. The likelihood that
feeding events would be recorded as a temperature drop by a STAU in a balloon was dependent on the size of the STAU in relation to the balloon. Relatively larger STAUs recorded temperature drops better than smaller units. For example, a STAUsink of volume 14.9 ml in a balloon of 120 ml (with no
mixing) being given squid recorded all 12 ingestion events (100 %) with a mean m-value of 7.90±4.72 ˚C s J21 (N=12)
(seven of these ingestion events are illustrated in Fig. 11). An identical STAUsinkin a 1500 ml balloon, however, only recorded
7 of 12 ingestion events (58 %), the mean value of m derived from these seven events being 1.00±0.26 ˚C s J21(N=7). In this
case, the mean value of m of all 12 events, which includes five zero values, was 0.58±0.53 ˚C s J21(N=12) (Fig. 11).
Position of STAUs in the stomach. Our experiments with balloons and waterbaths showed that STAUfloat units were
considerably better at detecting temperature changes associated with material ingestion than STAUsink units,
although both units recorded ingestion relatively well when the balloon was empty. For example, when both a STAUsinkand
a STAUfloat were put into a single non-moving balloon of
volume 1500 ml together, the STAUfloatrecorded all 12 of the
material ingestion events (100 %), while the STAUsink only
[image:9.609.49.297.242.338.2]recorded 7 (58 %) (seven of these ingestion events are illustrated in Fig. 11). Calculation of m-values and the scatter in regressions of INT versus E also differed considerably as a result. In the experiment described above, the m-value for the Table 5. Mean values of m calculated from data recorded by
STAUs in balloons in waterbaths as a response to being fed with squid
m
STAU type Movement (°C s J−1) r2 N
Sink Still 4.59 0.55 26
Sink Shaken 1.85 0.43 39
Sink Kneaded 2.98 0.80 6
Float Still 5.49 0.54 14
Float Shaken 1.98 0.61 16
Float Kneaded 1.73 0.89 32
STAUs were either more dense (sinks) or less dense (floats) than stomach contents and balloons were subject to different movement regimes so as to stimulate differing types of stomach churning.
34 36 40
32
40
36
4 6 2
8 10 12 40
Temperature (°C)
Depth (cm)
Temperature (°C) 10−3×Time (s)
0 2 4 6
7.2
98.4 6.6
66.8
6.0
77.3
3.6
69.9
5.0
62.5
4.5
96.9
8.9
95.8
8 10 12 14 16 18
25 40 25 40 25 40 25 40 25 40 25 40 25 40
STAU sink
Small stomach
STAU float
STAU sink
Large stomach
6
6
Fig. 11. Temperatures recorded by STAUs (volume 14.9 ml) in balloons ‘fed’ with squid at various intervals. For the period shown, seven squid were given. The upper line shows the response of a STAUsinkin a balloon of maximum volume 120 ml. The lower line shows the response of
a STAUsinkand the middle line the response of a STAUfloat, both in the same balloon of maximum volume 1500 ml. Arrows show when ingestion
[image:9.609.50.565.400.679.2]STAUfloatwas 2.76±1.58 ˚C s J21(N=12), whereas that for the
STAUsinkwas 1.00±0.26 ˚C s J21(N=7; values only considered
where squid ingestion was detectable and consequently INT>0). This occurred because the buoyancy of the STAUfloat
units caused them to rise to the neck of the balloon, which is where the ingesta was administered, whereas STAUsinkunits
could be rapidly covered by incoming ingesta. Heat transfer
Heat transfer as a function of activity. In order to simulate the higher body temperatures associated with increased activity, balloons in waterbaths were ‘fed’ water at a specific temperature while the asymptotic temperature of the waterbath was varied. Here, m-values decreased with increasing waterbath temperature. For example, in a series of experiments where a single balloon was used (and the exact insulative capacity of the balloon walls consequently remained constant), the m-value decreased from 2.65±0.42 ˚C s J21(N=7) at 38 ˚C
to 2.32±0.27 ˚C s J21 (N=7) at 39 ˚C to 2.16±0.54 ˚C s J21
(N=7) at 40 ˚C. This amounts to a change in m of over 10 % per degree change in waterbath temperature.
Blood flow and insulation. STAUs in balloons immersed in waterbaths recorded different rates of heating as a function of balloon insulation. This was intended to simulate changes that might occur as a result of changes in blood flow around the stomach or as a direct result of changes in the insulation of the stomach due to factors such as varying stomach wall thickness. For example, STAUs in two balloons in the same waterbath, where one balloon had a wall thickness approximately three times that of the other, reacted to the ‘ingestion’ of water by giving m-values of 5.79±0.78 ˚C s J21 (N=7) and
2.54±0.44 ˚C s J21(N=7), for the thicker and thinner balloon,
respectively. These values are significantly different (t-test, P<0.01).
Discussion
Model of the physics of heat transfer to the stomach The changes in temperature that occur in the stomach during food intake can be relatively easily modelled with only a few assumptions, enabling hypotheses regarding the best method of determining mass ingested to be examined. To simplify matters, we assume that the stomach contents are always perfectly mixed, such as would be approximately the case if the animal swallowed water. The rate of supply of heat from the animal to the stomach contents per unit surface area of the stomach (dHarea/dt) (assuming that all the stomach surface area
is in contact with the stomach contents) is likely to be a direct function of the temperature difference between stomach contents (Ts) and animal body temperature (Ta) such that:
dHarea/dt = K(Ta2Ts) , (5)
where K is a constant. Assuming that the stomach can be approximated by a sphere, the surface area of the stomach in contact with the contents is dependent on the volume enclosed. Since the surface area (A) of a sphere is:
A = 4pr2, (6)
where r is the radius and the volume (v) of a sphere is:
V = (4/3)pr3. (7)
Then:
and A can be given by:
Thus, the the total rate of heat supply to the stomach contents is:
and the temperature increase per unit time is:
where M is the overall mass of the stomach contents and SHC is their specific heat capacity. Thus:
Ts= C0e2ct+ Ta, (12)
where C0is a constant and c is a constant given by:
Here, when t=0, as occurs at the start of ingestion:
C0= Ts(0)2Ta, (14)
i.e. C0<0.
Finally, in order that the model can accommodate changes in temperature that occur as a result of swallowed food at low temperature mixing with ingesta that have already been warmed, or partially warmed, to animal body temperature, we must allow for the fact that the final temperature of the stomach contents Tsdirectly after such a mix depends on the mass (Msi),
temperature (Tsi) and specific heat capacity (SHCsi) of the
ingesta already in the stomach as well as on the mass (Msa),
temperature (Tsa) and specific heat capacity (SHCsa) of the
ingesta to be added. Here:
(Msa 3Tsa 3SHCsa) + (Msi 3Tsi 3SHCsi) =
(Msa 3Ts 3SHCsa) + (Msi 3Ts 3SHCsi) , (15)
where Tsis the temperature of the mixture.
It is pertinent to examine the applicability of this model to data derived from STAUs under controlled conditions so that the model can be used for predictive purposes. One of the consequences of the model, for example, is that K should not vary, irrespective of the amount of material already in the (13) 3V 3
K×4p×
M×SHC .
c =
!
4p2 (11) 3V 3
K (Ta−Ts) 4p
M×SHC ,
= 4p
dTs dt
!
2 (10) 3V 3K (Ta−Ts) 4p ,
= 4p dHtot dt
!
2 (9) 3V 3A = 4p .
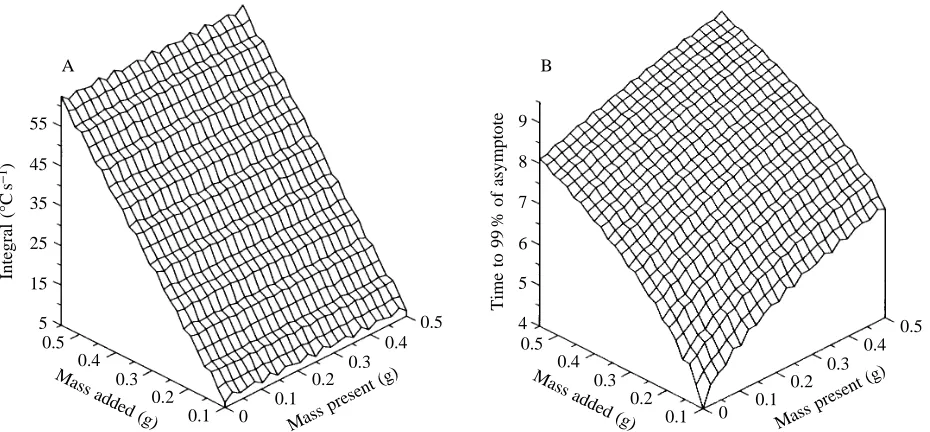
stomach and the amount added. This can be appropriately examined by using a balloon in a waterbath to which water is added in specific amounts allowing time for asymptotic values to be reached between additions. The STAU response to such an experiment is shown in Fig. 12. Insertion of values for the parameters described by the term c (i.e. V, m and SHC), and altering K so that the curve accords with one particular case (here 50 ml added to an empty balloon), leads to a very good fit for this initial case and remarkably good fits for subsequent water additions, even though K is maintained constant throughout (Fig. 12).
Methods used to determine masses ingested
Two methods have been proposed to determine the mass of food ingested by endotherms that feed on cold prey based on examination of the consequent changes in stomach temperature. The method of Gales and Renouf (1993) considers the mass ingested to be directly proportional to the length of time that the stomach temperature remains below the asymptote, while that proposed by Wilson et al. (1992a) is based on integrating the area under the asymptote (see above). The heat production (Wp) is given by:
Wp= M3SHC3DTs, (16)
so that:
The energy (Etot) necessary to warm the stomach contents:
= M×SHC×C0[e−c× ∞−e−c× 0] (21)
=−M×SHC×C0. (22)
Since
M =Κ ×Vtot, (23)
then:
Etot=−Κ ×Vtot×SHC×C0. (24)
V1and V2represent the volumes of water added to the stomach
and the water already present in the stomach, respectively, so that (V1+V2=Vtot). If T1represents the temperature of the water
added and T2that of the water already present then:
Etot=−Κ ×SHC×[V1T1+ (V2−Vtot)T0] (25)
=−Κ ×SHC×V1×(T1−Ta) . (26)
This solution does not allow for any element of the integral during the initial short temperature drop phase, which is here
taken to occur instantaneously, but demonstrates a linear relationship between INT and E irrespective of how much material is in the stomach before ingestion (Fig. 13A). This lends support to the integral method proposed by Wilson et al. (1992a).
In order to examine the length of time it takes for the stomach temperature to reach asymptotic values, it is necessary to specify when the asymptote is considered to be reached. If we consider that this occurs when 99 % of the difference between Tminand Ta is attained (although any value may be
used and the mathematics appropriately changed), then Ts>0.99Ta, so that:
C0e2ctù 20.01Ta, (27)
and when C0<0, then:
and
This solution is not linear and clearly demonstrates that the time taken for the temperature to reach a value approaching the asymptote is dependent on both the volume already in the stomach and the volume added. Greater volumes present in the stomach at asymptotic temperature will tend to increase the time taken for added material to reach an asymptote, so that the solution proposed by Gales and Renouf (1993) is not entirely appropriate (Fig. 13A).
(29) ln
t>− −0.001Ta C0
1
c .
(28)
−ct<ln −0.001Ta C0
(20)
⌠ ⌡
∞
0
M×SHC×Ts′(t) dt
=
(19)
⌠ ⌡
∞
0
−M×SHC×C0c e−ctdt
=
(18)
⌠ ⌡
∞
0
Wp(t) dt
Etot=
(17) Wp(t) = M×SHC×
dTs
dt .
Time (min)
0 30 60 90 120 150 180 210 240 270 39
40 41
38
37 36
35
34 33 32 31
30
[image:11.609.316.564.73.252.2]Temperature (°C)
Factors relevant to STAU usage
The physical characteristics of the STAU with respect to the species being studied determine the quality of the data collected. Furthermore, the methods by which the STAUs are calibrated and by which the data are analyzed also influence the quality of the data obtained. These points will be discussed below. However, in order to help potential users of STAUs, we here present three keys relevant to the choice of the STAU (Fig. 14), the calibration of the unit in situ (Fig. 15) and analysis of acquired results (Fig. 16).
Factors influencing the precision of mass ingested estimates A. Degree of mixing
1. Consistency of contents. More liquid stomach contents will be more readily mixed, which will tend to maintain a higher temperature gradient between stomach wall and stomach contents, thereby directly affecting K. That this is the case is illustrated by results presented by Wilson and Culik (1991), where they noted that the temperature in the abdominal cavity of Adélie penguins Pygoscelis adélie sank much lower in birds fed cold water than in birds fed cold krill. The available heat in the abdomen was presumably passed more rapidly to the liquid stomach contents than it could be generated. Although the more complete mixing found in liquid stomach contents increases K and tends to decrease the time that stomach temperatures remain below the asymptote, values of m may still be higher. This is because the initial temperature drop recorded by STAUs at prey ingestion is correspondingly higher, which contributes more to the values of INT than does the extended tail (of sub-asymptotic values) recorded by STAUs in poorly mixed stomach contents. The extremes in variability expected as a result of differences in stomach
content consistency are encompassed by the differences in the values of m for squid- and water-fed balloons in the waterbath (no movement). The values for m of 1.59 ˚C s J21for squid and
2.59 ˚C s J21 for water indicate that mass estimates could, in
such extreme cases, vary by a factor of 1.6. However, seabirds are unlikely to ingest large quantities of water over extended periods followed by large quantities of prey with no water, so this type of error will be minimal. Errors related to the stomach consistency are of particular relevance when choosing m-values for a species (see below).
2. Stomach peristalsis. Although the consistency of the stomach contents may theoretically play a large role in determining the rate of heat transfer between the animal and its stomach contents, the degree of stomach churning can, for the same reasons, alter the rate of heat transfer for stomach contents irrespective of their consistency. Increased stomach churning, simulated by still, shaken and kneaded balloons in waterbaths, generally resulted in decreased m-values. We found no information on gastric motility in seabirds, although preliminary studies have been conducted with some terrestrial birds species (e.g. Kuechle et al. 1987). However, it is likely that some seabirds show considerable variation in gastric motility. This arises because many species transport food to their chicks in their stomachs (e.g. Croxall, 1987), which means that normal digestion must be slowed or stopped, otherwise birds foraging at great distances from their breeding sites would arrive back at the nest with empty stomachs (Wilson et al. 1989). We have convincing evidence that delayed gastric emptying occurs in at least some species of penguins, since we continuously filmed a single Adélie penguin which was documented as still feeding its chicks 72 h after having last returned from foraging (R. P. Wilson, 45
55
35
25
15
5
Integral (°C
s
−
1)
0.5 0.4
0.3 0.2
0.1 0 0.1
0.2 0.3
0.4 0.5
Mass added (g)
Mass present (g)
8 9
7
6
5
4
Time to 99
% of asymptote
0.5 0.4
0.3 0.2
0.1 0 0.1
0.2 0.3
0.4 0.5
Mass added (g)
Mass present (g) B
A
[image:12.609.70.535.72.288.2]unpublished data). Accordingly, it has been suggested that some seabirds forage for themselves during the initial part of their foraging period, during which time they digest fast and gastric motility is presumably high, before later beginning to forage for their brood, when digestion must be slowed or stopped and gastric motility is low (Wilson et al. 1989). Activity patterns of African penguins support this idea (Wilson and Wilson, 1995) as do our STAU data obtained from free-living penguins. During the initial part of foraging trips, prey ingestion is always typified by single or multiple typical PDER events (Fig. 7A). However, immediately preceding the return to the nest to feed chicks, extended temperature drops are often observed where there is no typical exponential rise (Pütz, 1994) (Fig. 7A). This is unlikely to be due to ingestion of different prey and/or different rates of capture, resulting in different packing, because it is improbable that such conditions would consistently occur at the end of foraging trips and, in any event, examination of penguin stomach contents shows that no such difference in stomach packing occurs (R. P. Wilson, unpublished data). Rather, we suppose that the birds have radically reduced stomach churning, thus reducing K, while they continue to feed. Subsequent calculations of mass ingested based on m-values derived from birds with a high
degree of stomach churning can then result in a considerable overestimate (see Pütz and Bost, 1994). The extent of this overestimation can be examined by looking at differences in m-values in waterbath experiments with balloons exposed to different degrees of movement. Here, our extreme m-values of 5.5 ˚C s J21for motionless and 1.7 ˚C s J21for kneaded balloon
[image:13.609.96.525.99.429.2]after prey ingestion (Fig. 8) as well as for the sharp temperature drops observed in king penguins immediately after the cessation of diving (Fig. 5). In the absence of information regarding the activity of the animal, such false ingestion events should be suspected when the overall tendency is for the stomach temperature to rise.
3. Ingestion of water. Temperature decreases also occur in the stomach when seabirds ingest water, and the resultant PDER events are similar to those obtained when prey are ingested, although some differences are usually discernible. These stem from the excellent mixing properties of water compared with those of prey. Thus, PDER events due to water ingestion tend to show a relatively greater precipitous temperature drop followed by a smooth, and relatively rapid, exponential rise than those due to prey ingestion. Water ingestion often occurs when seabirds first set out to forage (e.g. Fig. 7A), but it is unlikely that seabirds ingest much water during foraging (e.g. Gabrielsen and Mehlum, 1987; Birt-Friesen et al. 1989) since they are capable of deriving most of the water they need from their prey and because the energetic cost of heating ingested water to body temperature is particularly high as a result of the extremely high specific heat capacity of water (Wilson and Culik, 1991).
B. Probability of contact between STAU and ingested food 1. Stomach size in relation to STAU size. The likelihood that temperature changes occurring in the stomach as a result of food ingestion will be detected by the STAUs depends on the volume of stomach affected by the change and the size of the sensory area of the STAU relative to the volume of the stomach. Furthermore, even in those cases where prey ingestion is detected, calculation of the mass ingested is affected by these variables. This is demonstrated both by the experiments in the waterbath and by the results derived from captive cormorants. For example, small STAUs (as STAUsink
units), representing 2 % of the maximum stomach volume of a great cormorant, which has a maximum volume of 750 cm3
[image:14.609.43.564.103.415.2]waterbath experiments (Fig. 11). Here, however, we were able to show that relatively larger STAUs (constituting 12 % of the maximum stomach volume compared with 1 %) were more sensitive to prey ingestion, detecting more ingestion events and having higher m-values (by a factor of almost 8) (Fig. 11). Furthermore, use of the relatively larger STAUs led to no systematic change in m-value as the balloon was filled. Thus, researchers working with STAUsink units that are relatively
small compared with the stomach volume of the animal in question must be aware that prey items ingested on an empty stomach are likely to be easily detected but that subsequent prey ingestion is likely to be less readily detected, if at all, and calculated masses are likely to be underestimated. If we ignore the effects of the device on the animal, on the basis of our experience with waterbaths, we would suggest that researchers using STAUsinkunits should design them to have a volume of
approximately 10 % of the maximum size of the animal’s stomach. Otherwise, newer units could be designed with a number of temperature sensors protruding from a smaller STAU. Ideally, the sensors should be orientated so that each measures temperature in a unique sector. In this way, a larger volume of the stomach could be sampled without incurring potential device-induced effects from large units.
2. The position of STAUs in the stomach. The problems incurred by having a reduced sensory surface in a large stomach volume can be partially circumvented by constructing STAUs that maintain their position close to the point where the stomach meets the oesophagus so that newly ingested food comes into direct contact with the sensor. In the waterbath experiments, we examined the feasibility of this by using STAUs with variable density and found that STAUsink
units constituting 1 % of maximum balloon volume detected only half the incidents of prey ingestion, whereas STAUfloat
units of identical volume detected all prey ingestion events. m-values of STAUfloatunits were accordingly approximately
three times higher than those of STAUsinkunits. Thus, where
animals that have a tendency to maintain a particular body orientation are being studied, units can be built so that they remain close to the oesophageal opening. For example, albatrosses equipped with STAUfloat units should record
ingestion events better than those with STAUsink units. The
situation becomes more complex with diving species, such as seals and penguins, where body orientation changes substantially during the descent and ascent phases of the dive. Here, construction of STAUs with a density substantially different from that of the stomach contents may result in the unit moving from the top to the bottom of the stomach and vice versa as a function of dive or return-to-surface angle. Waterbath experiments indicate that the last ingested prey, and thus the coldest material, has a tendency to remain in the upper stomach strata (Fig. 11) and stratification in stomach contents (R. P. Wilson, unpublished data) indicates that this is likely to be the case even in diving animals, where changes in body orientation might be expected to produce some mixing. Thus, moving STAUs may record temperature drops when the animals dive, followed by rises when it surfaces,
which have nothing to do with actual prey ingestion at that time.
C. Heat transfer
1. Heat transfer as a function of activity. Several authors have recently shown that the body temperature of seabirds is highly variable, being particularly dependent on activity (e.g. Wilson et al. 1992a, 1993; Grémillet and Plös, 1994). For example, body temperature, as measured by STAUs, in swimming African penguins is approximately 2 ˚C higher than when the birds are resting (Wilson et al. 1993). The supposition that the rate of heat transfer between bird and stomach contents is dependent on Ts2Ta (see above) is supported by waterbath
experiments where a difference of 1 ˚C in asymptotic temperatures led to a change in the m-value of 10 %, all other conditions being constant. Thus, m-values derived from calibrations performed on animals with low body temperatures might not be directly applicable to those same animals when feeding if, when so doing, they are highly active. However, calibrations of this type performed on wild animals invariably lead to stress, which also raises body temperature, in penguins at least, by some 2 ˚C (R. P. Wilson, unpublished data) so that ingesta-warming conditions might be considered comparable. Problems are more likely to occur in species, such as herons (Ardeidae), where prey capture takes place during periods of inactivity. Assuming that these birds show similar temperature changes in response to stress to those of penguins, utilization of m-values derived from stressed wild birds will lead to an overestimation of prey masses ingested in the wild by approximately 20 %.
2. Blood flow and insulation. There is little information on the extent to which seabirds may be able to vary blood flow around the stomach as a function of activity (e.g. diving) or stress. Reduction in blood flow will lead to a reduction in K, which will tend to increase m-values. Our waterbath experiments indicated that an increase in insulation by a factor of approximately 3 led to an increase in m-values by a factor of 2. This obviously has consequences for the determination of masses ingested but, until more is known about blood flow variability around the stomach, especially in relation to activity, stress etc., it is difficult to assess what corrective measures can be taken.
D. Determination of m-values for free-living animals
Several methods have been proposed to calculate m-values, which can then be used to determine the masses ingested by free-living animals. These are (1) direct feeding of study animals with prey, while monitoring stomach temperature with a STAU (e.g. Grémillet and Plös, 1994), (2) feeding the study animals with water while monitoring stomach temperature with a STAU (e.g. Pütz and Bost, 1994) and (3) consideration of the change in temperature in the STAU when first given to the animal after calculation of the effective specific heat capacity of the device (e.g. Wilson et al. 1992a).
methods to the animal (but see Grémillet and Plös, 1994) and provides the least informative data unless the experiment can be repeated often enough for the data set to be large. This arises as a result of the relatively poor relationship between INT and E in individual cases. Although this relationship ultimately determines the accuracy of mass estimations from individual ingestion events in free-living animals, if such errors are incurred as the basis for the calibrations, then all subsequent individual ingestion events occurring in the wild will be accordingly biased.
2. Calibrations performed with water. Calibrations performed with water are relatively easy to conduct because exact quantities can be passed through a plastic tube into the stomach. Furthermore, since the regression between INT and E is so good, as a result of excellent mixing, this process need not be repeated many times. However, this very mixing means that m-values derived from such calibrations are not directly applicable to m-values derived from normal prey ingestion. Waterbath simulations can be used to correct for this such that the ratio of m-values from water- and prey-filled balloons is used to scale appropriately the integrals derived from prey ingested. This assumes that the prey ingested in the waterbath simulations has the same consistency as that ingested by the animal in the wild, and this should be taken into account. One important difference, however, between water calibrations performed on animals and on balloons in waterbaths is that, in animals, the water may be passed into the small intestine before being heated to asymptotic temperatures, whereas in balloons this cannot happen. The extent to which this occurs is apparent in m-values from penguins intubated with differing amounts of water (Table 4). Here, king penguins, for example, intubated with 500 ml of water had m-values approximately half of those of birds intubated with 100 ml. Overall, m-values appear to change most rapidly when small amounts of water are intubated. The problem of water being moved into the intestine before reaching asymptotic temperatures can be addressed by plotting INT values against water volumes given to all animals from the study species where water at a specific temperature has been intubated. The rate of change of INT versus volume V can then be determined at V=0 from the resultant curve. This can then be used to calculate an m-value that should be comparable to that obtained in a waterbath.
3. Calibrations using the warming of the STAU. Comparison of the INT of the STAU with its apparent E is certainly the easiest to perform in the field, since all animals must swallow the devices. In addition, there is no danger of the units being voided into the intestine. Integrals derived from STAUs must, however, either be compared to assimilated prey calculated using TRIM or must themselves be corrected for differences in TRIM and INT values, because there is no temperature drop in the STAU when it is first placed in the animal. In addition, it is advisable to ensure that STAU temperatures be fully stable before giving them to the animals. This can be achieved by placing the unit for some time in a thermos flask containing water. The apparent E of the STAU is derived from its apparent SHC and must be carefully calculated. This can be done by
putting a cold STAU, which is actively logging, in a thermos flask filled with a known volume of water at a known, and higher, temperature. After introduction of the STAU, and after allowing time for the temperature of the water to equilibrate, the new temperature of the water can be measured. The apparent SHC of the STAU can then be calculated using:
SHCstau = (Mwater 3T3 3SHCwater)/(T3 3Mstau) , (30)
where Mwater is the mass of the water and Mstau that of the
STAU, T3is the final temperature of the mixture and SHCwater
is the specific heat capacity of water.
The relationship between the TRIM value and E, calculated using values for SHCstau and Mstau and the difference in
temperature between the STAU at the moment when it is fed to the animal and the asymptotic temperature, can be used to calculate an m-value that can then be used in calculations of masses of food ingested by free-living animals.
E. Determination of SHC values for prey species
An important element in the calculation of E is the SHC of the prey items. This can be calculated using the procedure outlined above, together with equation 30, for determining the SHC of the STAU, except that prey species are substituted instead of STAUs. Pütz (1994) gives SHC values for three prey species (Pleuragramma antarcticum, Bathydraco marri and Loligo opalescens) that lie between 3.86 and 4.04 J g21˚C21.
Since most prey species are themselves composed principally of water, values are expected to be somewhat less than that of water (4.17 J g21˚C21).
F. Determination of INT values from free-living animals 1. Comparison of TRIM and INTs. Under normal circumstances, temperature drops incurred as a result of prey ingestion are precipitous so that TRIM and INTs are almost identical. However, some species have a tendency to show staggered temperature drops, which can lead to differences in INT and TRIM values of as much as 35 %. Data from Grémillet and Plös (1994) indicate that, where this is the case, integrals from free-living birds may be marginally more accurate if TRIM is used (t=1.88, 0.1>P>0.05), although more work is needed to confirm this. One direct advantage of using TRIM is that calibrations to determine m-values made by using STAUs themselves (see above) can be used directly to calculate the mass of food ingested without a correction factor for differences between TRIM and INTs.
the post-ingestive asymptote (Fig. 17A). This is also the case where the situation is reversed so that pre-ingestion body temperature is high and temperature is lowered at the moment of ingestion (Fig. 17B). If, however, the change in body temperature occurs close to the point where stomach temperature approaches the pre-ingestion body temperature (Fig. 17C,D), the integral should be calculated to run to this point. In practice, it is difficult to ascertain at which point the change in body temperature might have occurred. Such a process would involve fitting a curve to the warming phase and determining the point of inflection. We suggest that the most realistic approach is to assume that the change in body temperature occurs at approximately the mid-point of the warming phase. Thus, the appropriate integral can be calculated by adding the integral whose maximum occurs at whichever temperature is lower, that of the pre- or post-ingestion body temperature, to half the value of the difference between this integral and the integral derived using the maximum of whichever temperature is highest of the pre- and post-ingestion temperatures (Fig. 17E,F).
3. Integrals determined for rapid multiple prey ingestion. Rapid multiple prey ingestion may lead to multiple PDER events where asymptotes are not reached before new temperature drops occur (e.g. Fig. 4). In such cases, there is no clear way to determine the mass of individual prey items and the best approach is to calculate the whole integral for all
temperatures under the asymptote and to attribute this to the number of prey items swallowed, as indicated by the number of temperature drops (Fig. 18A). Any realistic attempt to determine the masses of the prey thus ingested must take into account the effective form of the warming curves of all prey items swallowed (Fig. 18B), which is difficult to assess. In the simple case of two prey items being swallowed in quick succession, an underestimate of the mass of the first prey item (and thus minimum prey size) can be calculated by integrating after the first temperature drop up until the second temperature drop (Fig. 18C). On a short-term basis, the extent of the temperature drop incurred for each of the prey items can also be used to approximate the mass of each prey item ingested (Fig. 18D). Here, the mass of all prey items together should first be determined by calculating the total integral. Subsequently, this value is divided by the sum of all temperature drops to give a measure of mass per degree temperature drop. Individual temperature drops corresponding to particular prey items can then be approximated by multiplying the appropriate temperature drop by this value. Application of this approximation is subject to a number of errors, the most important of which is the fact that the extent of temperature drops incurred in the stomach at prey ingestion is dependent on the amount of food already present (see above). However, if the application can be contained to short periods where relatively few prey items are ingested, such errors may be acceptable.
4. Spurious temperature drops. Determination of the number and mass of prey and the timing of ingestion is critically dependent on being able to assign temperature drops correctly to prey ingestion. In the case of birds such as wandering albatrosses, this is not difficult because PDER events are clear (Figs 2, 3), with temperature drops sometimes exceeding 10 ˚C min21. However, PDER events are not always so clear
cut. STAUs in king penguins, for example, record temperature drops when the birds are not diving and which probably arise as a result of gastric churning (Fig. 5). In general, problems of this nature are most likely to occur when the STAU is very much smaller than the stomach. Similarly, king penguins that have recently fed may also record temperature drops every time they dive (Fig. 5). Our attempts to simulate changes in body orientation in king penguins so as to examine the effects that this might have on STAU position within the stomach, and thus on measured temperature, were discontinued because the procedure stressed the birds. Nevertheless, X-ray pictures of birds that had been standing showed that STAUsinkunits
were located at the base of the stomach (Fig. 19). In view of the poor sensitivity of the small STAUsinkunits in such large
stomachs, it is unlikely that temperature drops that occur consistently when birds dive are directly due to prey ingestion (see Pütz and Bost, 1994). Rather, continued prey ingestion will tend to lead to a layer of colder ingesta in the upper part of the stomach (see Fig. 11). STAUs that are considerably more dense than the stomach contents are likely to move towards the stomach entrance during the descent phase of the dive, returning to the base of the stomach as the bird re-B
C D
E F
A
Temperature
Time
y
y
x x
[image:18.609.55.266.71.297.2]INT=(x/2)+y INT=(x/2)+y
ascends and, in so doing, moving through the various food strata with their differing temperatures. In such cases, the ingestion of individual small prey items cannot be resolved. However, in the case of supposed stomach churning and in the case of diving birds, the degree to which prey are actually ingested can be partially resolved by examining the rate of changes of temperature over longer periods. Here, generally decreasing temperatures would indicate continued prey ingestion even if precipitous temperature drops indicate diving activity, or stomach churning, rather than the precise timing of prey ingestion.
Latency in temperature drops can also occur as a result of poor stomach mixing where warmed ingesta cover the STAU, thus effectively insulating it against contact with recently ingested food (Fig. 6). The degree to which this occurs depends essentially on the size and position of the STAU in the stomach, with large, less-dense units being less susceptible to such errors.
In conclusion, STAUs appear to give relevant information on the feeding activity of seabirds and are likely to prove useful in studies on marine endotherms in general. Large temperature drops are always indicative of ingestion, although the reliability of the time of ingestion and mass ingested estimates is critically dependent on a number of factors, some dictated by the animals (e.g. degree of stomach churning, body temperature) and some by the form of the STAU (e.g. buoyancy, size). Animal-induced errors can often be assessed by critically examining the form of the data; generally, where PDER events are clear cut, the quality of the data obtained is good. Care must be used in interpretation of data that depart from this pattern.
Relatively larger STAUs (in relation to the size of the study animal’s stomach) are more sensitive to prey ingestion and mass-based calculations are correspondingly improved, although as devices increase in size so unwanted device-induced anomalies in animal behaviour are likely to occur. In
Temperature
B
C D
A
Time T1
[image:19.609.59.565.76.428.2]T2