1643
Use Trends and Geographic Variation in Neuroimaging:
Nationwide Medicare Data for 1993 and 1998
Vijay M. Rao, Laurence Parker, David C. Levin, Jonathan Sunshine, and Gerald Bushee
BACKGROUND AND PURPOSE: Powerful tools, including CT and MR imaging, have
rev-olutionized neuroimaging. These are routinely used, but the extent and variation of use has not been studied. Our purposes were to determine the use rates of MR imaging and CT (of spine, brain, or head and neck), myelography, conventional angiography, and MR angiography in diagnosing neurologic disorders; to study trends in use; and to determine regional variations in use.
METHODS: We used the National Part B Medicare Database for 1993 and 1998 to compare
rates of use for these procedures in 10 geographic regions.
RESULTS: In 1993 and 1998, respectively, 13,897 and 19,431 (39.8% increase) neuroimaging
procedures were performed per 100,000 Medicare beneficiaries nationwide. Use of brain or head and neck CT (30.4%) and MR imaging (43.6%), spinal CT (3.5%) and MR imaging (83.0%), myelography (56.6%), and conventional angiography (24.3%) increased in 1998 ver-sus 1993. Increases in MR angiography were not assessed, because this procedure was not reimbursable in 1993. Regional use of brain or head and neck and spinal CT and MR studies varied considerably; ratios of highest and lowest rates were 1.38–1.56. Use of MR angiography, myelography, and conventional angiography varied three- to fourfold.
CONCLUSION: Use of MR and CT studies of the brain or head and neck and of the spine
increased considerably in the Medicare population between 1993 and 1998. Use of conventional invasive procedures such as myelography and angiography increased strikingly, contrary to the expected decline. Regional use varied substantially.
The costs of health care in the United States con-tinue to escalate at an alarming pace. Researchers have described several factors, including patient so-ciodemographics, disease severity, provider spe-cialty training, and the method of physician pay-ment, that contribute to these high costs. More recently, the increasing use of newer, high-technol-ogy imaging techniques, such as CT and MR im-aging, has been placed at the forefront of factors contributing to increasing health care costs. To ad-dress these issues meaningfully, the extent of use of such expensive, high-technology imaging
stud-Received February 12, 2001; accepted after revision April 3. From the Department of Radiology (V.M.R., L.P., D.C.L.), Thomas Jefferson University Hospital, Philadelphia, PA; and the American College of Radiology (J.S., G.B.), Reston, VA. Presented at the 37th Annual Meeting of the American So-ciety of Neuroradiology, the American SoSo-ciety of Head and Neck Radiology, the American Society of Pediatric Neurora-diology, and American Society of Interventional and Thera-peutic Neuroradiology, and the American Society of Spine Ra-diology, San Diego, CA.
Address reprint requests to Vijay M. Rao, MD, Department of Radiology, Thomas Jefferson University Hospital, 132 S. 10th Street, 1072 Main Building, Philadelphia, PA 19107.
qAmerican Society of Neuroradiology
ies must be determined. We undertook this study to ascertain the current rates of use for MR imag-ing, CT, myelography, and conventional angiogra-phy in the diagnosis of neurologic disorders; to de-termine trends in use patterns by comparing the use rates of neuroimaging procedures performed in 1993 and 1998 in the Medicare population; and to investigate geographic variation in use of these neuroimaging procedures.
Methods
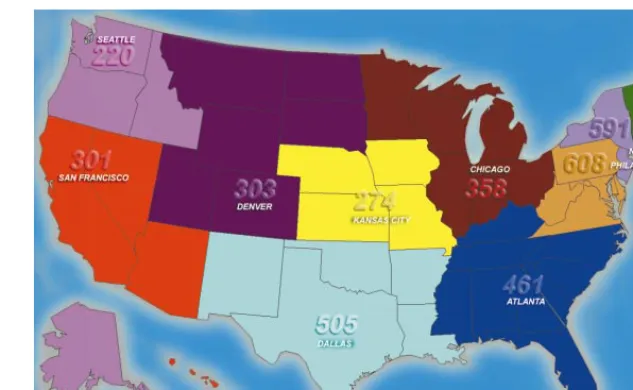
FIG 1. Map of the United States depicts the 10 HCFA regions. The use rate of MR angiography per 100,000 Medicare bene-ficiaries is shown in each region.
TABLE 1: CPT-4 codes
Procedure CPT-4 Code
CT, brain or head and neck
CT, spine MR imaging, spine
MR imaging, brain or head and neck
MR angiography, head and neck
Myelography Angiography, cerebral
70450, 70460, 70470, 70480–70482, 70486–70492
72125–72133
72141, 72142, 72146–72149, 72156– 72158
70540, 70551–70553
70541 62284
75660, 75662, 75665, 75671, 75676, 75680, 75685
For the purpose of this study, we determined the number and type of neuroimaging studies performed by analyzing the Current Procedural Terminology (CPT-4) codes contained in the billing claims filed by physicians (1, 2). We reviewed all CPT-4 codes that represented CT and MR imaging of the brain, head and neck, and spine (Table 1). Claims were grouped into the following categories: 1) CT of the brain or head and neck (12 codes), 2) CT of the spine (nine codes), 3) MR imaging of the brain or head and neck (five codes), and 4) MR imaging of the spine (nine codes). We also reviewed CPT-4 codes for MR angiography (one code) and the supervision and interpre-tation components of conventional angiography (seven codes). For each category, we determined the total number of proce-dures performed in 1993 and 1998.
We used the HCFA region codes for the geographic analysis. Ten region codes are named for the city in which the HCFA regional office is located, as follows: Boston, New York, Phil-adelphia, Atlanta, Chicago, Dallas, Kansas City (Missouri), Denver, San Francisco, and Seattle. These 10 regions include all 50 states and the territories of the United States. The Figure shows the states in each of these regions. One additional code, ‘‘Traveler’s Railroad,’’ which identifies Medicare recipients by miscellaneous categories (eg, railroad workers) rather than by geographic location, was excluded from the analysis of geo-graphic data.
Use rates per 100,000 beneficiaries were calculated for the total and regional beneficiary populations for each year by di-viding the procedure frequency in each record by the total and regional beneficiary counts for the appropriate year and mul-tiplying by 100,000. Because our study represents a complete
count of the Medicare fee-for-service population, it may be argued that any difference in rates represents a true difference between populations. One also could consider Medicare ben-eficiaries as a subpopulation and compute traditional variability statistics. To determine whether regional variation was the re-sult of chance factors, we calculated 99% confidence intervals for the rates.
SAS version 6.12 for Windows was used to combine the datasets for each year, and tables were constructed by using PROC TABULATE to sum frequencies and calculate percent-ages for the categories of interest (3).
Results
In 1993, 13,897 neuroimaging procedures per 100,000 beneficiaries were performed in the Medi-care population nationwide. In 1998, 19,431 neu-roimaging procedures per 100,000 beneficiaries were performed nationwide in Medicare patients. This change represents a 39.8% increase in the use rate of all neuroimaging procedures in the Medicare population in 1998 compared with 1993 (Table 2).
CT Use
The use rate of brain or head and neck CT per 100,000 Medicare beneficiaries was 8192 proce-dures in 1993 compared with 10,679 proceproce-dures in 1998; this change represented an increase of 30.4%. The use rate per 100,000 of spine CT was 1094 procedures in 1993 compared with 1132 pro-cedures in 1998; this change represented a modest increase of only 3.5%.
MR Imaging Use
[image:2.612.47.276.293.433.2]TABLE 2: Use rates of neuroimaging procedures per 100,000 fee-for-service Medicare beneficiaries
Procedure 1993 1998 Increase (%)
CT, brain or head and neck MR imaging, brain or head and neck CT, spine
MR imaging, spine Myelography Angiography MR angiography Total
8192 2072 1094 1598 265 676 NA 13,897
10,679 2976 1132 2924 415 840 465 19,431
30.4 43.6 3.5 83.0 56.6 24.3 NA 39.8
Note.—NA indicates not applicable.
Myelography and Angiography Use
The use rate per 100,000 Medicare population of myelography was 265 in 1993 compared with 415 procedures in 1998; this change represented an in-crease of 56.6%. The use rate per 100,000 popu-lation of conventional angiography increased by 24.3%, from 676 procedures in 1993 to 840 pro-cedures in 1998.
Geographic Variation in Use
Geographic variation in the use of neuroimaging procedures is shown in Table 3. The national av-erage rate of use of CT of the brain or head and neck in 1998 was 10,679 studies per 100,000 Medi-care beneficiaries; the rate ranged from a high of 11,953 in Atlanta to a low of 7903 in Seattle. The national average use rate of CT of the spine in 1998 was 1132 studies per 100,000, ranging from a high of 1360 in Dallas to a low of 874 in San Francisco. Regional variation in MR studies of the brain or head and neck and spine also was considerable. The national average use rate of MR imaging of the brain or head and neck in 1998 was 2976 stud-ies per 100,000 Medicare beneficiarstud-ies; the use rate ranged from a high of 3317 in San Francisco to a low of 2273 in Seattle. The national average use rate of MR imaging of the spine was 2924 studies in 1998 per 100,000 population; the rate ranged from a high of 3349 in Atlanta to a low of 2501 in Kansas City.
The regional variation in use of MR angiogra-phy, myelograangiogra-phy, and conventional angiography was much greater. The national average use of MR angiography in 1998 was 465 studies per 100,000, ranging from a high of 608 in Philadelphia to a low of 220 in Seattle. This difference represents an al-most threefold variation. The national average use for myelography in 1998 per 100,000 was 415, ranging from a high of 591 in San Francisco to a low of 147 in New York. This difference represents a fourfold variation. The national average use of conventional angiography in 1998 per 100,000 was 840; the rate ranged from a high of 1183 in Dallas to a low of 291 in Boston—again, a fourfold variation.
Does the geographic variation in our study rep-resent real differences in rates of use, or is it merely
random variation? This type of question arises fre-quently within the field of statistical quality control. ‘‘Shewart 3s’’ control limits—3 SD confidence bands—often are used in this field to describe the range of chance variation (3). The 3s confidence intervals for the rates we reported are very small. The 3sconfidence intervals for highest and lowest regions for each procedure listed in Table 4 did not overlap; this finding indicated that the differences were real rather than chance variations.
Discussion
Diagnostic workup of patients with neurologic disorders has been revolutionized during the past 2 decades, with vast advances in technology. CT, MR imaging, and MR angiography have been rapidly assimilated into routine clinical practice. The lit-erature is replete with descriptions of continual technologic improvements leading to faster imag-ing times, improved resolution, and new applica-tions for diagnosis as well as treatment. Despite these developments, little is known about the use patterns of these high-technology, noninvasive di-agnostic procedures or about their effect on the use of more conventional procedures such as myelog-raphy and angiogmyelog-raphy.
Our data reveal a sharp increase (39.8%) in the use of imaging procedures for the diagnosis of neu-rologic disorders in the Medicare population na-tionwide between 1993 and 1998. Review of the literature reveals that the vast majority of the neu-roimaging studies is performed by radiologists (4– 6) and therefore are not self-referred.
TABLE
3:
1998
use
rates
of
neuroimaging
procedures
per
100,000
fee-for-service
Medicare
beneficiaries
in
the
10
HCFA
regions
Region
CT
,
Brain
or
Head
and
Neck
MR
Imaging,
Brain
or
Head
and
Neck
CT
,
Spine
MR
Imaging, Spine
Myelography
Angiography
MR
Angiography
T
otal
Boston New
Y
ork
Philadelphia Atlanta Chicago Dallas Kansas
City
Denver San
Francisco
Seattle All
regions
(nationwide)
9826 9992
11,572 11,953 10,581 10,438 9538 7920 8845 7903 10,679 2573 2697 3166 3282 2560 3216 2539 2707 3317 2273 2976 988 1065 956 1262 1073 1360 1278 969 874 991 1132 2571 2423 2915 3349 2440 3322 2501 3072 3058 3039 2924 207 147 253 664 305 560 331 253 591 414 415 291 350 731 1155 916 1183 895 648 597 443 840 391 591 608 461 458 505 274 303 301 220 465 16,848 17,266 20,200 22,127 18,334 20,585 17,357 15,873 17,584 15,284 19,432
Note.—Raw
totals
may
differ
slightly
from
sum
of
components
because
of
rounding
of
components.
powerful gradients, that allow perfusion and dif-fusion imaging for patients with suspected stroke, among other new applications. MR spectroscopy has provided an entirely new dimension in the are-na of biologic imaging. It could be argued that such advances have provided new, useful information, but they have not led to additional examinations. There has been a tremendous surge in open-magnet imagers, which facilitate the MR examination of patients who are claustrophobic or large. Third, knowledge about the expanded capabilities of CT and MR systems in the study of neurologic disor-ders has progressively diffused throughout the medical community. Fourth, the increasing longev-ity of the Medicare population may have contrib-uted to the increased use of imaging studies. In the acute-care setting after therapeutic interventions, patients in neurointensive care units now are mon-itored more frequently and aggressively with CT and MR imaging. Fifth, patient expectations may have caused the use of imaging procedures to escalate.
Growth of spine MR imaging was rapid (83.0%) compared with a relatively slow growth in spinal CT (3.5%). This finding is not surprising, because the vast majority of spinal imaging examinations in the Medicare population are performed to assess back pain, and MR provides more comprehensive information about disk disease and degenerative changes than does CT. On the other hand, MR im-aging of the spine did not appear to be a substitute for myelography, because the use rate of myelog-raphy increased by 56.6%. The increase in the use of myelography is puzzling because anecdotal claims by several neuroradiologists, including those in our own practice, indicate a substantial decrease in the use of myelography. Perhaps the code for myelography is being used in error or for some other procedure; this possibility needs further investigation.
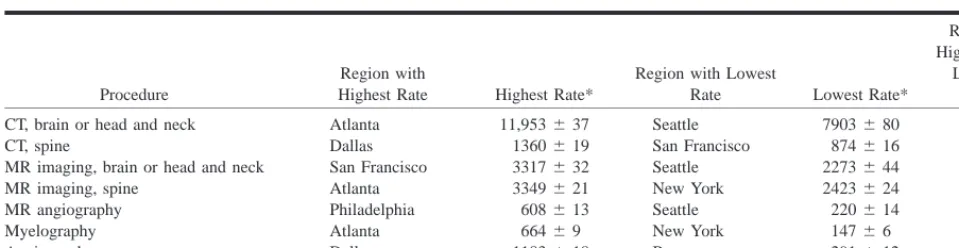
[image:4.612.89.240.41.748.2]TABLE 4: 99% confidence intervals for HCFA regions with the highest and lowest use rates per 100,000 fee-for-service Medicare benefi-ciaries for each neuroimaging category
Procedure
Region with
Highest Rate Highest Rate*
Region with Lowest
Rate Lowest Rate*
Ratio of Highest and
Lowest Rates
CT, brain or head and neck CT, spine
MR imaging, brain or head and neck MR imaging, spine
MR angiography Myelography Angiography
Atlanta Dallas San Francisco Atlanta Philadelphia Atlanta Dallas
11,953637 1360619 3317632 3349621 608613 66469 1183618
Seattle San Francisco Seattle New York Seattle New York Boston
7903680 874616 2273644 2423624 220614 14766 291612
1.51 1.56 1.46 1.38 2.76 4.52 4.07
* Data are the regional use rates699% confidence interval.
Thus, we could not determine the percentage of patients who underwent both MR angiography and conventional angiography. Fourth, and perhaps the most important factor, may be the publication of the North American Symptomatic Carotid Endar-terectomy Trial (NASCET) and the European Ca-rotid Surgery Trial in 1991, which demonstrated the benefit of carotid endarterectomy in symptom-atic patients with high-grade carotid stenosis (70– 99% stenosis). NASCET reported a stenosis-depen-dent effect for the degree of carotid stenosis, as defined at arteriography, and the degree of risk duction after carotid endarterectomy (7, 8). The re-sults of the Asymptomatic Carotid Atherosclerosis Study also lead to a substantial increase in the num-ber of carotid endarterectomy procedures (9). The increase in conventional angiography may have paralleled the increase in carotid endarterectomy. Noninvasive tests, such as MR angiography and duplex sonography, now are increasingly used to measure carotid stenosis, but the debate about the criterion standard in imaging of carotid stenosis continues (8).
Although geographic variation in the use of a variety of healthcare services has been widely doc-umented, these studies have largely focused on the use of medical and surgical procedures, hospital costs, and resource consumption (10–18). Farrow et al (19) reported marked variation in the use of breast-conserving surgery for localized breast can-cer; this variation was not explained by demo-graphic factors. Nattinger et al (20) described sim-ilar variations in breast-conserving surgical procedures that were not explained by differences in hospital characteristics.
Several investigators (11, 21) have reported geo-graphic variations in population-based rates of in-vasive cardiac procedures, including coronary an-giography, coronary artery bypass grafting, and percutaneous coronary interventions. Lucas et al (22) reported substantial variation in the use of echocardiography in the Medicare population. They proposed that the geographic variation seen in their study reflects a lack of consensus about how and in whom echocardiography should be used. In northern New England, Wennberg et al (23)
re-ported a geographic 3.5-fold variation in the pop-ulation-based rate of imaging stress tests and a fourfold variation in the rate of nonimaging stress tests.
Research regarding geographic variation in the use of diagnostic neuroimaging procedures is scare. Our study revealed considerable geographic varia-tions in use. The overall rate of neuroimaging pro-cedures in the Medicare population was the highest in the Atlanta region, where it was 1.5 times higher than the rate in the Seattle region, which ranked the lowest nationally. The Dallas and Philadelphia regions ranked second and third.
Our data show that geographic variation in the rates of use of MR imaging of the brain or head and neck and of the spine was considerable; the high rate–to–low rate ratios were 1.46 and 1.38, respectively. The regional variation in the use of CT of the brain or head and neck and of the spine was more pronounced; the high rate–to–low rate ratios were 1.51 and 1.56, respectively. The San Francisco region ranked the highest in MR imaging of the brain or head and neck, but it was near the lower end for CT studies of the brain or head and neck. On the other hand, the Atlanta and Philadel-phia regions had high use of both MR imaging and CT of brain or head and neck but low use of MR angiography and myelography. The San Francisco, Seattle, and Denver regions had high use of spinal MR imaging but ranked low for the use of spinal CT. On the other hand, the Atlanta and Dallas re-gions had high use of both MR imaging and CT of the spine. No consistent pattern in the use of im-aging procedures was observed, unlike the pattern of trends described in the literature for hospitaliza-tion. Ashton et al (24) showed that regions with high rates of admission for one condition tended to have high rates for other conditions, and areas with low overall rates tended to have low rates for each of the eight categories of disease.
proce-dures, namely myelography and conventional angiography. The Atlanta and Dallas regions ranked the highest in catheter angiography use, while the Atlanta, San Francisco, and Dallas re-gions had the three highest rates in the use of myelography.
Broad geographic variation may reflect the ease of availability of the newer imaging techniques, al-though this possibility would not explain the great variation in the use of conventional angiography and myelography. Variation may be influenced by the concentration of teaching hospitals in large metropolitan areas. It also may indicate uncertainty about the best diagnostic study for a given clinical indication, and therefore, it may be influenced by the biases of the physician who orders the diag-nostic test. Freeborn et al (25) performed a con-trolled intervention, using clinical practice guide-lines and feedback to reduce variability in primary-care physician use of procedures for im-aging of the lumbar spine. Automated radiology-use data were radiology-used to compare changes in radiology-use rates and variability in intervention and control physi-cian groups over the course of the study. Even when physicians were provided with practice guidelines and feedback about their practice pat-terns, the practice patterns were not influenced.
Ashton et al (24) reported significant geographic variations in the rates of hospitalization for groups of patients with chronic medical conditions in the Veterans Administration health-care system. This study was characterized by a lack of any influence of self-serving financial incentives, because Veter-ans Administration physiciVeter-ans are salaried and do not gain financially if they hospitalize more pa-tients. Ashton et al argued that such variations like-ly reflect regional differences in physicians’ prac-tice patterns. The use of diagnostic imaging procedures for a suspected medical condition also may be influenced by the referring physicians’ practice patterns. Features of the practice setting and patient expectations and behavior also may be contributing factors. For example, investigators in a multicenter study used data from National Low Back Pain study in an attempt to relate patient char-acteristics to the use of particular diagnostic im-aging examination in patients with persistent low back pain. Nonclinical factors, such as higher an-nual household income, disability compensation, and male sex were associated with increased use of MR imaging compared with conventional radiog-raphy and CT myelogradiog-raphy (26).
Our study has several limitations. First, the Medicare database provides complete nationwide information for fewer than 25% of all patients in the United States. The younger population, as well as managed-care Medicare patients, are excluded. This database does provide complete coverage for fee-for-service Medicare beneficiaries; however, this is a substantial segment of the population who have health care to a greater extent. It provides an accurate representation of trends and regional
var-iation in use within this group, and these findings likely can be extrapolated to the population at large. Second, the datasets used were summary da-tasets with no information on the diagnoses under-lying the claims. Therefore, it was impossible to compare changes or regional variation in use for different diagnostic groups. Third, we had no de-mographic information or comorbidity information for the patients. We could not adjust for demo-graphic or case-mix variation among regions. We also could not assess whether differences in the mean age of the Medicare population in the various HCFA regions could explain the large variation in use of neuroimaging. Fourth, although the literature indicates that healthcare use is related to the re-sources available, these datasets do not contain in-formation about the number of CT and MR imag-ing facilities available. In fact, we know of no national database that contains this information.
Conclusion
Our study revealed a considerable increase in the use of MR and CT studies of the brain or head and neck and spine in the Medicare population between 1993 and 1998. Contrary to the expected decline in the use of conventional invasive procedures such as myelography and angiography, our data reveal a parallel increase in their use. A substantial (more than fourfold) regional variation in the use of neu-roimaging procedures existed.
References
1. Physicians’ Current Procedural Terminology. Chicago, Ill: Amer-ican Medical Association; 1993
2. Physicians’ Current Procedural Terminology. Chicago, Ill: Amer-ican Medical Association; 1998
3. King DW. Statistical Quality Control Using the SAS System. Cary, NC: SAS Institute; 1995;51
4. Sunshine JH, Bansal S, Evens RG. Radiology performed by non-radiologists in the United States: who does what? AJR Am J Roentgenol 1993;161:419–429
5. Flanders AE, Flanders SJ, Friedman DP, Tartaglino LM, Russell KM. Performance of neuroradiologic examinations by nonra-diologists: results from seven states. Radiology 1996;198: 825–830
6. Rao VM, Levin DC, Spettell CM, Sunshine JH, Bansal S. Who performs neuroimaging? Results from the 1993 National Medicare Database. Radiology 1997;204:443–445
7. North American Symptomatic Carotid Endarterectomy Trial Col-laborators. Beneficial effect of carotid endarterectomy in symp-tomatic patients with high-grade carotid stenosis. N Engl J Med 1991;325:445–453
8. Gorelick PB. Carotid endarterectomy: where do we draw the line? Stroke 1999;30:1745–1750
9. Huber TS, Wheeler KG, Cuddeback JK, Dame DA, Flynn TC, Seeger JM. Effect of the asymptomatic carotid atherosclerosis study on carotid endarterectomy in Florida. Stroke 1998;29: 346–350
10. Wennberg J, Gittelsohn A. Small area variations in health care delivery: a population-based health information system can guide planning and regulatory decision-making. Science 1973; 182:1102–1108
11. Chassin MR, Brook RH, Park RE, et al. Variations in the use of medical and surgical services by the Medicare population. N Engl J Med 1986;314:285–290
13. Wennberg JE, Freeman JL, Shelton RM, Bubolz TA. Hospital use and mortality among Medicare beneficiaries in Boston and New Haven. N Engl J Med 1989;321:1168–1173
14. Greenfield S, Nelson EC, Zubkoff M, et al. Variations in re-source utilization among medical specialties and systems of care. JAMA 1992;267:1624–1630
15. Wennberg JE. Understanding geographic variations in health care delivery. N Engl J Med 1999;340:52–53
16. Pilote L, Califf RM, Sapp S, et al. Regional variation across the United States in the management of acute myocardial infarc-tion. N Engl J Med 1995;333:565–572
17. Cleary PD, Greenfield S, Mulley AG, et al. Variations in length of stay and outcomes for six medical and surgical conditions in Massachusetts and California. JAMA 1991;266:73–79 18. Fisher ES, Wennberg JE, Stukel TE, Sharp SM. Hospital
read-mission rates for cohorts of Medicare beneficiaries in Boston and New Haven. N Engl J Med 1994;331:989–995
19. Farrow DC, Hunt WC, Samet JM. Geographic variation in the treatment of localized breast cancer. N Engl J Med 1992;326: 1097–1101
20. Nattinger AB, Gottlieb MS, Veum J, Yahnke D, Goodwin JS. Geographic variation in the use of breast-conserving treat-ment for breast cancer. N Engl J Med 1992;326:1102–1107
21. Kuhn EM, Hartz AJ, Baras M. Correlation of rates of coronary artery bypass surgery, angioplasty, and cardiac catheteriza-tion in 305 large communities for persons age 65 and older. Health Serv Res 1995;30:425–436
22. Lucas FL, Wennberg DE, Malenka DJ. Variation in the use of echocardiography. Eff Clin Pract 1999;2:71–75
23. Wennberg DE, Kellett MA, Dickens JD Jr, Maleka DJ, Kielson LM, Keller RB. The association between local diagnostic testing intensity and invasive cardiac procedures. JAMA 1996;275: 1161–1164
24. Ashton CM, Petersen NJ, Souchek J, et al. Geographic variations in utilization rates in Veterans Affairs hospitals and clinics. N Engl J Med 1999;340:32–39
25. Freeborn DK, Shye D, Mullooly JP, Eraker S, Romeo J. Primary care physicians’ use of lumbar spine imaging tests: effects of guidelines and practice pattern feedback. J Gen Intern Med 1997;12:619–625