Corrigendum
Bucking, C. and Wood, C. M.(2005). Renal regulation of plasma glucose in the freshwater rainbow trout. J. Exp. Biol.208, 2731-2739.
In the online version of this paper, the regression equations reported in the captions of Figs 3 and 4 (p. 2736) are incorrect. The correct captions, together with the original figures, are shown below.
The print version of the article is unaffected by this error.
The authors apologise to readers for any inconvenience this may have caused.
3013
Glucose filtered (μmol kg–1 h–1)
0 75 150 225 300
Glucose reabsorbed (
μ
mol kg
–1 h
–1
)
0 20 40 60 80 100 120 140 160 180
Glucose-only infusion
Glucose-only infusion (Bucking and Wood, 2004) Glucose and phlorizin infusion
Fig.·4. Glucose filtration (μmol·kg–1·h–1) vs glucose reabsorption
(μmol·kg–1·h–1) in fish infused with glucose-only or phlorizin and
glucose together. Points are values for individual fish at different times, not mean values. See text for details. Regression equations: for glucose only group, y=162.01–[171/(1+0.00004x)227.7] (r2=0.9657)
and for glucose + phlorizin treated group, y=0.29x+22.586 (r2=0.2584).
Na+ reabsorption (μmol kg–1 h–1)
0 200 400 600 800 1000
Glucose reabsorption (
μ
mol kg
–1 h
–1
)
0 20 40 60 80 100 120 140 160 180
Glucose and phlorizin infusion Glucose-only infusion
*
Fig.·3. Glucose reabsorption (μmol·kg–1·h–1) vs Na+ reabsorption
(μmol·kg–1·h–1) in fish infused with glucose-only or phlorizin and
glucose together. * indicates significantly different (P<0.05) regression line slopes. Points are values for individual fish at different times, not mean values. Regression equations: for glucose only group, y=0.200x–35.471 (r2=0.8489) and for glucose + phlorizin treated
Despite the fact that most fish are considered to behave as diabetic-like animals, experiencing prolonged hyperglycemia after ingesting a carbohydrate-rich meal (Palmer and Ryan, 1972; Furuichi and Yone, 1981; Wilson, 1994; Wright et al., 1998), in vivo renal handling of glucose by fish has rarely been examined directly. Carbohydrates found in fish feed are generally various forms of starches obtained from grains, such as corn or wheat (Horn, 1998). These starches are broken down into their monosaccharide components, one of which is glucose, and absorbed by the gastrointestinal tract of the fish (Horn, 1998).
Rainbow trout (Oncorhynchus mykissWalbaum), like many other species of fish, have difficulty peripherally utilizing glucose obtained from their diets, which results in slow plasma clearance (Legate et al., 2001). As a consequence, carbohydrates are considered to be of limited value in the nutrition of fish such as the rainbow trout (Phillips and Brockway, 1959; Legate et al., 2001). However, due to recent findings that commercial fish feeds, manufactured with fish meal and oils, may be contributing to the contamination of farmed fish stocks with PCBs (polychlorinated biphenyls) and other toxins (Hites et al., 2004), there is renewed interest to
explore alternative sources of food energy such as carbohydrates. Replacing traditionally used fish meal with cheaper carbohydrates would also reduce feed production costs and demands on depleting wild fish stocks, which are the current source of the feed (Naylor et al., 2000).
However, carbohydrates, such as glucose, may be lost in the urine of fish due to their inability to clear the nutrient from the plasma (Wright et al., 1998). In mammals, prolonged hyperglycemia induces a cascade of three events in the nephron, as summarized by Massry and Glassocks (2001). First, the filtered glucose load exceeds the transport capabilities of the proximal tubule, resulting in glucosuria. Thereafter, glucose gains access to more distal portions of the nephron, creating a net suppression of water reabsorption, a condition referred to clinically as osmotic diuresis. If osmotic diuresis persists, the final event is the reduction in Na+reabsorption by the nephron, resulting in natriuresis. Whether these three events occur in the kidney of a freshwater fish in response to hyperglycemia is unknown.
Work by Friere et al. (1995) involving brush-border membrane vesicles (BBMV) isolated and prepared from the proximal tubule has aided in characterizing the glucose Published by The Company of Biologists 2005
doi:10.1242/jeb.01668
This study examined the effects of prolonged hyperglycemia on renal handling of glucose and explored the in vivopharmacological effects of phlorizin on glucose transport in the rainbow trout. The transport of glucose was examined by experimentally elevating the rate of
renal glucose reabsorption via infusion of the fish with
exogenous glucose at a rate of 70·µmol·kg–1·h–1 and by
inactivating the glucose transporters via the simultaneous
administration of phlorizin (1·µmol·kg–1·h–1). Glucose was
reabsorbed against a concentration gradient, until plasma
glucose levels reached ~22·µmol·l–1 and the transport
maximum of glucose in the kidney (~145·µmol·kg–1·h–1)
was exceeded. At this point, glucose was lost to the urine, resulting in glucosuria. Glucosuria affected water reabsorption, approximately doubling the water clearance ratio, and resulted in osmotic diuresis. This in turn
reduced Na+ reabsorption, increasing the amount lost to
the urine from 0.5% to 2% of the filtered load. Glucose
reabsorption was found to be correlated with Na+
reabsorption, though the latter was almost 10-fold higher than glucose transport rates. Phlorizin treatment reduced glucose reabsorption, although it did not block it entirely
until 48–72·h of infusion. The glucosuria resulting from
the blockade of the glucose transporters resulted in a
similar osmotic diuresis and a greater Na+loss to the urine
(9% of filtered load). The results are discussed with respect to the net renal ‘wasting’ of glucose and the detrimental osmoregulatory and ionoregulatory effects associated with glucosuria caused by carbohydrate-rich diets.
Key words: carbohydrate diet, glucose transport maximum, Na+
reabsorption, Oncorhynchus mykiss, phlorizin, renal function. Summary
Introduction
Renal regulation of plasma glucose in the freshwater rainbow trout
Carol Bucking* and Chris M. Wood
McMaster University, 1280 Main Street West, Hamilton, Ontario, Canada L8S 4K1
*Author for correspondence (e-mail: buckincp@mcmaster.ca)
2732
transporter in the rainbow trout kidney. The BBMVs displayed a single Na+-dependent D-glucose co-transport system that bound Na+and glucose in a 1:1 stoichiometry and appeared to use the energy from Na+ and voltage gradients to transport glucose in a manner similar to that in mammals.
Phlorizin (phloretin-2′-β-glucoside) is a flavonoid present in apples and derived from phloretin (phloretin-2′-O-glucose). In mammals, phlorizin is a competitive inhibitor of glucose uptake via Na+/D-glucose co-transporters (Alvarado et al., 1964; Leung et al., 2000; Crespy et al., 2002), and the physiological effect in vivo appears to be primarily the inhibition of renal tubular reabsorption of filtered glucose. This is accomplished by phlorizin binding to the transporter and inhibiting the conformational change necessary for glucose transport (Horsburgh et al., 1978). In fish, phlorizin has been reported to inhibit Na+-dependent glucose transport in BBMVs from the proximal tubule of the kidney (Friere et al., 1995).
The goals of the present study were to examine the effects of prolonged hyperglycemia on the renal handling of glucose and to explore the in vivo pharmacological effects of phlorizin on glucose transport in the rainbow trout. The study was designed to increase the rate of renal tubular glucose reabsorption by exogenous glucose loading and thereby determine the plasma threshold and the transport maximum (TmG) of the freshwater trout kidney. We hypothesized that once these thresholds are surpassed, osmotic diuresis, and possibly natriuresis, would ensue. Also, in view of the likely coupling of glucose reabsorption to Na+ reabsorption, the effects of altering the glucose transporter’s level of functioning on Na+ reabsorption was explored, as well as the effect of phlorizin on both processes.
Materials and methods Experimental animals
Rainbow trout (233±4·g) from Humber Springs Trout Farm (Orangeville, Ontario, Canada) were acclimated to seasonal temperatures (10–13°C) and dechlorinated Hamilton tapwater [Ca2+=1.8·mmol·l–1; Cl–=0.8·mmol·l–1; Na+=0.6·mmol·l–1; Mg2+=0.5·mmol·l–1; K+=0.04·mmol·l–1; titration alkalinity (to pH 4.0) = 1.9·mequiv.·l–1; total hardness=140·mg·l–1 as CaCO3; pH 8.0]. The fish were fed daily with 5-point-sized
commercial trout pellets (Martin Mills, Ontario, Canada) at a 2% body mass ration until one week before surgery, when feeding was suspended. The crude carbohydrate content of the diet was reported by the manufacturers as 30%.
Experimental protocol
While fish were anaesthetized with MS-222 (0.07·g·l–1; Sigma, St Louis, MO, USA) and artificially ventilated on an operating table, dorsal aortic (Soivio et al., 1972) and internal urinary (Curtis and Wood, 1991; Wood and Patrick, 1994) catheters were implanted. The dorsal aortic catheters (Clay-Adams PE-50, Sparks, MA, USA) were filled with 0.3·ml of Cortland saline (Na+=140·mmol·l–1; Cl–=130·mmol·l–1; K+=5·mmol·l–1; Ca2+=1·mmol·l–1, Mg2+=2·mmol·l–1, glucose=
5.5·mmol·l–1; pH 7.8; Wolf, 1963) containing 50·i.u.·ml–1of lithium heparin (Sigma) and sealed. The internal urinary catheters (heat-molded Clay-Adams PE-60) were drained by gravity into glass vials placed 3·cm below the water line. By placing the catheters inside the bladder, any reabsorptive/ secretory role of the bladder is prevented and therefore the function of the kidney is solely examined.
The fish were then placed in individual darkened flux boxes and allowed to recover for 24·h, during which time the functionality of the catheters was assessed. Fish in which both catheters were operational were deemed to be experimentally viable. Such fish were then injected, via the dorsal aorta catheter, with 17·µCi (0.629 MBq) of [1,2-3H]polyethylene glycol (PEG-4000; New England Nuclear, Boston, MA, USA) in 0.66·ml of Cortland saline, followed by an additional wash of 0.3·ml of Cortland saline (Curits and Wood, 1991; McDonald and Wood, 1998). The [3H]PEG-4000 was allowed to equilibrate for 12·h before starting the experiment. [3H]PEG-4000 is the glomerular filtration rate (GFR) marker of choice in teleost fish because it undergoes the least radioautolysis, metabolic breakdown or post-filtration reabsorption relative to other GFR markers (Beyenbach and Kirschner, 1976; Erickson and Gingrich, 1986; Curtis and Wood, 1991).
The fish were separated into two treatment groups (N=7 each). The first group received a constant infusion of 140·mmol·l–1glucose supplemented with an NaCl solution to achieve a typical plasma osmolality of 280·mOsmol·kg–1. The second treatment group received the same infusion solution with an additional 2·mmol·l–1phlorizin added. The infusions,
via a Gilson Minipulse peristaltic pump and at a rate of 500·µl·kg–1·h–1were begun after allowing the [3H]PEG-4000 to equilibrate for 12·h and were continued for 72·h. Blood samples (100·µl) were taken every 12·h and centrifuged at 13·000·gfor 30·s to separate plasma and red blood cells, and urine samples were collected at the same time – i.e. over 12·h periods. Plasma and urine samples were immediately frozen in liquid nitrogen and stored at –80°C for later analysis.
Analytical techniques
Glucose concentrations in the plasma and urine were measured enzymatically (hexokinase, glucose-6-phosphate dehydrogenase) using a commercial kit (Sigma, 301A). The [3H]PEG-4000 radioactivities of the plasma (25·µl) and urine (1·µl) were measured by diluting with double-distilled water to a total volume of 5·ml, then adding 10·ml of ACS scintillation fluor (Amersham, UK). The samples were then counted in an LKB Rackbeta 1217 Counter (Turku, Finland). Tests demonstrated that quenching was uniform and therefore no correction was necessary. Na+ concentrations in plasma and urine were measured using a Varian 1275 Atomic Absorption Spectrophotometer (Walnut Creek, CA, USA).
Calculations
Urinary excretion rates (U) of any substance (X) were calculated as:
Ux= [X]uUFR (1)
using measured values of urine flow rates (UFR) and urine concentrations of the substance ([X]u). Clearance rates (Cx)
were calculated as the excretion rate of X divided by its concentration in the blood plasma ([X]p):
Cx= ([X]uUFR) / [X]p. (2)
Therefore, glomerular filtration rates (clearance rates of [3H]PEG-4000) were calculated as the excretion of [3 H]PEG-4000 radioactivity in the urine (c.p.m.u) divided by its
concentration in the blood plasma (c.p.m.p):
GFR= (c.p.m.uUFR) / c.p.m.p. (3)
[3H]PEG-4000 radioactivity exhibited a steady decline over time. Therefore, the concentration in blood plasma was taken as the mean of measurements at the start and end of each 12·h period.
The filtration rate (FR; also known as filtered load) of a substance [X] at the glomeruli was calculated as:
FRx= [X]pGFR (4)
and the net tubular reabsorption rate (TR) of X as:
TRx= Ux– FRx. (5)
The clearance ratio (relative clearance) of a substance (CRx;
Wood, 1995) relates the clearance of X to the GFRor, in other words, its excretion rate (Ux) relative to its filtration rate (FRx):
CRx= ([X]uUFR) / ([X]pGFR) . (6)
A CRxof more than 1 indicates that secretion of X has occurred
on a net basis; less than 1 indicates that reabsorption of X has occurred on a net basis.
All rates were related to fish body mass, i.e. ml·kg–1·h–1.
Statistics
Data have been generally reported as means ± S.E.M.
(N=number of fish), unless otherwise stated. Regression analysis was used to determine if there was a significant relationship between two variables. Regression lines were fitted by the method of least squares, and the significance (P<0.05) of the slope was assessed. Significant (P<0.05) differences between two regression line slopes were calculated, according to Zar (1974), by an analysis of covariance (ANCOVA). Significant differences between treatment means were evaluated using Student’s paired and unpaired t-tests as appropriate (P<0.05), with Bonferroni correction for multiple comparisons (Nemenyi et al., 1977). Significant differences between time points were evaluated with an analysis of variance (ANOVA) followed by a post-hoc test (LSD). All statistical tests were run using SPSS, version 10.
Results
Prior to infusion, plasma glucose concentrations were around 10·mmol·l–1for both treatment groups (Fig.·1A). The
glucose infusions raised plasma glucose levels markedly in both treatment groups regardless of the presence or absence of phlorizin, such that there was no significant difference between them at any time. After 36·h, the plasma concentration reached a plateau of 35.3±2.5·mmol·l–1(both treatments averaged over 36–72·h, N=14), which remained unchanged for the duration. The concentration of glucose in the urine also increased over time for both groups, as seen in Fig.·1B. For urine collected over the first 12·h of infusion, the glucose-only infusion group exhibited a urine concentration of 1.31±0.66·mmol·l–1, which is close to detection limits of the assay. However, the urine concentration of glucose rose significantly over the next 48·h before reaching a maximum value of 36.3±2.1·mmol·l–1(N=7; 72·h). Even within the first 12·h of infusion, the effect of phlorizin was evident, resulting in a significant elevation of urine glucose to 17.1±1.6·mmol·l–1 (N=7), which was considerably higher than that of the glucose-only infusion group. The phlorizin-treated group maintained a significantly (P<0.01) higher urine glucose concentration for the next 48·h,
0 12 24 36 48 60 72
Plasma glucose concentration (mmol l
–1)
0 10 20 30 40
Glucose-only infusion Glucose and phlorizin infusion
*
*
*
A
Time (h)
0–12 12–24 24–36 36–48 48–60 60–72
Urine
glucose concentration (mmol l
–1
)
0 10 20 30 40 50
a
a, a
a,
a
*
*
*
*
*
*
B
Fig.·1. (A) Plasma glucose concentrations (mmol·l–1). (B) Urine
glucose concentrations (mmol·l–1). Values are means ± 1 S.E.M. (N=7).
* indicates a significant difference (P<0.05) between the indicated value and the previous 12·h value; aindicates a significant difference
2734
increasing to reach a final plateau of 40.4±1.9·mmol·l–1(N=7), not significantly different from the glucose-only group at this time. Notably, the final urine concentrations for both groups were not different from the final plasma glucose concentrations measured in this study. Also notable is the fact that the final glucose excretion rates in both groups (127–143·µmol·kg–1·h–1) were higher than the glucose infusion rates (70·µmol·kg–1·h–1) (Table·1). The plasma glucose rates appear to be fluctuating slightly as a result of the high glucose excretion rates (Fig.·1A). However, the true nature of the phenomenon is not apparent in the time course of the experiment and, if further time points were examined, a decrease might become evident.
UFR increased significantly over time to a similar degree within each treatment (Table·1). As with glucose excretion rates, the final UFRs (water excretion rates) showed a greater elevation above background (~1·ml·kg–1·h–1) than the infusion rates (0.5·ml·kg–1·h–1). GFRwas also not significantly different between the two treatment groups (Table·1), although GFR
decreased over the course of the experiment as UFRincreased. However, for most time points of the experiment, GFR was significantly higher than UFR, indicating that reabsorption of water had occurred (Table·1), with the exception of the final experimental period (60–72·h) in both treatments.
The filtration rate of glucose during the glucose-only infusion increased over time, peaking at 36–48·h (Table·1). The same pattern was seen during the phlorizin infusion, with filtration rates peaking at 36-48·h, and for the course of the experiment there was no significant difference between the two groups. The final filtration rates were 60% higher than the initial filtration rates during 0–12·h.
As with the urine concentrations discussed earlier, the effect
of phlorizin was immediately apparent when examining the glucose excretion rates. During the first 12·h, excretion rates were 16 times higher in the phlorizin treatment than in the glucose-only treatment (Table·1). Both groups showed an increase in excretion over time, eventually becoming similar in value.
Glucose reabsorption for the glucose-only infusion group experienced a significant decrease at 48·h following an initial increase (Table·1), ending at 50% of the rate during the first 12·h. The glucose reabsorption rates for the phlorizin-exposed group were significantly lower than the glucose-only infusion group at all time points, ranging from 50 to 75% lower, and they underwent a similar decrease from 48·h onwards.
Glucose clearance ratios showed a similar pattern to glucose excretion rates (Fig.·2A). During the glucose-only infusions, the clearance ratio started out at 0.028±0.015, which shows an almost complete reabsorption of glucose (approximately 97%). As plasma glucose concentrations rose over time to reach a plateau, the clearance ratios rose steadily as well, eventually reaching ~0.75 (only 25% reabsorption of glucose) by the final time period. During the phlorizin treatment, the clearance ratio at 12·h had already reached 0.5 (50% reabsorption of glucose), and by 48·h had reached a value (0.9) not statistically different from 1.0, which would indicate that glucose was being filtered with the same efficiency as the [3H]PEG 4000 and was not being reabsorbed.
Na+clearance ratios were low (0.005–0.1; indicating >90% reabsorption) and increased significantly over time during both treatments (Fig.·2B). In the glucose-only treatment, net reabsorption decreased from ~99.5% to 97.5%; it decreased to ~91% in the phlorizin treatment. The Na+clearance ratios for the phlorizin-infused group were significantly elevated from
[image:5.612.41.562.99.281.2]C. Bucking and C. M. Wood
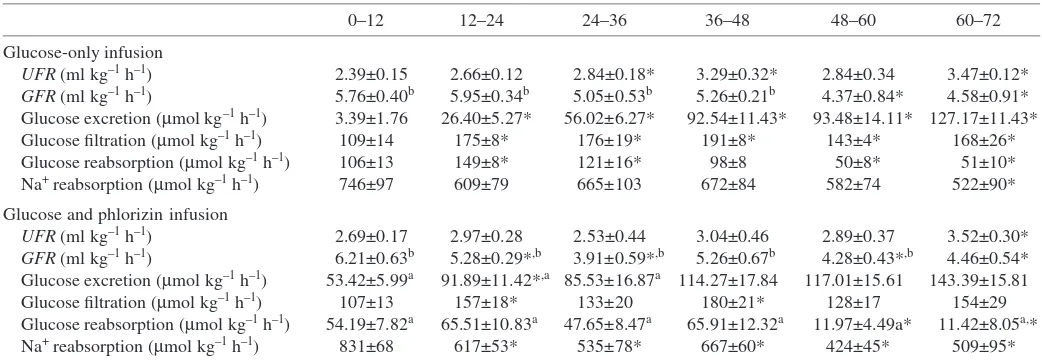
Table 1. Comparison of UFR,GFR, glucose excretion, glucose reabsorption and Na+reabsorption rates between the two infusion groups
0–12 12–24 24–36 36–48 48–60 60–72
Glucose-only infusion
UFR(ml·kg–1·h–1) 2.39±0.15 2.66±0.12 2.84±0.18* 3.29±0.32* 2.84±0.34 3.47±0.12*
GFR(ml·kg–1·h–1) 5.76±0.40b 5.95±0.34b 5.05±0.53b 5.26±0.21b 4.37±0.84* 4.58±0.91*
Glucose excretion (µmol·kg–1·h–1) 3.39±1.76 26.40±5.27* 56.02±6.27* 92.54±11.43* 93.48±14.11* 127.17±11.43* Glucose filtration (µmol·kg–1·h–1) 109±14 175±8* 176±19* 191±8* 143±4* 168±26*
Glucose reabsorption (µmol·kg–1·h–1) 106±13 149±8* 121±16* 98±8 50±8* 51±10* Na+reabsorption (µmol·kg–1·h–1) 746±97 609±79 665±103 672±84 582±74 522±90*
Glucose and phlorizin infusion
UFR(ml·kg–1·h–1) 2.69±0.17 2.97±0.28 2.53±0.44 3.04±0.46 2.89±0.37 3.52±0.30* GFR(ml·kg–1·h–1) 6.21±0.63b 5.28±0.29*,b 3.91±0.59*,b 5.26±0.67b 4.28±0.43*,b 4.46±0.54* Glucose excretion (µmol·kg–1·h–1) 53.42±5.99a 91.89±11.42*,a 85.53±16.87a 114.27±17.84 117.01±15.61 143.39±15.81
Glucose filtration (µmol·kg–1·h–1) 107±13 157±18* 133±20 180±21* 128±17 154±29 Glucose reabsorption (µmol·kg–1·h–1) 54.19±7.82a 65.51±10.83a 47.65±8.47a 65.91±12.32a 11.97±4.49a* 11.42±8.05a,*
Na+reabsorption (µmol·kg–1·h–1) 831±68 617±53* 535±78* 667±60* 424±45* 509±95*
Values are means ±S.E.M. (N=7). * indicates a significant difference (P<0.05) between the indicated time period and the 0–12·h time period;
aindicates a significant difference (P<0.05) between the mean phlorizin infusion values and the glucose-only infusion values at the same time
48·h onwards when compared with the glucose-only treatment group. Water clearance ratios were not different at any time point between the two treatments but they did show an increase over time, effectively doubling from the starting values (Fig.·2C). Thus, water reabsorption decreased from approximately 55% to 20%.
Glucose and Na+ reabsorption were well correlated during
the glucose-only infusion (Fig.·3). Fig.·3 also shows that Na+
reabsorption was almost 10-fold higher than glucose reabsorption and that the phlorizin treatment effectively eliminated the relationship between Na+ and glucose
reabsorption.
Fig.·4 shows a combination of results from this experiment and from a similar experiment using much lower glucose concentrations for infusion that was reported earlier (Bucking and Wood, 2004). During the glucose-only infusions, glucose was initially reabsorbed entirely as filtered loads increased, but then reabsorption rates appeared to reach a plateau as filtration rates continued to rise. This leveling off at high values suggests
that a transport maximum has been reached. For the phlorizin treatment, glucose reabsorption was independent of the filtered glucose load over the range for which data were available and averaged approximately 35% of the plateau value in the glucose-only treatments.
A graphical representation of the glucose filtration, excretion and reabsorption rates versusplasma glucose concentrations is shown in Fig.·5. The threshold plasma concentration at which glucose started to be lost to the urine because the reabsorption rate reached saturation was approximately 22·mmol·l–1. The
leveling off of the glucose reabsorbed line indicates the TmG of the transporter and was approximately 145·µmol·kg–1·h–1.
Discussion
The handling of glucose by the rainbow trout kidney appears to be well correlated with the handling of Na+(Fig.·3). While
these data do not prove dependency, they do support the conclusions made by Friere et al. (1995) that glucose
Glucose clearance ratio
0 0.4 0.8 1.2
*
*
*
*
*
*
*
a a
a
a,
Na
+ clearance ratio
0 0.02 0.04 0.06 0.08 010.
0.12 a,
a,
*
*
Time (h) H2
O clearance ratio
0.3 0.4 0.5 0.6 0.7 0.8 0.9
*
*
*
*
*
*
*
*
*
0–12 12–24 24–36 36–48 48–60 60–72
0–12 12–24 24–36 36–48 48–60 60–72
Time (h)
0–12 12–24 24–36 36–48 48–60 60–72
*
A
C
B
Glucose-only infusion Glucose and phlorizin infusion
Fig.·2. (A) Renal clearance ratios of glucose. (B) Renal clearance ratios of Na+. (C) Renal
clearance ratios of water. Values are means ± 1 S.E.M. (N=7). * indicates a significant difference (P<0.05) between the indicated value and the 0-12·h value; a indicates a significant difference (P<0.05)
2736
transporters in the proximal tubule of the rainbow trout kidney are Na+-dependent D-glucose co-transporters. However, the rate of Na+ reabsorption was considerably higher than the rate of glucose reabsorption, suggesting that most Na+transporters were not involved in the reabsorption of glucose. Certainly, phlorizin blockade of glucose reabsorption did not significantly alter net Na+reabsorption relative to the glucose-only infusion group (Fig.·3; Table·1). Indeed, Nishimura et al. (1983) concluded that the distal portion of the nephron in the rainbow
trout kidney was responsible for diluting the urine produced in the proximal tubule. This was accomplished through Na+(and other electrolyte) reabsorption and the fact that the epithelium appeared to have reduced permeability to water. The apparent permeability to water could be increased, however, by increasing the osmotic pressure in the lumen of the tubule (Nishimura et al., 1983).
The infusion of glucose raised plasma glucose levels well beyond those normally seen in rainbow trout (Wright et al., 1989). At normal to moderately elevated plasma glucose concentrations (5–20·mmol·l–1), glucose reabsorbed was a linear function of glucose filtered (Figs·4,·5). However, as the hyperglycemia worsened, the relationship between reabsorption and filtration approached an asymptote as a result of the TmG of glucose being reached (Fig.·4). Above a certain blood glucose level (threshold value), excretion becomes a linear function of the amount filtered (or plasma concentration), and reabsorption reaches a plateau. Consequently, a plot of urinary excretion rate against plasma
C. Bucking and C. M. Wood
Plasma glucose concentration (mmol l–1)
10 20 30 40
Glucose f
iltered, e
xcreted or reabsorbed (
µ
mol kg
–1 h
–1
)
0 50 100 150 200 250
Glucose filtered Glucose excreted Glucose reabsorbed
0
Glucose filtered (µmol kg–1 h–1)
0 75 150 225 300
Glucose reabsorbed (
µ
mol kg
–1
h
–1)
0 20 40 60 80 100 120 140 160 180
Glucose-only infusion
Glucose-only infusion (Bucking and Wood, 2004) Glucose and phlorizin infusion
Fig.·4. Glucose filtration (µmol·kg–1·h–1) vs glucose reabsorption
(µmol·kg–1·h–1) in fish infused with glucose-only or phlorizin and glucose together. Points are values for individual fish at different times, not mean values. See text for details. Regression equations: for glucose only group, y=0.200x–35.471 (r2=0.8489) and for glucose +
phlorizin treated group, y=0.031x+58.047 (r2=0.018).
Fig.·5. Relationships of glucose filtration, excretion and reabsorption rates to plasma glucose concentration in the rainbow trout, allowing estimation of the in vivo glucose transport maximum from the plateau in glucose reabsorption. Points are for fish infused with glucose only and represent individual fish at different times, not mean values. See text for details. The equation of the regression line for glucose filtered is y=5.547x–2.224 (r2=0.9615, P<0.05), where y is the glucose
filtration rate (µmol·kg–1·h–1) and x is the plasma glucose concentration (mmol·l–1). The equation of the regression line for
glucose excreted is y=0.942+log(1.207)1.207x(r2=0.9321, P<0.01), where y is the glucose excretion rate (µmol·kg–1·h–1) and x
is the plasma glucose concentration (mmol·l–1). The equation of the regression line for glucose reabsorbed is
y=–96.182+246.349e–0.5{[(x–33.715)/23.302]2}(r2=0.9149, P<0.05), where
yis the glucose reabsorption rate (µmol·kg–1·h–1) and xis the plasma
glucose concentration (mmol·l–1). Na+ reabsorption (µmol kg–1 h–1)
0 200 400 600 800 1000
Glucose reabsorption (
µ
mol kg
–1
h
–1)
0 20 40 60 80 100 120 140 160 180
Glucose and phlorizin infusion Glucose-only infusion
*
Fig.·3. Glucose reabsorption (µmol·kg–1·h–1) vs Na+ reabsorption (µmol·kg–1·h–1) in fish infused with glucose-only or phlorizin and
glucose together. * indicates significantly different (P<0.05) regression line slopes. Points are values for individual fish at different times, not mean values. Regression equations: for glucose only group,
y=162.01–[171/(1+0.00004x)227.7] (r2=0.9657) and for glucose +
glucose concentration yields a threshold value at which glucose is lost to the urine, and a plot of urinary reabsorption rates against plasma glucose concentration yields a sigmoidal curve, as shown in Fig.·5, from which a TmG can be calculated (Massry and Glassocks, 2001).
The TmG found in this study is similar to findings in another
in vivo study (Gray and Brown, 1985; Table·2). However, it is approximately double compared with findings on in situ
perfused trout kidney studies (Amer and Brown, 1995; Brown et al., 2000; Table·2). Part of these differences could be accounted for by variations in experimental temperatures, as TmG varies with temperature, with higher temperatures yielding higher TmGs (MacKay and Beatty, 1967). However, it seems likely that part of the discrepancy could reflect more efficient renal function in vivo than in perfused-organ experiments.
The plasma threshold value at which glucose started to be lost to the urine was found to be 22·mmol·l–1. This is similar to other peak plasma values found in the rainbow trout, after ingestion of glucose-rich diets or injection of glucose-rich solutions, although different when compared with other species (Table·2). The minor differences seen within rainbow trout might be attributed to experimental procedure, as the highest plasma values were seen with bolus injections and infusions, while the lowest value was seen in a chronic dietary exposure. This could be due to differential activation of physiological processes, depending on the route of exposure. Indeed, Hemre et al. (1995) observed that plasma glucose levels in Atlantic salmon rose only marginally after oral ingestion, while intraperitoneal administration resulted in prolonged hyperglycemia.
A possible explanation for the difference observed between species (Table·2) could involve variations in ‘glucose space’, where glucose space is the space into which glucose is dispersed and includes plasma and extracellular fluid (Legate et al., 2001). Glucose space has been shown to vary between species, ranging from 100 to 400·ml·kg–1(Garin et al., 1987),
although only a limited number of species have been examined to date. Another possible explanation for the differences in glucose plasma peaks is a possible difference in the renal glucose transport maximum between species. There are reported differences in many renal transport processes between species, including those involved with glucose, especially when comparing marine and freshwater fish (Dantzler, 1989). In addition, there exists evidence of differential handling of dietary starches between species. Perch have been shown to increase intestinal glucose absorption when fed high starch diets, while rainbow trout remained unchanged (Buddington, 1987). Krogdahl et al. (2004) have also shown that Atlantic salmon and rainbow trout exhibit differential handling of dietary starches, wherein rainbow trout were observed to have a higher capacity to digest and absorb starches compared with Atlantic salmon.
As the hyperglycemia created from the infusions increased, glucose was lost to the urine as a consequence of the transport maximum being reached, resulting in glucosuria as expected. As mentioned in the Introduction, this is the first event of three that occurs in the kidney during hyperglycemia in mammals. The second event, the decrease in reabsorption of water over time, was also present in the rainbow trout kidney, as evidenced by the increasing clearance ratio for water (Fig.·2C). This is probably due to the increasing osmotic pressure in the distal portion of the nephron due to the increasing concentration of glucose in the urine (Massry and Glassocks, 2001). This increase in osmotic pressure raises the apparent permeability of the distal nephron to water, as mentioned earlier (Nishimura et al., 1983).
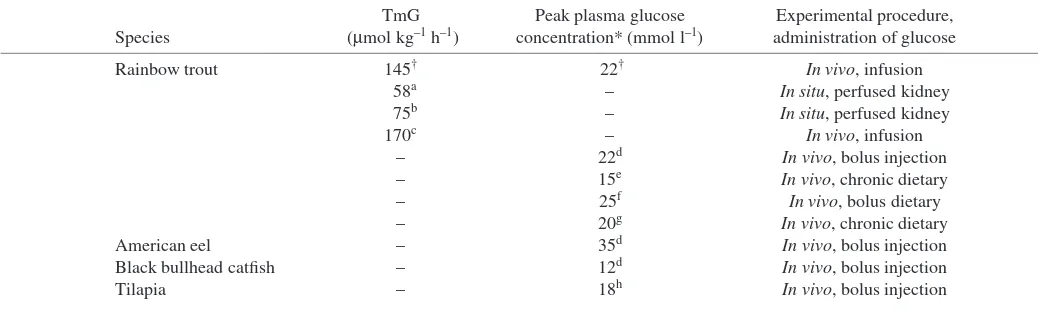
[image:8.612.48.567.86.241.2]The third event that occurs in mammalian kidneys, the loss of Na+to the urine, became clearly apparent in the last 12–24·h of the study (Table·1; Fig.·2B). Natriuresis caused by osmotic diuresis is the final occurrence in the kidney in response to hyperglycemia and tends to show a delayed response (Massry and Glassocks, 2001). This is supported by the phlorizin treatment group, which exhibited a decrease in Na+ Table 2. Transport maximum of glucose (TmG) in rainbow trout, and species comparison of peak plasma glucose concentrations
TmG Peak plasma glucose Experimental procedure, Species (µmol·kg–1·h–1) concentration* (mmol·l–1) administration of glucose
Rainbow trout 145† 22† In vivo, infusion
58a – In situ, perfused kidney
75b – In situ, perfused kidney
170c – In vivo, infusion
– 22d In vivo, bolus injection
– 15e In vivo, chronic dietary
– 25f In vivo, bolus dietary
– 20g In vivo, chronic dietary
American eel – 35d In vivo, bolus injection
Black bullhead catfish – 12d In vivo, bolus injection
Tilapia – 18h In vivo, bolus injection
*Peak in plasma glucose concentration after ingestion/injection of various concentrations of glucose.
†Present study; aAmer and Brown (1995); bBrown et al. (2000); cGray and Brown (1985); dLegate et al. (2001); eBergot (1979); fPalmer and
2738
reabsorption 12·h before the glucose-only treatment. The former group was experiencing elevated glucosuria compared with the glucose-only infusion group over a longer period of time (Fig.·2A). Overall, the freshwater rainbow trout kidney displays similar trends in response to hyperglycemia when compared with the mammalian kidney.
Despite the desire to include carbohydrates in fish food, there exists evidence that carbohydrate levels must be closely controlled when incorporated into the feed. Reduced growth rates have been observed in some fish species fed carbohydrate-free diets (Anderson et al., 1984; Degani et al., 1986). Conversely, feeding excessive dietary carbohydrates to fish has been shown to adversely affect an array of physiological parameters, such as growth and liver size and function (Hilton and Atkinson, 1982; Dixon and Hilton, 1985). These deleterious effects have been attributed to the poor peripheral utilization, or poor peripheral uptake, of glucose and other carbohydrates by the tissues or to insulin production and binding difficulties (Hilton and Atkinson, 1982; Legate et al., 2001).
The elevated levels of glucose found in the plasma of the rainbow trout after a carbohydrate-rich meal or injection are close to the plasma concentration at which the transport maximum is reached in this study (Fig.·5; Table·2; Philips et al., 1948; Palmer and Ryman, 1972; Bergot, 1979; Legate et al., 2001). This indicates that fish fed high starch diets may lose some of the glucose to the environment via urinary excretion. For aquaculture, this would affect the amount of starch or glucose incorporated into diets because, above a certain concentration of glucose, it would be of no use to, and possibly detrimental to the health of, the fish. The present study indicates that disturbances in ionoregulation and osmotic regulation associated with glucosuria may contribute to these deleterious effects.
Although the phlorizin infusion at 1·µmol·kg–1·h–1 was effective in reducing the reabsorption of glucose, it did not immediately block it entirely (Table·1). Glucose excretion rates only became equal to filtration rates after 48·h of phlorizin infusion, as shown by the clearance ratios in Fig.·2A and Table·1.
Administration of 1–10·µmol·kg–1·h–1 of phlorizin caused complete inhibition of glucose transport in several in vitro
studies conducted in fish (Pritchard and Kleinzeller, 1976), while previous studies on mammals have encountered complete blockade of glucose reabsorption at rates of <1·µmol·phlorizin·kg–1·h–1(Horsburgh et al., 1978; Silverman et al., 1970). The slow onset of blockade in the present study was probably due to competition. Indeed, Kimmich (1990) found that at glucose concentrations much greater than phlorizin concentrations, glucose was able to out-compete phlorizin for access to the transporter despite having a much lower binding affinity for the transporter. This was probable in the present experiment as the glucose concentration was 70 times greater than the phlorizin concentration in the infusion solution.
In summary, constant infusion of glucose into the plasma of the rainbow trout results in persistent hyperglycemia. As a
result, the kidney filters glucose at rates that exceed the transport maximum of the nephrons, resulting in glucosuria. This causes osmotic diuresis and natriuresis. As freshwater fish are hyperosmotic to their environment, this poses a detrimental risk to their osmotic and ionic regulation. With regard to the desire to incorporate carbohydrates into the diets of farmed fish, this should be approached with caution as, above a certain concentration, glucose obtained from the diet will result in glucosuria.
Supported by an NSERC Discovery grant to C.M.W. C.M.W. is supported by the Canada Research Chair program.
References
Alvarado, F. and Crane, R. K.(1964). Studies of the mechanism of intestinal absorption of sugars. Biochim. Biophys. Acta 93, 116-135.
Amer, S. and Brown, J. A.(1995). Glomerular actions of arginine vasotocin in the in situ perfused trout kidney. Am. J. Physiol. 269, R775-R780. Anderson, J., Jackson, A. J., Matty, A. J. and Capper, B. S.(1984). Effects
of dietary carbohydrates and fiber on the tilapia, Oreochromis niloticus.
Aquaculture 37, 303-314.
Bergot, F. (1979). Effects of dietary carbohydrate and of their mode of distribution on glycemia in rainbow trout (Salmo gairdneriRichardson).
Comp. Biochem. Physiol. 64, 534-547.
Beyenbach, K. W. and Kirschner, L. B. (1976). The unreliability of mammalian glomerular markers in teleostean renal studies. J. Exp. Biol. 64, 369-378.
Brown, J. A., Paley, R. K., Amer, S. and Aves, S. J.(2000). Evidence for an intrarenal renin-angiotensin system in the rainbow trout, Oncorhynchus mykiss. Am. J. Physiol. 278, R1685-R1691.
Bucking, C. and Wood, C. M. (2004). Does urea reabsorption occur viathe glucose pathway in the kidney of the freshwater rainbow trout? Fish Physiol. Biochem. 30, 1-12.
Buddington, R. K.(1987). Does the natural diet influence the intestine’s ability to regulate glucose absorption? J. Comp. Physiol. B. 157, 677-688. Crespy, V., Aprikian, O., Morand, C., Besson, C., Manach, C., Demige,
C. and Remesy, C.(2002). Bioavailability of phloretin and phloridzin in rats. J. Nutr. 132, 3227-3230.
Curtis, J. B. and Wood, C. M.(1991). The function of the urinary bladder
in vivo in the freshwater rainbow trout. J. Exp. Biol. 155, 567-583. Dantzler, W. H.(1989). Comparative Physiology of the Vertebrate Kidney.
Berlin: Springer-Verlag.
Degain, G., Viola, S. and Levanon, D.(1986). Effects of dietary carbohydrate source on growth and body composition of the European eel (Anguilla anguilla). Aquaculture 52, 97-104.
Dixon, D. G. and Hilton, J. W. (1985). Effects of available dietary carbohydrate and water temperature on the chronic toxicity of waterborne copper to rainbow trout (Salmo gairdneri). Can. J. Fish. Aquatic Sci. 42, 1007-1013.
Erickson, D. A. and Gingrich, W. H.(1986). Effect of injected rotenone on the production and composition of urine from the rainbow trout (Salmo gairdneri). Aquat. Toxicol. 9, 263-274.
Friere, C. A., Kinne-Saffran, E., Beyenbach, K. W. and Kinne, R. K. H. (1995). Na-D-glucose co-transport in renal brush-border membrane vesicles of an early teleost (Oncorhynchus mykiss). Am. J. Physiol. 269, R592-R602. Furuichi, M. and Yone, Y.(1981). Change of blood sugar and plasma insulin levels of fishes in glucose tolerance tests. Bull. Jpn Soc. Sci. Fish 47, 761-764.
Gairn, D., Rombaut, A. and Freminet, A.(1987). Determination of glucose turnover in sea bass Dicentrarchus labrax. Comparative aspects of glucose utilization. Comp. Biochem. Physiol. B 87, 981-988.
Gray, C. J. and Brown, J. A.(1985). Renal and cardiovascular effects of angiotensin II in the rainbow trout, Salmo gairdneri. Gen. Comp. Endocrinol. 59, 375-381.
Hemre, G.-I., Torrissen, O., Krogdahl, Å. and Lie, Ø.(1995). Glucose tolerance in Atlantic salmon Salmo salar L.: dependence on adaptation to dietary starch and water temperature. Aquac. Nutri. 1, 69-75.
(Salmo gairdneri) to increased levels of available carbohydrate in practical trout diets. Br. J. Nutr. 47, 597-607.
Hites, R. A., Foran, J. A., Carpenter, D. O., Hamilton, M. C., Knuth, B. A. and Schwager, S. J.(2004). Global assessment of organic contaminants in farmed salmon. Science 203, 226-229.
Horn, M. H.(1998). Feeding and digestion. In The Physiology of Fishes (ed. D. H. Evans), pp. 41-60. New York: CRC Press.
Horsburgh, T., Cannon, J. K. and Pitts, R. F.(1978). Action of phlorizin on luminal and antiluminal membranes of proximal cells of kidney. Am. J. Physiol. 234, F485-F489.
Kimmich, G. A.(1990). Membrane potentials and the mechanism of intestinal Na+-dependent sugar transport. J. Membr. Biol. 114, 1-27.
Krogdahl, Å., Sundby, A. and Olli, J.(2004). Atlantic salmon (Salmo salar) and rainbow trout (Oncorhynchus mykiss) digest and metabolize nutrients differently. Effects of water salinity and dietary starch level. Aquaculture
229, 335-360.
Legate, N. J., Bonen, A. and Moon, T. (2001). Glucose tolerance and peripheral glucose utilization in rainbow trout (Oncorhynchus mykiss), American eel (Anguilla rostrata), and black bullhead catfish (Ameiurus melas). Gen. Comp. Endocrinol. 122, 48-59.
Leung, D., Loo, D., Hirayama, B., Zeuthen, T. and Wright, E.(2000). Urea transport by co-transporters. J. Physiol. 528, 251-257.
Mackay, W. C. and Beatty, D. D.(1967). The effect of temperature on renal function in the white sucker fish, Catostomus commersonii. Comp. Biochem. Physiol. 26, 235-245.
Massry, S. G. and Glassocks, R. J. (ed.) (2001). Textbook of Nephrology. 4th edition. Philadelphia: Lippincott, Williams and Wilkins.
McDonald, M. D. and Wood, C. M.(1998). Reabsorption of urea by the kidney of the freshwater rainbow trout. Fish Physiol. Biochem. 18, 375-386. Naylor, R. L., Goldburg, R. J., Primavera, J. H., Kautsky, N., Beveridge, M. C. M., Clay, J., Folke, C., Lubchenco, J., Mooney, H. and Troell, M. (2000). Effect of aquaculture on world fish supplies. Nature 405, 1017-1024. Nemenyi, P., Dixon, S. K., White, N. B. and Jedstrom, M. L.(1977).
Statistics from Scratch. San Francisco: Holden-Day.
Nishimura, H., Imai, M. and Ogawa, M.(1983). Sodium chloride and water transport in the renal distal tubule of the rainbow trout. Am. J. Physiol. 244, F247-F254.
Palmer, T. N. and Ryan, B. E.(1972). Studies on oral glucose intolerance in fish. J. Fish Biol. 4, 311-319.
Phillips, A. M., Jr and Brockway, D. R.(1959). Dietary calories in the production oftrout in hatcheries. Prog. Fish. Cult. 21, 3-16.
Phillips, A. M., Jr, Tunison, A. V. and Brockway, D. R.(1948). Utilization of carbohydrates by trout. Fish. Res. Bull. N.Y. 11, 44.
Pritchard, J. B. and Kleinzeller, A.(1976). Renal sugar transport in the winter flounder Renal clearance studies. Am. J. Physiol. 231, 603-607. Silverman, D. M., Agnon, M. A. and Chinard, F. P.(1970). D-Glucose
interaction with renal tubular cell surfaces. Am. J. Physiol. 218, 735-742. Soivio, A., Westman, K. and Nyholm, K.(1972). Improved method of dorsal
aorta catheterization: haematological effects followed for 3 weeks in rainbow trout (Salmo gairdneri). Finn. Fish Res. 1, 11-21.
Wilson, R. P.(1994). Utilization of dietary carbohydrates in fish. Aquaculture.
124, 67-80.
Wolf, K. (1963). Physiological salines for freshwater teleosts. Progr. Fish Cult.25, 135-140.
Wood, C. M. (1995). Excretion. In Physiological Ecology of Pacific Salmon
(ed. C. Groot, L. Margolis and W. C. Clarke), pp. 381-438. Vancouver: UBC Press.
Wood, C. M. and Patrick, M. L.(1994). Methods for assessing kidney and urinary bladder function in fish. In Biochemistry and Molecular Biology of Fishes, vol. 3 (ed. P. W. Hochachka and T. P. Mommsen), pp. 127-143. New York: Elsevier Science.
Wright, J. R., Jr, O’Hali, W., Yang, H., Han, X. and Bonen, A.(1998). GLUT-4 deficiency and severe peripheral resistance to insulin in the teleost fish tilapia. Gen. Comp. Endocrinol. 111, 20-27.
Wright, P. A., Perry, S. F. and Moon, T. W.(1989). Regulation of hepatic gluconeogenesis and glycogenolysis by catecholamines in rainbow trout during environmental hypoxia. J. Exp. Biol. 147, 169-188.