During each step of walking, the gravitational potential energy Epand the kinetic energy Ekof the centre of mass of the body oscillate between a maximum and a minimum value. A priori, active movements of an organism are assumed to be powered by muscles: positive muscle work to increase potential energy and kinetic energy, and negative muscle work to absorb potential energy and kinetic energy. Both positive and negative muscular work require the expenditure of chemical energy. During walking, both the positive and the negative work actually done by the muscles to sustain the mechanical energy changes of the centre of mass (positive and negative external work) are reduced by the pendular transduction of potential energy to kinetic energy and vice versa (Cavagna et al., 1963).
The fraction of mechanical energy recovered due to this transduction, Rstep , has been defined as:
Rstep= (W+
v + W+f – W+ext)/(W+v + W+f) = 1 – W+
ext/(W+v + W+f) , (1) where W+
v represents the positive work calculated from the sum, over one step, of the positive increments undergone by the gravitational potential energy, Ep=Mgh (where M is the mass of the body and h is the height of the centre of mass), W+
f is the positive work calculated from the sum, over one step, of the positive increments undergone by the kinetic energy of forward motion Ekf. Ekf=0.5MVf2(where Vf is the
instantaneous forward velocity of the centre of mass), and W+
ext is the positive external work calculated from the sum over one step of the positive increments undergone by the total mechanical energy of the centre of mass, Ecg=Ep+Ekf+Ekv (Cavagna et al., 1976). The kinetic energy of vertical motion, Ekv=0.5MVv2(where Vvis the instantaneous vertical velocity of the centre of mass), has not been taken into account when obtaining Rstepfrom W+vand W+f. Ekv has no effect on W+v because the vertical velocity is zero at the top/bottom endpoints of the Epcurve. As will be shown below, using W+k, measured from the total kinetic energy curve Ek=Ekv+Ekf, instead of W+f, measured from the Ekf curve, has a negligible effect on Rstep (see Fig. 8).
Rstep, as defined in Equation 1, represents the fraction of the maximum positive energy increments possibly undergone by the centre of mass (measured assuming no energy transduction) that is recovered by the pendular mechanism over the whole step cycle: it does not give information about the time course of this transduction within the step. Factors that are expected to affect Rstepare: (i) the relative amplitude of the potential and kinetic energy curves, (ii) their shape and (iii) their relative phase. In a frictionless pendulum, energy recovery, R, equals unity because the changes in potential energy mirror the changes in kinetic energy. During walking, Rstep attains a maximum at an intermediate speed when the difference in amplitude of the potential and kinetic energy curves
JEB4219
During walking, the centre of mass of the body moves like that of a ‘square wheel’: with each step cycle, some of its kinetic energy, Ek, is converted into gravitational
potential energy, Ep, and then back into kinetic energy. To
move the centre of mass, the locomotory muscles must supply only the power required to overcome the losses occurring during this energy transduction. African women carry loads of up to 20% of their body weight on the head without increasing their energy expenditure. This occurs as a result of an unexplained, more effective energy transduction between Ek and Ep than that of Europeans.
In this study we measured the value of the Ek to Ep
transduction at each instant in time during the step in
African women and European subjects during level walking at 3.5–5.5 km h–1, both unloaded and carrying
loads spanning 20–30% of their body weight. A simulation of the changes in Ekand Epduring the step by sinusoidal
curves was used for comparison. It was found that loading improves the transduction of Ep to Ek during the descent
of the centre of mass. The improvement is not significant in European subjects, whereas it is highly significant in African women.
Key words: locomotion, walking, recovery, energy expenditure, human.
Summary
Introduction
Pendular energy transduction within the step in human walking
G. A. Cavagna
1,*, P. A. Willems
2, M. A. Legramandi
1and N. C. Heglund
21Istituto di Fisiologia Umana, Università degli Studi di Milano, 20133 Milan, Italy and2Unité de Réadaptation,
Université catholique de Louvain, 1348 Louvain-la-Neuve, Belgium
*Author for correspondence (e-mail: giovanni. cavagna@unimi. It)
approaches zero and the phase difference between the potential and kinetic energy curves approaches 180° (Cavagna et al., 1976, 1983; Griffin and Kram, 2000).
More information about the pendular mechanism of walking may be obtained by analyzing how the pendular transduction of the mechanical energy occurs during the step cycle. The factors affecting the pendular transduction of mechanical energy within the step are not known. The aim of this study is to define these factors by following the transduction between potential and kinetic energy at each instant of time during the step.
We applied this new approach to the great skill of African women carrying loads (Maloiy et al., 1986): African women carry loads more economically than Europeans as a result of their greater Rstep (Heglund et al., 1995); however, it is not known how this greater Rstep is attained. The within-step analysis of the potential kinetic energy transduction demonstrates the phases of the step in which the difference between African women and European subjects is most apparent.
Materials and methods Subjects and experimental procedure
In this study, we analyzed the changes in Ek, Epand Ek+Ep of the centre of mass of the body during one step of level walking at a constant speed with and without a load being carried by the subject (loaded and unloaded walking steps). Data were obtained for 11 Europeans (five male and six female, 65.6±7.1 kg, mean ± S.D.) and four African women (three Luo and one Kikuyu, 73.9±14.4 kg, mean ± S.D.) previously described by Heglund et al. (1995). The steps analyzed were recorded during walking at 3.5–5.5 km h–1, both for unloaded subjects and for subjects carrying loads spanning 20–30% of their body weight. The speed range corresponds to freely chosen walking speeds. The load range was chosen because it results in the maximum difference between Rstep measured in the European subjects and Rstep measured in the African subjects (see fig. 2 in Heglund et al., 1995). Data collected within these speed and load ranges were averaged (see Table 1) neglecting any effect of the speed and load change, because the scatter of the data was too large to define a trend within such a narrow speed and load range. Loads were head-supported by the African women and shoulder-supported by the Europeans. The Kikuyu woman carried the loads on her back supported solely by a strap over their head. Two of the Luo women carried the loads on top of her head, and the other Luo woman carried the loads both ways. A step was considered to be suitable for analysis when the sum of the increments of Epand Ekover the step cycle did not differ by more than 10% from the sum of the decrements due to variability between successive steps of the subject. All the usable steps (N=32) of the African women during walking with loads were analyzed. An equal number of steps was randomly chosen for analysis from a larger pool of data for African women during unloaded
walking and for European subjects during both unloaded and loaded walking. The five European males walked both loaded (18 steps analyzed) and unloaded (15 steps analyzed) whereas, of the six European females, four walked loaded and unloaded, one walked unloaded only and one walked loaded only, giving a total of 14 loaded steps and 17 unloaded steps analyzed.
The subjects walked across a force platform sensitive to the vertical and horizontal (fore–aft) components of the force exerted by the feet on the ground. The lateral component of the force was neglected (Cavagna et al., 1963). The force platform had a natural frequency greater than 180 Hz in both directions and was mounted at ground level in the middle of a walkway. The dimensions of the platform were 1.8 m×0.4 m in the case of the African women and 6.0 m×0.4 m in the case of the Europeans. The mean walking speed was measured by means of photocells placed 1.2 m apart (Africans) and 1.9–3.6 m apart (Europeans) alongside the platform.
The platform signals were collected by a microcomputer for analysis using a sampling rate of 500 Hz for the African subjects and 100 Hz for the European subjects. The changes in Ek, Ep and Ek+Ep of the centre of mass of the body were determined from the platform signals using the procedure described in detail by Cavagna (1975). In short, integration of the horizontal force and of the vertical force minus the body weight, both divided by the body mass, yielded the velocity changes of the centre of mass. The instantaneous velocity in the forward direction was obtained using the mean walking speed, measured from the photocell signal, to determine the integration constant. A first integration was made in the vertical direction on the assumption that the initial and final velocities of the step cycle were equal.
Contrary to our previous studies, in which the kinetic energy of forward and vertical motion were calculated separately, the kinetic energy of both forward and vertical motion, Ek, was calculated from the velocity of the centre of mass in the sagittal plane. Wkis the work necessary to sustain the kinetic energy changes (positive when Ek increases, negative when Ek decreases).
A second integration of the vertical velocity yields the vertical displacement of the centre of mass. This integration assumes that the net vertical displacement over the whole step cycle was zero. The oscillations of the gravitational potential energy Epwere calculated from the vertical displacement. Wv is the work necessary to sustain the gravitational potential energy changes (positive when Ep increases, negative when Epdecreases). The total energy of the centre of mass, Ecg, due to its motion in the sagittal plane, is the algebraic sum at each instant of Ep and Ek. Wext is the sum of the changes in Ecg during one step (the sum of the positive increments corresponds to the external positive work done by the muscular force, the sum of the negative increments corresponds to the external negative work done by the muscular force).
this assumption was measured in sprint running (Cavagna et al., 1971). During level walking at a constant speed, the net changes in mechanical energy of the centre of mass of the body are zero over the whole step cycle. It follows that the external positive work done by the muscular force equals the external negative work (neglecting the negative work done by friction outside the muscles), i.e. during each step, the muscles and elastic structures deliver and absorb an equal amount of mechanical energy and the net work (positive + negative) is zero. As mentioned above, chemical energy is expended to perform positive work and also, to a lesser extent, to perform negative work. To reduce energy expenditure, the mechanical energy changes of the centre of mass (both positive and negative) should be reduced to a minimum.
Within-step analysis of the potential–kinetic energy transduction
The mechanisms resulting in the measured value of Rstep (Equation 1) were analyzed in this study by measuring the fraction of mechanical energy recovered due to the transduction between Epand Ekat each instant in time during the step. The step period, τ, was divided into equal time intervals (2 ms for the Africans and 10 ms for the Europeans), and the recovery, r(t), was calculated from the absolute value of the changes, both positive and negative increments, in Ep, Ekand Ecgduring each time interval:
r(t) = 1 – |∆Ecg(t)|/[|∆Ep(t)| + |∆Ek(t)|] =
1 – |Wext(t)|/[|Wv(t)| + |Wk(t)|] , (2) where t is time. The signal-to-noise ratio in r(t) decreased when the changes in energy during a particular time interval approached zero (see Fig. 7).
Simulation of the energy transduction within the step To examine the trend of r(t) within the step (Equation 2), the changes in Epand Ektaking place during a walking step were simulated by two sinusoidal curves. This simulation is not meant to represent a model of the complex walking mechanics but offers a useful background within which to interpret the experimental recording of r(t) and to distinguish different phases within the step. In addition, it allows us to define the relationship between the mean pendular energy transduction derived from the present analysis and Rstep, previously used in the literature (see below).
Since, during walking, Ep and Ek of the centre of mass change roughly out of phase, we assumed in the simulation that Ep=–sinx and Ek=sin(x–α), where the phase shift α=0° when the Epand Ekcurves are exactly 180° out of phase. In previous studies (Cavagna et al., 1983; Griffin et al., 1999), this phase shift was defined as α=360°∆t/τ, where ∆t is the difference between the time at which Ekf is at a maximum and the time at which Epwas at a minimum and τ is the step period. At low and intermediate walking speeds, such as those considered in the present study, α >0°; at high walking speeds (>6 km h–1), α<0° (Cavagna et al., 1983). For most walking speeds, 45°>α>–45°.
The total mechanical energy of the centre of mass Ecgwas calculated as the algebraic sum of the curves for Epand Ek:
Ecg = –sinx + sin(x – α) . (3) The effect of a change in the phase shift α is shown in Fig. 1. Ecg attains a maximum or a minimum when its derivative is zero, i.e. when cosx=cos(x–α). In contrast, cosx=cos(2π–x)=cos(–x), so the angle for a maximum of Ecg will be (π+α/2) and the angle for a minimum of Ecgwill be α/2 (Fig. 1). Substituting these angles into Equation 3, one obtains the maximum and minimum values of the total mechanical energy in the simulation, i.e. Ecg,max=2sin(α/2) and Ecg,min=–2sin(α/2). The changes in Rstepin the simulation with the phase shift α(Fig. 2, dotted line) can then be defined as:
Rstep = 1 – W+
ext/(W+v+ W+f) =
1 – [2|2sin(α/2)|/(2 + 2)] = 1 – |sin(α/2)| . (4) The recovery of mechanical energy at each instant during one cycle, r(x), was calculated in the simulation according to Equation 2 by substituting |∆Ep(t)|, |∆Ek(t)| and |∆Ecg(t)| with the absolute value of the derivative of the functions: –sinx, sin(x–α) and –sinx+sin(x–α), for x=0–360° in increments of 1° (Fig. 1, upper panels, thick lines):
r(x) = 1 – [|–cosx + cos(x – α)|]/[|–cosx| + |cos(x – α)|] . (5) The calculated value of r(x) for sinusoidal curves was equal to that measured on the same sinusoidal curves with the procedure used to determine r(t) on the experimental tracings. If the two sinusoidal curves, representing Ep and Ek, are exactly out of phase (α=0°) and have the same amplitude, Ecg is constant, W+
ext(x) is zero and r(x)=1 over the whole cycle. If the two sinusoidal curves are exactly out of phase (α=0°) but have different amplitudes, Ecg(x) oscillates in phase with the curve of larger amplitude, Wext(x)≠0, and r(x) decreases below unity, maintaining a constant value over the cycle. For example, if the amplitude of Ep is half that of Ek, r(x)=1–(1/3)=0.66 (Equation 2).
attained when ∆Ecg(x) is zero (i.e. Ecgattains a maximum or a minimum and Ep=Ek).
The mean value of r over the whole step cycle was calculated, both for the simulation, r(x), and for the experimental tracings, r(t), as the time integral divided by the period: Rint=[∫0
z
r(u)du]/z where z=360° for the simulation and z=τ for the experimental tracings. In the case of two sinusoidal curves of different amplitude and exactly out of phase (α=0o),
Rint=Rstep(Rstepis defined as in Equation 1). In the case of two sinusoidal curves of the same amplitude but with a phase shift
αbetween the time at which Ekis at a maximum and the time at which Epis at a minimum, the relationship between Rintand α (Fig. 2, continuous line) is given by:
[image:4.612.203.559.74.380.2]Rint = 1 – (1/π){|α| – 2tg(|α|/2)loge[sin(|α|/2)]} , (6) where α is expressed in rad. Equation 6 is obtained by integrating r(x), as defined in Equation 5, and dividing the result by 2π. In the simulation, Rintis not equal to Rstepexcept when the curves are exactly out of phase (α=0°) or exactly in phase (α=180°), or when α=±96.3° (Fig. 2). When the phase Fig. 1. Simulation of the transduction
between kinetic and potential energy of the centre of mass when the maximum in kinetic energy is set to lag behind the minimum in potential energy by a value
of α=10° (A) and α=20° (B), which
covers the range of mean experimental values measured in this study during
walking (see values of αin Table 1). α
is the phase shift between the maximum
of the kinetic energy Ek and the
minimum of the potential energy Ep.
Upper panels: the total energy of the
centre of mass of the body (Ecg, thin
continuous line) is simulated as the sum of two sine waves representing
its potential energy (Ep=–sinx; dotted
lines) and kinetic energy [Ek=sin(x–10°)
in A, and Ek=sin(x–20°) in B: broken
lines) during a step cycle, expressed in degrees. The fraction of the mechanical energy recovered at each instant by the pendular transduction within the cycle, r(x) (thick lines and right-hand ordinates), is calculated according to Equation 5 from the relative changes in
the Ek, Ep and Ecgcurves. r(x) is zero
when the changes in the Ek and Ep
curves have the same sign, and attains
unity when the Ecg curve is at a maximum or at a minimum. Lower panels: the area under the r(x) curve divided by 360°, defined as
Rint(x)=[∫0
x
r(u)du]/360°, attains the value Rint(360°)=Rintat the end of each cycle. Time-averaged Rintis less than Rstep, calculated according to
Equation 1 from the total amplitude reached by the Ep, Ekand Ecgcurves during the cycle. The relationship between Rintand Rstepfor different
values of αis shown in Fig. 2.
0 0.2 0.4 0.6 0.8 1
0 90 180 270 360
x (degrees) 0 0.2 0.4 0.6 0.8 1
0 90 180 270 360
Cumulati v e re co v er y, Rin t (x ) x (degrees) –1 –0.5 0 0.5 1 0 0.2 0.4 0.6 0.8 1
0 90 180 270 360
r(x) Ek Ep
Ecg S imulat ed e n er g y, E k ,E p a n d Ecg In sta n ta n eou s re co v er y, r (x ) –1 –0.5 0 0.5 1 0 0.2 0.4 0.6 0.8 1
0 90 180 270 360
r(x) Ek Ep
Ecg S imulat ed e n er g y, E k ,E p a n d Ecg In sta n ta n eou s re co v er y, r (x ) Cumulati v e re co v er y, R in t (x )
A
B
Rstep=0.91
Rint=0.81
Rstep=0.83
Rint=0.69
0 0.2 0.4 0.6 0.8 1
–180 –90 0 90 180
Reco
v
ery
α (degrees)
Rstep
Rint
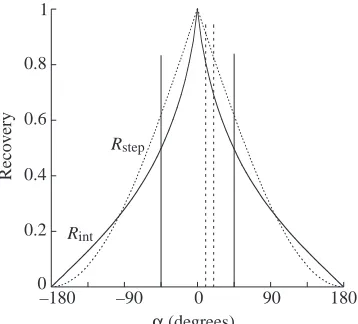
Fig. 2. Simulation: effect of the phase shift α. The fraction of the
mechanical energy recovered through the pendular transduction in
the simulation, calculated as Rstep(dotted line, Equation 4) or as Rint
(solid line, Equation 6) is plotted as a function of the phase shift α
between the curves Ep=–sinx and Ek=sin(x–α) illustrated in Fig. 1.
The two vertical continuous lines encompass the values of αattained
during all speeds of walking; αdecreases from approximately 45° at
the lowest speeds to approximately –45° at highest speeds (Cavagna et al., 1983). The two vertical broken lines encompass the values of
α (10°–20°) observed in this study (Table 1). Note that Rstep≥Rint
[image:4.612.73.252.575.737.2]shift varies in the simulation as in human walking (45°>α>–45°), Rint≤Rstepand both decrease with |α|.
Average recordings
To compare the energy transduction within the step in different subjects, the step cycle was divided into four periods: the two periods with r(t)=0 (tpk+and tpk–) and the two with r(t)≠0 (Fig. 1). The mean values for the four periods are given in Table 1 for each experimental condition. The abscissa of each of the two phases with r(t)≠0 was normalized from zero to one, and an average of r(t) was calculated at discrete intervals along the normalized abscissa (0.01). The mean step cycle was then reconstructed using on the abscissa, the mean values of the four time intervals (Table 1, Figs 4, 6).
In some recordings, tpk+ and/or tpk– were zero, and the separation between the two periods with r(t)≠0 was made using the minimum of r(t) or, when oscillations where present (see Fig. 7), the maximum and/or the minimum of Epand Ek. Often r(t) failed to attain unity in spite of the fact that Ecgattained a maximum or a minimum (i.e. |∆Ecg(t)|=0) because of the discrete time periods used to calculate |∆Ecg(t)| and/or the averaging of the curves (see Figs 3–7).
Results
Time course of energy recovery within the step of unloaded subjects
Typical recordings showing r(t) during an unloaded step together with the simultaneous changes in Ep, Ekand Ecgare given in Fig. 3A for a European subject and in Fig. 3B for an African subject. Similar to the trend shown by the simulation (Fig. 1), r(t)=0 during two periods. The first period, tpk+, occurs at the beginning of the lift of the centre of mass, when both Ep and Ek increase simultaneously as a result of positive work done by the muscular force. The second period, tpk–, occurs
just after the maximum of Ep, when both Epand Ekdecrease simultaneously as a result of negative work done by the muscular force. The succession of events, both in the simulation and during the walking step, is therefore: (i) tpk+to begin the upward displacement and complete the acceleration forwards; (ii) some transduction from Ekto Eptaking place up to the end of the lift of the centre of mass, during a period henceforth referred to as ttr,up; (iii) tpk–to begin the downward displacement of the centre of mass and complete the deceleration forwards; (iv) some transduction from Ep to Ek taking place up to the end of the descent, during a period henceforth referred to as ttr,down. Both tpk+and tpk–start at the extremes of the vertical oscillation of the centre of mass of the body.
A comparison of Figs 1 and 3 shows that, in contrast to the simulation, the changes in r(t) during ttr,up and ttr,downare not symmetrical. During ttr,up, when the body rides upwards on the front leg and the point of application of force moves forward from heel towards the toe of the supporting foot (Elftman, 1939), r(t) increases steeply to a plateau and then falls abruptly to zero. Three peaks are usually observed on the plateau corresponding to a more or less pronounced oscillation of Ecg. During ttr,down, when the body ‘falls forwards’, r(t) changes in a manner more similar to the simulation, reaching a single peak and forming a bell-shaped curve.
[image:5.612.54.569.85.201.2]In the simulation, Ecgattains one maximum (during the lift) and one minimum (during the fall). During the walking step, in contrast, Ecg usually attains two peaks: the first at the beginning of the lift, the second at the end of the lift. The first peak of Ecgoccurs near the maximum of Ek, which coincides with the end of tpk+; the second peak of Ecg occurs near the maximum of Ep, which coincides with the beginning of tpk–. The positive increment in Ecgto the first peak (increment a) corresponds to external positive work done by the muscular force mainly to increase the kinetic energy of the centre of
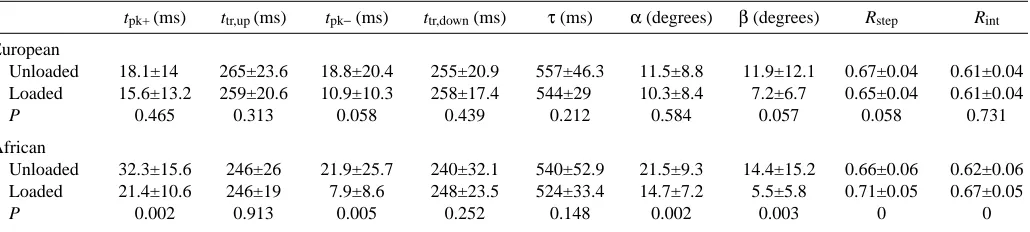
Table 1. Experimental values of the parameters of the walking step
tpk+ (ms) ttr,up (ms) tpk−(ms) ttr,down(ms) τ (ms) α (degrees) β (degrees) Rstep Rint
European
Unloaded 18.1±14 265±23.6 18.8±20.4 255±20.9 557±46.3 11.5±8.8 11.9±12.1 0.67±0.04 0.61±0.04 Loaded 15.6±13.2 259±20.6 10.9±10.3 258±17.4 544±29 10.3±8.4 7.2±6.7 0.65±0.04 0.61±0.04
P 0.465 0.313 0.058 0.439 0.212 0.584 0.057 0.058 0.731
African
Unloaded 32.3±15.6 246±26 21.9±25.7 240±32.1 540±52.9 21.5±9.3 14.4±15.2 0.66±0.06 0.62±0.06 Loaded 21.4±10.6 246±19 7.9±8.6 248±23.5 524±33.4 14.7±7.2 5.5±5.8 0.71±0.05 0.67±0.05
P 0.002 0.913 0.005 0.252 0.148 0.002 0.003 0 0
tpk+, period when Ekand Epincrease simultaneously; ttr,up, period of Ek-Eptransduction during the lift of the centre of mass; tpk-, period when
Ekand Epdecrease simultaneously; ttr,down, period of Ek–Eptransduction during the descent of the centre of mass; τ, step period; α, phase shift
between the maximum of Ekand the minimum of Ep; β, phase shift between the minimum of Ekand the maximum of Ep; Rstep, recovery of
mechanical energy calculated from the sum of the positive increments over the whole step of Ek, Ep and Ecg; Rint, recovery of mechanical
energy calculated from the increments of kinetic energy Ek, gravitational potential energy Ep and total mechanical energy at the centre of mass
Ecg, at each instant during the step.
Values are means ±S.D. (N=32).
mass beyond the level attained as a result of the decrement in potential energy. The end of increment a occurs during the time of double contact, tdc. The positive increment in Ecg to the second peak (increment b) corresponds to positive work done to complete the lift of the centre of mass to a level greater than that attained as a result of the decrement in kinetic energy. Increment b occurs during the time of single contact, tsc. The sum of these two positive increments of Ecg(a+b) represents the positive external work done at each step to translate the centre of mass of the body in the sagittal plane (Cavagna et al., 1963; Cavagna and Margaria, 1966).
Average r(t) recordings, constructed as described in Materials and methods, are given in Fig. 4A for unloaded European subjects (broken line), for unloaded European women (thin continuous line) and for unloaded African women (thick line). The area below the average r(t) recordings, divided by the mean step period, is given by the curves in Fig. 4B (to be compared with the bottom graphs of Fig. 1). These curves show that: (i) the relative amount of energy recovered during ttr,up is on average larger than that recovered during ttr,down in both European and African subjects; (ii) this asymmetry is smaller in African women than in the European subjects as a result of less complete pendular transduction during ttr,up and more complete transduction during ttr,down, which is a consequence of the more pronounced ‘shoulder’ on the r(t) recording at the beginning of the descent of the centre of mass; (iii) the recovery at the end of the step period, Rint, is equal in African women and in European subjects; and (iv) no appreciable difference was found between all European subjects (male and female) and the European women.
0 0.2 0.4 0.6 0.8 1
0 0.2 0.4 0.6
r(
t) 50 J
Ecg
Ep
Ek
ttr,up tpk–
tpk+ ttr,down
0 0.2 0.4 0.6 0.8 1
0 0.2 0.4 0.6
Time (s)
50 J
Ecg
Ep
Ek
ttr,up tpk– ttr,down tpk+
r(
t)
B
A
Rstep=0.63
Rint=0.59
Rstep=0.68
[image:6.612.319.551.74.327.2]Rint=0.60
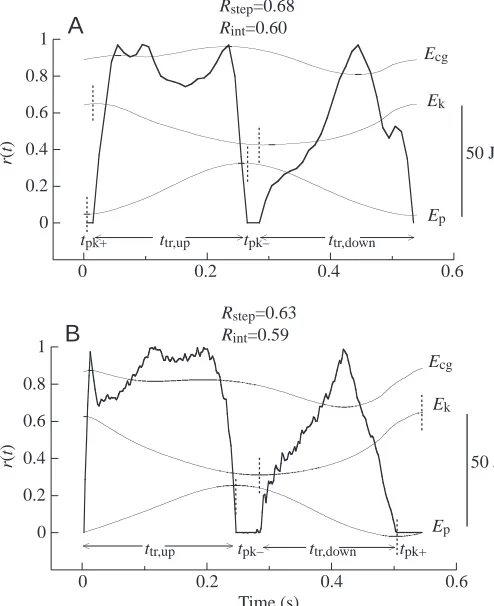
Fig. 3. Typical experimental recordings of unloaded walking. The fraction of the mechanical energy recovered during unloaded walking at each instant of the step cycle [r(t), thick lines] is superimposed on
the mechanical energy changes of the centre of mass (Ep,
gravitational potential energy; Ek, kinetic energy; and Ecg=Ep+Ek,
where Ecgis the total mechanical energy of the centre of mass, thin
lines). Typical record obtained from (A) a European subject (male,
66.2 kg, 4.86 km h–1) and (B) an African woman (Kikuyu, 83.3 kg,
4.85 km h–1). The vertical broken lines on the Ek and Ep curves
delimit the periods when the instantaneous recovery of mechanical
energy r(t) is zero, indicated on the figure as tpk+ when Ep and Ek
increase simultaneously, and as tpk– when Ep and Ek decrease
simultaneously. The periods during which energy transduction
between Epand Ekoccurs are indicated as ttr,upduring the lift of the
centre of mass and ttr,downduring the descent of the centre of mass. As
in the simulation, Rstep is greater than Rint but, in contrast to the
simulation, the r(t) curves recorded during the rise and fall of the centre of mass during walking are not symmetrical see (Fig. 1).
0 0.2 0.4 0.6 0.8 1
0 0.2 0.4 0.6
r(
t)
0 0.2 0.4 0.6 0.8
0 0.2 0.4 0.6
Time (s) Rint
(t
)
A
B
Fig. 4. Unloaded walking. (A) Average curves of the instantaneous recovery of mechanical energy r(t) for the African women (thick continuous line, mean of 32 steps by four subjects), the European women (thin continuous line, mean of 17 steps by five subjects) and all European subjects (males and females, broken line, average of 32 steps on ten subjects). The time-average of the standard deviation of the mean was less than 25% of r(t) during the lift of the centre of
mass (ttr,upin Fig. 3) and less than 35% during its descent (ttr,down).
(B) The area under the average r(t) curve divided by the step period
{Rint(t)=[∫0
τ
r(u)du]/τ}attains a value of Rint(τ)=Rintat the end of the
[image:6.612.46.293.76.379.2]The mean values of Rintand Rstep(Equation 1) are given in Table 1. It can be seen that Rint<Rstep as predicted by the simulation, both in the Europeans and in the African women. However, both Rintand Rstepmeasured during the walking step are smaller than those predicted by the simulation (Fig. 2).
Effect of loading
[image:7.612.329.554.337.590.2]Typical recordings showing r(t) within a step of walking with a load, together with the simultaneous changes in Ep, Ek and Ecg, are given in Fig. 5A for a European subject and in Fig. 5B for an African subject. The average r(t) recordings in Fig. 6 compare the load-carrying skills of African women and European subjects.
In all subjects, loading tends to decrease the duration of tpk– and, to a lesser extent, the duration of tpk+: the reductions are, however, not significant in Europeans subjects whereas they are significant in African women, for whom tpk–decreases by approximately two-thirds (Table 1). Since the step period τ is not significantly decreased by loading (by only 2–3%, see Table 1), the phase shifts α=360°tpk+/τ and β=360°tpk–/τ change in a manner similar to tpk+and tpk–. Loading therefore
tends to increase the transduction between potential and kinetic energy by making the two curves more exactly out of phase, particularly during the swing phase (single-contact phase) of the step. As mentioned above, the effect is significant in African women and not in European subjects.
Another effect of loading results from a change in the shape of the potential and kinetic energy curves. This is shown by a more pronounced ‘shoulder’ of the r(t) record during the first part of the descent of the centre of mass. This effect is also more pronounced in the African women than in the European subjects (Fig. 6).
Both these effects of loading tend to increase the fraction of the total mechanical energy changes of the centre of mass that is recovered by the pendular mechanism in the African women. This results in an increase in Rint by the end of the step cycle compared with the European subjects (Fig. 6). The increase in Rintin the African women during load-carrying is approximately equal to the increase in Rstep (Table 1). It should be stressed that the effect of load-carrying occurs mainly during the swing phase of the step, when (more
Fig. 5. Typical experimental recordings of loaded walking for (A) a
European subject (male, 65.6 kg, 3.71 km h–1, loaded with 19.3 kg)
and (B) an African woman (Luo, 83.5 kg, 3.95 km h–1, loaded with
19.5 kg). For further details, see legend to Fig. 3. Note that in the
African subject, loading results in a reduction in tpk– and in an
increase in r(t) at the beginning of the descent of the centre of mass (ttr,down).
0 0.2 0.4 0.6 0.8 1
0 0.2 0.4 0.6
50 J
Ecg
Ep
Ek
ttr,up tpk–
tpk+ ttr,down
0 0.2 0.4 0.6 0.8 1
0 0.2 0.4 0.6
Time (s)
50 J
Ecg
Ep
Ek
ttr,up tpk– ttr,down tpk+
r(
t)
r(
t)
A
B
Rstep=0.62
Rint=0.59
Rstep=0.72
Rint=0.68
Fig. 6. Loaded walking. (A) Average curves of the instantaneous recovery of mechanical energy r(t) for the African women (thick continuous line, mean of 32 steps by four subjects), the European women (thin continuous line, mean of 14 steps by five subjects) and all European subjects (males and females, dotted line, mean of 32 steps by ten subjects). A comparison with Fig. 4 shows that, in all
subjects, loading decreases tpk–and increases r(t) at the beginning of
the descent of the centre of mass (ttr,down), but that this results in a
net increase in Rintin the African women only (final value attained
by the thick line at the end of the step in B). The corresponding mean values of the parameters for all European subjects and the African women are given in Table 1 (loaded). For further details, see legend to Fig. 4.
0 0.2 0.4 0.6 0.8 1
0 0.2 0.4 0.6
0 0.2 0.4 0.6 0.8
0 0.2 0.4 0.6
Time (s)
r(
t)
Rint
(t
)
A
[image:7.612.53.299.348.655.2]frequently in African women) loading sometimes results in a tpk–value of zero with a continuous high levels of transduction between potential and kinetic energy of the centre of mass (Fig. 7).
Discussion Normal walking
The present study provides (i) a new parameter, Rint, which summarizes the transduction between Epand Ekover the whole step cycle and (ii) the possibility of a continuous analysis of such transduction during a walking step.
The time-average Rint is related but not equal to Rstep, previously determined from the total changes in Ep, Ekf and Ecg(see equation 1 in Cavagna et al., 1976). As shown by the simulation, Rintand Rstepare affected in different ways by a phase shift between sinusoidal curves representing Ep and Ek (Fig. 2). By contrast, the experiments analyzed in the present study suggest that Rint and Rstep change in a similar manner when a load is applied to the trunk during walking (Table 1).
Rint, Rstep and W+ext were calculated for the 11 European subjects of the present study during unloaded walking at different speeds (Fig. 8). On average, Rintis less than Rstepup to approximately 7 km h–1, after which the trend is reversed, probably as a result of a relative change in the amplitude and shape of the Epand Ekcurves with the speed of walking. Both Rint and Rstep attain a maximum at intermediate speeds: approximately 5 km h–1for R
stepand 6 km h–1for Rint, whereas W+
extattains a minimum at approximately 4 km h–1. This result confirms that maximal pendular transduction takes place at a speed higher than the most economical speed of walking, as has become progressively more evident as more data are
collected (Willems et al., 1995). The speed difference between the minimum of W+
extand the maximum of Rstepis due to the fact that, when the speed increases above 4 km h–1, the increase in W+
ext from its minimum is smaller than the continuous increase in W+
v+W+f; as a consequence, the ratio W+ext/ (W+
v+W+f) decreases and Rstep increases (Equation 1). The same argument is probably valid for Rintwhich, however, does not have a simple relationship with Rstep, not only for the reasons explained by the simulation (Fig. 2), but also because of the changes in amplitude and shape of the Epand Ekcurves with speed. In general, both Rstep and Rintrepresent an index of the ability of the pendular mechanism to minimize the impact of W+
v+W+fon W+ext. The result is that the minimum of W+
ext is attained at a lower speed, when and because W+
v+W+f is smaller, in spite of the fact that the pendular mechanism works better at a higher speed, when W+
v+W+fis larger.
Our within-step analysis of pendular energy transduction shows that muscular intervention may be divided into two components: (i) when the transduction between Epand Ekis zero (i.e. during tpk+, to increase both Epand Ekand during 0
0.2 0.4 0.6 0.8 1
0 0.2 0.4 0.6
50 J
Ecg
Ep
Ek
ttr,up ttr,down tpk+
Time (s)
r(
t)
Rstep=0.78
[image:8.612.49.286.75.225.2]Rint=0.76
Fig. 7. Recordings such as those depicted in Fig. 5, showing an
extreme case in which loading results in tpk–being reduced to zero
and in an increase in the instantaneous recovery of mechanical energy r(t) during the descent of the centre of mass to a level equal to that attained during the lift. This leads to very high values of pendular recovery during the step (African woman, Luo, 88.9 kg,
4.5 km h–1, loaded with 19.1 kg). For further details, see legend to
Fig. 5.
0 0.2 0.4 0.6 0.8 1
0 10
3 18
18
20 17
50 30
20 12
18
18
11 15
14
6 4
Mean forward speed (km h–1)
Rstep
W+ext
Rint
R
ec
o
v
er
y
and w
ork (
J k
g
–
1 m
–
1)
2 4 6 8
Fig. 8. The pendular recovery of mechanical energy, defined by
equation 1 (Rstep, open circles) and by equation 6 (Rint, open
squares), and the external work done per unit distance (W+
ext, filled
circles) plotted as a function of speed during unloaded walking for
the 11 European subjects of this study. Values are means ±S.D. (N is
given by the numbers near the filled circles) for data grouped into the following intervals along the abscissa: <2, 2 to <2.5,…., 8.5 to <9,
>9 km h–1. Lines are fitted using a third-order polynomial fit
(r2=0.98, KaleidaGraph 3.5). The crosses and the dotted line show
how Rstepchanges when the kinetic energy of vertical motion of the
centre of mass, Ekv, is taken into account in the calculation of W+v
and W+k (see text). Note that Wext attains a minimum at a speed
tpk–, to decrease both Ep and Ek), and (ii) during the transduction between Epand Ek, when the muscles both release and absorb energy (during ttr,up and ttr,down). The first component is due to a shift between the Epand Ekcurves away from being exactly out of phase (180°), whereas the second component is due to a difference in the amplitude and shape of the two curves. It is now possible to assess how energy recovery through pendular transduction is affected by the phase shift between the Epand Ekcurves and how it is affected by the difference in shape/amplitude of the two curves. An example is discussed below for loaded compared with unloaded walking.
An obvious reason for failure to recover energy using the pendular mechanism is a phase shift of other than 180° between the potential and kinetic energy curves. Why is the value of 180° not maintained? Although a net input of energy during tpk+ to increase both Ep and Ekis to be expected, to overcome the energy lost by friction in the pendular motion, the necessity of a net absorption of both Epand Ekduring tpk– is less clear. tpk+ occurs mostly during the period of double contact and corresponds to the forward and upward push of the back foot as it is about to leave the ground (Cavagna and Margaria, 1966). Mochon and McMahon (1980) showed that the action of muscles during the double-support phase establishes the initial conditions for the succeeding mainly ballistic phase of the step, which takes place during the single contact. tpk–on the other hand occurs during the single-contact phase and corresponds to an unexplained waste of energy due to the fact that the maximum of Ep is attained before the minimum of Ek.
During the periods when energy transduction does occur between Epand Ek, the failure of r(t) to attain a value of unity implies that negative and positive work is done by the muscular force to absorb or deliver energy because the Epand Ek curves are not mirror images. During normal, unloaded walking, this failure is smaller during ttr,up, corresponding to the lift of the centre of mass, than during ttr,down, corresponding to the descent of the centre of mass. This is unexpected because, as mentioned above, the lift is initiated by the double-support phase of the step, whereas the descent is initiated with the whole body pole-vaulting over the supporting leg in the ballistic single-contact phase of the step, i.e. when the inverted pendulum model should apply. The ‘square’ shape of r(t) rising abruptly to a plateau during ttr,up, results in an increase of approximately 60% in the total fractional energy recovered (Rint). The less effective ‘triangular’ shape of r(t) during ttr,downis due to a slower rise to unity, during which the gravitational potential energy actively absorbed by the muscles and elastic structures is greater than the simultaneous increase in kinetic energy. The contrary is true for the shorter period after the peak of r(t): energy must now be added to increase Ek beyond the level attained due to the decrease in Ep(Fig. 3).
Walking with loads
One effect of loading is to improve the pendular transduction
between potential and kinetic energy of the centre of mass by making the changes in Epand Ekmore exactly out of phase. This is shown by the reduction in both tpk+ and tpk–, which is significant in the African women only (Table 1). The reduction is relatively larger for tpk–than tpk+, suggesting that the period during which both Epand Ekdecrease as a result of negative work being done by the muscular force is more easily reduced than the period during which energy is added to the system. In fact, under some conditions, tpk–, but not tpk+, can disappear (Fig. 7).
Of the two periods when an energy transduction occurs between Epand Ek, loading affects mainly ttr,down, when the body ‘falls forwards’ on the supporting leg (Figs 5, 6). Loading favors the transduction of Ep to Ek, so that a smaller amount of Ep has to be absorbed by the muscles (compare the negative slopes of the Ecg curves during ttr,down in Figs 3 and 5). This is shown by a faster increase in r(t) at the beginning of the descent of the centre of mass, which is particularly evident in the African women (Fig. 6). In the extreme case illustrated in Fig. 7, loading results both in the disappearance of tpk– (discussed above), and in a transduction between Epand Ekduring the descent of the centre of mass similar to that attained during the lift, resulting in a plateau at a high value of r(t). It is quite possible that the differences described between European subjects and African women in the present study may derive in part from the location of the mass support: head-supported in the African women and shoulder-supported in the European subjects.
Concluding remarks
List of symbols
Ecg total mechanical energy of the centre of mass: Ecg=Ek+Ep
Ek kinetic energy of the centre of mass: Ek= Ekf+Ekv Ekf kinetic energy of forward motion of the centre of
mass: Ekf=0.5MVf2
Ekv kinetic energy of vertical motion of the centre of mass: Ekv=0.5MVv2
Ep gravitational potential energy of the centre of mass
g acceleration due to gravity
M body mass
r(t) instantaneous recovery of mechanical energy calculated from the absolute value of the increments, both positive and negative, of Ep, Ek and Ecgduring the step (Equation 2)
r(x) instantaneous recovery of mechanical energy calculated from the absolute value of the derivative of the functions simulating Ep, Ekand Ecgduring a cycle (Equation 5)
R recovery
Rint mean value over one period of r(x) (simulation) or r(t) (experimental data); for the simulation: Rint(x)=[∫0
x
r(u)du]/360° and Rint(360°)=Rint; for the experimental data: Rint(t)=[∫0τr(u)du]/τand Rint(τ)=Rint
Rstep recovery of mechanical energy calculated from the sum over one step of the positive increments of Ep, Ekand Ecg(Equation 1)
t time
tdc fraction of the step period τduring which both feet are in contact with the ground (double contact)
tpk+ difference between the time at which Ekis
maximum and the time at which Epis minimum. Ekand Epincrease simultaneously during tpk+ tpk– difference between the time at which Ekis
minimum and the time at which Epis maximum. Ekand Epdecrease simultaneously during tpk– tsc fraction of the period τduring which one foot only
contacts the ground (single contact)
ttr,down time of Ek–Eptransduction during the descent of the centre of mass
ttr,up time of Ek–Eptransduction during the lift of the centre of mass
Vf instantaneous velocity of forward motion of the centre of mass
Vv instantaneous velocity of vertical motion of the centre of mass
Wext external work done during each step calculated from the changes in mechanical energy of the centre of
mass, Ecg=Ep+Ekf+Ekv. W+extis the sum of the positive increments of Ecgduring τ
Wf work calculated from the forward speed changes of the centre of mass during each step. W+
fis the sum of the positive increments of Ekfduring τ Wk work calculated from the kinetic energy changes of
the centre of mass during each step. W+ kis the sum of the positive increments of Ekduring τ Wv work calculated from the potential energy changes
of the centre of mass during each step. W+ vis the sum of the positive increments of Epduring τ α phase shift between the maximum of Ekand the
minimum of Ep; α=360°tpk+/τ, where tpk+is the difference between the time at which Ekis a maximum and the time at which Epis a minimum β phase shift between the minimum of Ekand the
maximum of Ep; β=360°tpk–/τ, where tpk–is the difference between the time at which Ekis a minimum and the time at which Epis a maximum τ step period, i.e. period of repeating change in the
motion of the centre of mass: τ=tsc+tdc
The authors would like to thank Dr Luigi Tremolada for his analysis of the simulation (Equations 4–6).
References
Cavagna, G. A. (1975). Force platforms as ergometers. J. Appl. Physiol. 39,
174-179.
Cavagna, G. A. and Margaria, R. (1966). Mechanics of walking. J. Appl. Physiol. 21, 271-278.
Cavagna, G. A., Franzetti, P. and Fuchimoto, T. (1983). The mechanics of
walking in children. J. Physiol., Lond. 343, 323-339.
Cavagna, G. A., Komarek, L. and Mazzoleni, S. (1971). The mechanics of
sprint running. J. Physiol., Lond. 217, 709-721.
Cavagna, G. A., Saibene, F. P. and Margaria, R. (1963). External work in
walking. J. Appl. Physiol. 18, 1-9.
Cavagna, G. A., Thys, H. and Zamboni, A. (1976). The sources of
external work in level walking and running. J. Physiol., Lond. 262, 639-657.
Elftman, H. (1939). Force and energy changes in the leg during walking. Am. J. Physiol. 125, 339-356.
Griffin, T. M. and Kram, R. (2000). Penguin waddling is not wasteful. Nature 408, 929.
Griffin, T. M., Tolani, N. A. and Kram, R. (1999). Walking in simulated
reduced gravity: mechanical energy fluctuations and transduction. J. Appl.
Physiol. 86, 383-390.
Heglund, N. C., Willems, P. A., Penta, M. and Cavagna, G. A. (1995).
Energy-saving gait mechanics with head-supported loads. Nature 375, 52-54.
Maloiy, G. M. O., Heglund, N. C., Prager, L. M., Cavagna, G. A. and Taylor, C. R. (1986). Energetic cost of carrying loads: have African women
discovered an economic way? Nature 319, 668-669.
Mochon, S. and McMahon, T. A. (1980). Ballistic walking. J. Biomech. 13,
49-57.
Willems, P. A., Cavagna, G. A. and Heglund, N. C. (1995). External,