warwick.ac.uk/lib-publications
A Thesis Submitted for the Degree of PhD at the University of Warwick
Permanent WRAP URL:
http://wrap.warwick.ac.uk/79987
Copyright and reuse:
This thesis is made available online and is protected by original copyright. Please scroll down to view the document itself.
Please refer to the repository record for this item for information to help you to cite it. Our policy information is available from the repository home page.
WA1(WJCK
The Management of
Manufacturing Trade-offs
by
Giovani Jose Caetano da Silveira
Thesis submitted for the degree of Doctor of Philosophy
Warwick Business School
University of Warwick
TABLE OF CONTENTS
INTRODUCTION
I BACKGROUND ... 1
11 JUSTlFlCATlON ... ·· .. · ... · .. · ... 3
III RESEARCH STRUCTURE ... 4
PART I· LITERATURE REVIEW CHAPTERl·MANUFACTURlNGSTRATEGY INTRODUCTION ... 8
1.1 MANUFACTURING STRATEGY CONCEPTS ... 9
1.1.1 Focused Manufacturing ... 10
1.1.2 The 4 Stages of Manufacturing Strategic Role ... 12
1.1.3 The Product-Process Matrix ... 14
1.1.4 Qualifying and Order-Winning Criteria ... 16
1.2 THE MANUFACTURING STRATEGY PROCESS ... 17
1.3 THE MANUFACTURING STRATEGY CONlENT ... 19
1.3.1 Manufacturing Mission ... 20
1.3.2 Manufacturing Strategy Objectives ... 20
1.3.3 Manufacturing Decision Areas ... 22
1.4 PRODUCTION CAPABll.1TIES ... 24
1.4.1 The Resource-Based Theory ... 24
1.4.2 Resources and Capabilities ... 25
1.4.3 Production Capabilities and Competencies ... 26
1.4.4 Production Competence and Business Performance ... 27
1.5 CHAPTER CONCLUSIONS ... 29
CHAPTER 2· MANUFACTURING FLEXmILITY INTRODUCTION ... 32
2.1 CONCEPT AND JUSTIFlCA TlON ... 32
2.1.1 The Concept of Manufacturing Flexibility ... 32
2.1.2 Change ... 34
2.1.3 Uncertainty ... 35
2.1.4 Variety ... 36
2.1.5 Flexibility and Change ... 37
2.2 MANUFACTURING FLExIBILlTY THEORy ... 38
2.2.1 Flexibility Types ... 38
2.2.2 Flexibility Capabilities ... 40
2.2.3 Flexibility Dimensions ... 41
2.2.4 Flexibility Assessment: Areas and Levels ... .42
2.3 F'LExmll.rrY TEcHNOLOGIES AND METHODOLOGIES ... 44
2.3.1 Flexibility Technologies ... 45
2.3.2 Flexibility Methodologies ... 51
2.4 F'LExmarrYMEASUREMENT ... 54
2.4.1 Required. Potential and Actual Flexibility ... 54
2.4.2 Flexibility Measures ... 56
2.5 FLExmarrY AND MANUFACTURING STRATEGy ... 59
CHAPTER 3· MANUFACTURING TRADE·OFFS
INTRODUCTION ... 63
3.1 THE CONCEPT OF TRADE-OFFS ... 63
3.2 THE THEORY OF MANUFACJ'URING TRADE-OFFS ... 64
3.2.1 The Founding Theory ... 65
3.2.2 World Class Manufacturing ... 66
3.2.3 The Dynamics Theory ... 67
3.2.4 Section Conclusions ... 70
3.3 MANUFACJ'URINGOBJECTIVES 'TRADE-OFFS ... 72
3.3.1 Flexibility and Cost ... 72
3.3.2 Flexibility and Quality ... 75
3.3.3 Flexibility and Speed ... 76
3.3.4 Flexibility and Dependability ... 77
3.3.5 Cost and Quality ... : .. 78
3.3.6 Cost and Speed ... 79
3.3.7 Cost and Dependability ... 80
3.3.8 Quality and Speed ... 82
3.3.9 Quality and Dependability ... 82
3.3.10 Speed and Dependability ... 83
3.3.11 Section Conclusions ... 84
3.4 CHAPTER CONCLUSIONS ... 85
PART n • RESEARCH MEmODOLOGY CHAPTER 4· RESEARCH FRAMEWORK INTRODUCTION ... 90
4.1 THE REsEARCH MODEL ... 90
4.1.1 Manufacturing Objectives Trade-offs ... 90
4.1.2 Dynamic Trade-offs: Moving the Pivot ... 91
4.1.3 Production Capabilities ... 92
4.1.4 Flexibility Capabilities ... 93
4.1.5 Manufacturing Resources ... 94
4.2 REsEARCH 08JECJ'IVES ... 95
4.3 RESEARCH PROPOSmONS ... 96
CHAPTER 5 • RESEARCH MEmODS INTRODUCTION ... 99
5.1 OPERATIONS MANAGEMENT REsEARCH ... 99
5.1.1 The Research Cycle ... 100
5.1.2 Shoncomings in Operations Management Research ... JOJ 5.1.3 Strategies of Management Research ... 102
5.1.4 Section Conclusions ... 103
5.2 QUANTITATIVE VERSUS QUALITATIVE REsEARCH APPROACHES ... 104
5.2.1 The Qualitative Research Approach ... 104
5.2.2 The Quantitative Research Approach ... J05 5.2.3 The Choice of a Research Approach ... 106
5.3 REsEARCH DESIGN ... 108
5.3.1 Research Design Paradigms ... 108
5.3.2 Comparing Research Design Paradigms ... J 11 5.3.3 The Choice of a Research Design Paradigm ... J 13 5.3.4 Multiple Case Studies ... J 14 5.4 FIELDWORK ... 115
5.5 DATACOu...ECTION ... : ... • ... · ... 118
5.5.1 Sources of Evidence ... 118
5.5.2 Principles of Data Collection ... 120
5.6 DATA ANALYSIS ... 121
5.6.1 Within-Case Analysis ... 122
5.6.2 Cross-Case Analysis ... 122
5.6.3 Shaping Hypotheses ... 123
5.6.4 Data Analysis Report ... 124
5.6.5 Section Conclusions ... 125
5.7 CHAPTER CONCLUSIONS ... 125
CHAPTER 6· RESEARCH DESIGN INTRODUCTION ... 128
6.1 THE DATA C0lJ.EC110N PROCESS ... 128
6.1.1 The Choice of Companies ... 128
6.1.2 The Access to People ... 130
6.1.3 The Sources of Data ... 131
6.2 THE REsEARCH QUESTIONNAIRE ... 131
6.2.1 General Structure and Objectives ... 131
6.2.2 Questionnaire Sections and Questions ... 132
6.3 CHAPTER CONCLUSIONS ... 137
PART
m·
DATA ANALYSIS CHAPl'ER 7 • WITHIN-CASE ANALYSIS INTRODUCTION ... 1407.1 CASE A -THE BRITISH MECHANICAL EQUIPMENT MANUFACTURER ... 142
7.1.1 Company's Background ... 142
7.1.2 Manufacturing Trade-offs ... 144
7.1.3 Major Manufacturing Trade-offs ... 148
7.1.4 Manufacturing Flexibility and Trade-offs ... ... 150
7.1.5 DataSummary-CaseA ... 152
7.2 CASE B -THE BRmSH PLASTICS PACKAGING MANUFACTURER ... 153
7.2.1 Company's Background ... 153
7.2.2 Manufacturing Trade-offs ... 154
7.2.3 Major Manufacturing Trade-offs ... 158
7.2.4 Manufacturing Flexibility and Trade-offs ... 160
7.2.5 Data Summary - Case B ... · .. ··· .. ·· .. ·· .... ·· .. · ... ·· ... 161
7.3 CASE C -THE BRAZILIAN SHOES MANUFACTURER ... 162
7.3.1 Company's Background ... · .. ·· ... 162
7.3.2 Manufacturing Trade-offs ... 164
7.3.3 Major Manufacturing Trade-offs ... 168
7.3.4 Manufacturing Flexibility and Trade-offs ... 170
7.3.5 Data Summary - Case C ... · .. · ... · .... · .... · ... · ... 171
7.4 CASE D -THE BRAZILIAN AUTOMOTIVE COMPONENTS MANUFACTURER ... 172
7.4.1 Company's Background ... · ... · .... · ... 172
7.4.2 Manu,l'acturing Trade·oll's .... ... ... ... .... ... ... ... ... ... ... "./1 '.1./" •••••••••••••••••••••••••••••••••••••••••• 17" J 7.4.3 Major Manul'acturing Trade-oll's ... "J ~I ~J':' ••••••••••••••••••••••••••••••••••••••••• 177 7.4.4 Manufacturing Flexibility and Trade-offs ... 178
7.4.5 Data Summary - Case D ... 179
7.5 CASE E - THE BRAZILIAN WINERY ... 180
7.5.1 Company's Background ... 180
7.5.2 Manufacturing Trade-offs ... 181
7.5.3 Major Manufacturing Trade-offs ... 184
7.5.4 Manufacturing Flexibility and Trade-offs ... 186
7.5.5 Data Summary - Case E ... 187
CHAPTER 8 • CROSS·CASE ANALYSIS
INTRODUCTION ... 189
8.1 MAJOR SIMILARITIES ... 189
8.2 MAJOR DIFFERENCES •••..••.•....•.•..•.•••.•••••.•••. •·••••·••···••••• ... 196
8.3 ANALYSIS OF REsEARCH PROPOsmONS ... 199
8.4 CHAPTER CONCLUSIONS ... 202
PART IV • RESULTS AND CONCLUSION CHAPTER 9. THE MANAGEMENT OF MANUFACTURING TRADE·OFFS INTRODUCTION ... 206
9.1 THE CONCEPT AND STRUCTURE OF TRADE-OFFS: BACKGROUND ... 207
9.2 THE NATURE OF MANUFACTURING TRADE-OFFS ... 214
9.3 THE SOURCES OF MANUFACTURING TRADE-OFFS ... 220
9.4 THE EFFECTS OF TRADE-OFFS ON MANUFACl1JRING STRATEGY ... 224
9.5 THE MANAGEMENT OF MANUFACTURING TRADE-OFFS ... 229
9.6 THE ROLE OF FLEXmlLlTY IN THE MANAGEMENT OF TRADE-OFFS ... 239
9.7 CHAPTER CONCLUSIONS ... 244
CHAPTER 10 • CONCLUSION INTRODUCTION ... 250
10.1 MAJOR REsEARCH FINDINGS ... 251
The Progress from Descriptive to Explanatory Research of Trade-ojjs ... 251
The Three-Elements Model of Manufacturing Trade-OjJs ... 253
The Distinction between Performance and Importance of Trade-ojjs ... 255
The Taxonomy ofTrade-ojjs Manufacturing Strategies ... 257
The Role of Manufacturing Flexibility and Variety in Trade-ojjs ... 259
10.2 TOPICS FOR FURTHER REsEARCH ... 260
10.3 !MPUCA nONS FOR OPERA nONS MANAGERS AND REsEARCHERS ... 262
BIBLIOGRAPHY ... _ ... _ ... _ ... - ... -... __ .... _ ... ____ .. 264
APPENDIX: RESEARCH QUESTIONNAIRE
LIST OF ABBREVIATIONS
MS ... MANUFACl1JRING STRATEGY MSD ... MANUFACTURING STRATEGY DIMENSION OM ... OPERA nONS MANAGEMENT
QC ... A QUALITY VERSUS COST TRADE-oFF ... OTHER INmALS REFER TO VARIETY (V). SPEED (S) AND DEP£NDABn..rrY (D)
LIST OF TABLFS
TABLE 1-1: CRITERIA FOR FACTORY FOCUSING ... 11
TABLE 1-2: A REVIEW OF MANUFACTURING STRATEGY PROCESS MODELS ... 18
TABLE 1-3: A REVIEW OFTYPOLOOIES OF MANUFACTURING STRATEGY OBJECTIVES .•.•••...•...••..••••...•••••• 21
TABLE 1-4: A REVIEW OF T AXONOMIES OF MANUFACTURING DECISION AREAS .••••••••••.•••••.•...••.•..•.•...••••. 23
TABLE 1-5: MANUFACTURING DECISION AREAS AND RELATED DECiSIONS .•••.••••••••••..•.••.••••••••••••..•••..•••••• 23
TABLE 2-1: MANUFACTURING FLExlBn.rrv T AXONOMIES ...•..••••.•.••••••.•.•..•••...•.••....•...••...••..••....••••.•••.•..• 38
TABLE 2-2: UNCERTAINTIES, STRATEGIC OBJECTIVES AND FLEXIBILITY DIMENSIONS ..•.•..•.•..•••.•.••....••••. .40
TABLE 2-3: FLExIBILITY TYPES AND CAPABILITIES ••••.•••••..••••.•••••••••••••.•...••••••••..•..•••••••••.•••••••....•••...•••••.. 41
TABLE 2-4: A FRAMEWORK FOR MANUFACTURING FLEXIBILITY ANALYSIS .••..•.•••••..•...•••...••.•••...•••...••••••. 43
TABLE 2-5: A SUMMARY OF FLEXlBo..lTY TYPES AND TIlEIR SOURCES ••••....••.•••....••••••..••.•••••.•••..••••...•••.. .45
TABLE 2-6: A SUMMARY OF FLEXlBo..lTY PERFORMANCE MEASURES •.•••...••...•••.•...••....•..••..••..••...••••.••••••• 58
TABLE 3-1: MANUFACTURING AND BUSINESS STRATEGY TRADE-oFF'S APPROACHES •••.••••.•..••••.•••..•••••••. 70
TABLE 3-2: THE EVOLUTION OF A MANUFACTURING TRADE-OFFS THEORy .••.•••...•••..••.••••••.••••••.•.. · ... 71
TABLE 3-3: TYPES OF RELATIONSHIPS BETWEEN MANUFACTURING DIMENSIONS ....••....••..•.•...••...•.•••. 85
TABLE 5-1; CHARACTERISTICS OF REsEARCH APPROACHES ... 107
TABLE 5-2: REsEARCH DESIGN PARADIGMS AND THE PRESENT STUDY ... 113
TABLE 5-3: THE PROCESS OF MULTIPLE CASE STUDIES ••••••••••••••.•••••••••••.••••••••.•••••••.•••..•..•••.••••.•.•••••.•••• 114
TABLE 5-4: LEVELS OF ANALYSIS OF FLEXmlLlTY •...•..••••..•.••••.•..•..••.••••••••....•••...•••...••....•••...•••••••••..•..• 117
TABLE 5-5: THE MAJOR DECISIONS ON TIlE RESEARCH DESIGN AND METHODS ... 126
TABLE 7 -1: TRADE-OFFS IMPORTANCE FACTORS IN CASE A ... 145
TABLE 7-2: TRADE-OFFS PERFORMANCE FACTORS IN CASE A ... 146
TABLE 7-3: THE IMPACT OF FLEXIBo..lTY TYPES ON TRADE-OFFS: CASE A ... 151
TABLE 7-4: DATA SUMMARY: CASE A ... 152
TABLE 7-5: TRADE-OFFS IMPORTANCE FACTORS IN CASE B ... 156
TABLE 7-6: TRADE-OFFS PERFORMANCE FACTORS IN CASE B ... 156
TABLE 7-7: THE IMPACT OF FLEXlBo..lTY TYPES ON TRADE-OFFS: CASE B ... 161
TABLE 7-8: DATA SUMMARY: CASE B ... 162
TABLE 7-9: TRADE-OFFS IMPORTANCE FACTORS IN CASE C ... 165
TABLE 7 -10: TRADE-OFFS PERFORMANCE FACTORS IN CASE C ... 166
TABLE 7-11: THE IMPACT OF FLEXIBo..lTY TYPES ON TRADE-OFFS: CASE C ... 170
TABLE 7-12: DATA SUMMARY: CASEC ... 171
TABLE 7-13: TRADE-OFFS IMPORTANCE FACTORS INCASED ... 175
TABLE 7-14: TRADE-OFFS PERFORMANCE FACTORS IN CASE D ... 175
TABLE 7-15: THE IMPACT OF FLEXlBo..lTY TYPES ON TRADE-OFFS: CASE D ... 178
TABLE 7-16: DATA SUMMARY: CASE D ... 179
TABLE 7-17: TRADE-OFFS IMPORTANCE FACTORS INCASEE ... 182
TABLE 7-18: TRADE-OFFS PERFORMANCE FACTORS IN CASE E ... 183
TABLE 7-19: THE IMPACT OF FLEXIBo..lTY TYPES ON TRADE-OFFS: CASE E ... 186
TABLE 7-20: DATA SUMMARY: CASEE ... 187
TABLE 8-1: THE CASE COMPANIES: BACKGROUND DATA ... 190
TABLE 8-2: CASE COMPANIES: ORIGIN AND MANUFACTURING TYPE ... 196
TABLE 8-3: SUMMARY OF MOST IMPORTANT TRADE-OFFS ... 198
TABLE 9-1: PERFORMANCE FACTORS - CATEGORIES AND RELATED CASES ... 223
TABLE 9-2: EFFECTS OF TRADE-OFFS IN THE CASE COMPANIES ... 226
TABLE 9-3: IMPORTANCE FACTORS, CASE COMPANIES AND MANUFACTURING TRADE-OFFS ... 228
TABLE 9-4: PROACTlVE STRATEGIES: COMBINATIONS OF CHANGES AND EFFECTS ... 231
TABLE 9-5: PROACTlVE STRATEGIES, CASE COMPANIES AND MAJOR RELATED TRADE-OFFS ... 233
TABLE 9-6: REACTIVE STRATEGIES, CASE COMPANIES AND MANUFACTURING TRADE-OFFS ... 237
TABLE 9-7: FLExlBo..lTY TYPES, CASE COMPANIES AND MAJOR TRADE-OFFS ... 243
LIST OF FIGURES
FIGURE 0-1 : THE STRUCTURE OF THIS RESEARCH STUDY ... 4
FIGURE 3-1: A TRADE-OFF BETWEEN Two VARIABLES •...•.•....••....••••••...•••....•..•••...•....•••...••.•••••.•.. 64
FIGURE 3-2: SHORT AND LONG TERM TRADE-OFFS MANAGEMENT •••••....••....••.•.•....•••.•..••..•••••••..•••.•••••••••• 68
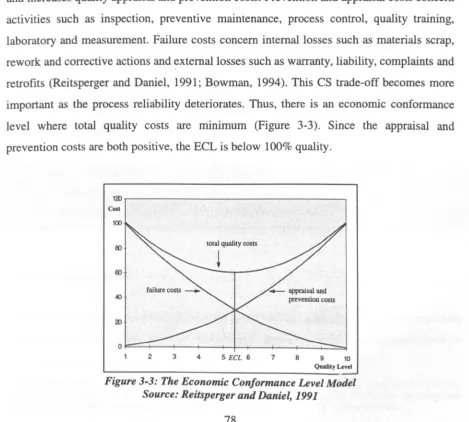
FIGURE 3-3: THE ECONOMIC CONFORMANCE LEVEL MODEL ••••••..•..•.•..••.•••••.••..••••••••..••...•••.•..•...•.•..•••... 78
FIGURE 3-4: DEPENDABILITY COSTS ••••.•••.••••....•.••..•••••••••...•••..••••••••••••••••••••...•.•.••••••.••...••••.••••.•••••••.••••. 81
FIGURE 3-5: THE RELATIONSHIP BETWEEN PRODUCTION LEAD TIME AND DELIVERY TIME ...•... 84
FIGURE 4-1: THE MANAGEMENT OF MANUFACTURING TRADE-OFFS •••..•••.•...••.•••...••....••..•••.•••...••..••••••••. 91
FIGURE 4-2: RAISING THE TRADE-OFF PIVOT ... 91
FIGURE 4-3: PRODUCTION CAPABILITIES AS TRADE-OFF PIVOTS ... 92
FIGURE 4-4: FLExIBILITY CAPABILITIES AS THE MAJOR RESEARCH FOCUS ... 93
FIGURE 4-5: THE ROLE OF NEW RESOURCES ... , ... 94
FIGURE 6-1: THE STRUCTURE AND OBJECTIVES OF THE REsEARCH QUESTIONNAIRE ... 132
FIGURE 6-2: THE DATA COLLECTION PROCESS: SUMMARY ... 137
FIGURE 7-1: MAJOR ASPECTS OF TRADE-OFFS ANALYSIS ... 141
FIGURE 7-2: NETWORK OF FLEXIBILITY TYPES, TRADE-OFFS, RESOURCES AND CAPABILITIES: CASE A .. 152
FIGURE 7-3: NETWORK OF FLEXIBILITY TYPES, TRADE-OFFS, RESOURCES AND CAPABILITIES: CASE B .. 161
FIGURE 7-4: NETWORK OF FLEXIBILITY TYPES, TRADE-OFFS, RESOURCES AND CAPABILITIES: CASE C .. 171
FIGURE 7-5: NETWORK OF FLEXIBILITY TYPES, TRADE-OFFS, RESOURCES AND CAPABILITIES: CASE 0 .. 179
FIGURE 7-6: NETWORK OF FLEXIBILITY TYPES, TRADE-OFFS, RESOURCES AND CAPABILITIES: CASE E .. 186
FIGURE 8-1: PRODUCT VS. PROCESS MATRIX OF THE CASE COMPANIES ... 196
FIGURE 9-1: FRAMEwORK OF MANUFACTURING TRADE-OFFS ... 207
FIGURE 9-2: ASPECTS OF THE BACKGROUND OF TRADE-OFFS ... 208
FIGURE 9-3: TRADE-OFFS MODELS IN THE OM LlTERATURE ... 21O FIGURE 9-4: A MODEL OF MANUFACTURING TRADE-OFFS ... 212
FIGURE 9-5: THE CS TRADE-OFF - APPROACH ON PROCESS VERSUS BATCH SYSTEMS ... 213
FIGURE 9-6: ASPECTS OF THE NATURE OF TRADE-OFFS ... 215
FIGURE 9-7: DYNAMIC TRADE-OFFS: PERFORMANCE IMPROVEMENT ... 217
FIGURE 9-8: FLExIBILITY TYPES, TRADE-OFFS, RESOURCES AND CAPABILITIES: CASE E ... 219
FIGURE 9-9: THE SOURCES OF TRADE-OFFS ... 221
FIGURE 9-10: THE ROLE OF RESOURCES, CAPABILITIES AND A TIRIBUTES IN TRADE-OFFS ... 223
FIGURE 9-11: TRADE-OFFS EFFECTS AND IMPORTANCE FACTORS ... 224
FIGURE 9-12: SIZE AND RELATIONSHIPS OF TRADE-OFFS EFFECTS ... 226
FIGURE 9-13: TRADE-OFFS IMPORTANCE AND PERFORMANCE FACTORS ... 229
FIGURE 9-14: TRADE-OFFS MANAGEMENT STRATEGIES ... 230
FIGURE 9-15: TYPES OF PROACTlVE STRATEGIES ... 233
FIGURE 9-16: THE ECONOMIC CONFORMANCE LEVEL MODEL ... 236
FIGURE 9-17: TYPES OF REACTIVE STRATEGIES ... 236
FIGURE 9-18: REsOURCES, CAPABILITIES AND PERFORMANCE GAPS ... 239
FIGURE 9-19: TRADE-OFFS WITH VARIETY AND FLEXIBILITY ... 240
FIGURE 9-20: THE FRAMEWORK OF MANUFACTURING TRADE-OFFS: OVERVIEW ... 245
FIGURE 10-1: STAGES OF THE INVESTIGATION OF TRADE-OFFS IN OM ... 252
FIGURE 10-2: MODELS OF MANUFACTURING TRADE-OFFS FROM THE OM LITERATURE ... 254
FIGURE 10-3: THE RESEARCH MODEL OF MANUFACTURING TRADE-OFFS ... 254
ACKNOWLEDGEMENTS
I sincerely thank all the people who supported and contributed to this work. My special thanks to my supervisor, Professor Nigel Slack, who contributed not only to the making of this thesis but also to my professional development, and to my wife, Liliane, who gave me all the encouragement and support during our staying in the UK.
The people from the British and Brazilian companies provided an invaluable contribution by granting me access and by spending their time and effort during the process of data collection and analysis. My deepest gratitude to all the people involved in this process. Thanks also to CAPES from Brazil for the provision of my scholarship and the support during the research.
My sincere thanks to my colleagues in the Ph.D. area for all the friendship and support that made my stay at Warwick much easier and enjoyable. I can not name all those people by fear of unjustifiably missing someone.
Thanks also to the people at the Operations Management Group at the Business School who helped me in different stages of the research. They were Hilary Bates, Stuart Chambers, Bob Johnston, Michael Shulver, David Twigg and Mary Walton.
My friends from the Production Engineering Group in Porto Alegre were scattered around the world to pursue personal and professional dreams. Bye-mail, however, we remained close and could provide ourselves support and encouragement. My special gratitude to Flavio Fogliatto in New Jersey, Fernando Amaral in Brussels and Flavio Pizzato and Luis Henrique Rodrigues in Porto Alegre for all the help and friendship before and during this research.
SUMMARY
This thesis investigates the nature and management of manufacturing trade-offs. It examines the properties and features of trade-offs in the context of manufacturing systems and the ways that operations management may deal with them.
The need for such an investigation stems from (a) the increasing interest in trade-offs, (b) the implicit use of trade-offs in many recent popular operations literature, (c) the interest in the dynamic competencies literature and (d) the apparent lack of trade-offs methods or an overall framework. This study reflects the need to extend the trade-offs research from its present descriptive focus to an explanatory and hopefully more elucidating focus.
This research is based on a number of case studies of manufacturing companies in Great Britain and Brazil. Data concerning their trade-offs were collected mainly through the examination of documents, observations of shop-floor activities and interviews with the systems' key operations managers. Following analysis identified the major data within and across the cases about the properties, features and management of trade-offs.
This investigation suggests mainly that trade-offs between MSDs do exist; that their structure can be visualised as base, pivot and function; that they are contingent and dynamic; that their performance is different from their importance; that these depend on a range of external and internal factors; that one can improve trade-offs through alternative strategies and that flexibility may have a pivotal role in this process.
Introduction
So the basic notion of trade-offs turns away some academics and managers. This is a fact whether or not we perceive the criticism as reasonable or simplistic. The fix is not to stop using the idea. The fix could be just to drop the word and substitute 'performance relationships' or something better. But what is really needed is research to develop more knowledge and the specifics of these constraints.
Wickham Skinner (1992: 21)
I Background
The concept of manufacturing trade-offs is arguably one of the paradigms of
operations management whose importance has increased most during the last years.
Manufacturing strategy studies have long been discussing the nature and role of the
appropriately named Manufacturing Strategy Dimensions in operations management.
Assumptions on the existence and nature of trade-offs between MSDs are among the
major characteristics that distinguish upon these different studies.
Studies in the 70's defined the idea of trade-offs in manufacturing strategy. They
realised that operations systems could no longer compete only in a cost productivity
basis but rather along multiple dimensions (Skinner, 1969; Banks and Wbeelright,
1979). Those studies viewed trade-offs as a marked characteristic of that new context;
an undesired yet natural attribute of a new industrial scenario. Hence they investigated
the ways by which operations management should recognise and adapt to trade-offs
(Skinner, 1974; Hayes and Schmenner, 1978; Miller, 1983).
Those ideas were disputed in the 80's by studies suggesting that some companies
seemed able to defy the idea of trade-offs. These firms seemed to outperform their
competitors in many areas simultaneously. Such competitive power was enabling then
to win markets all around the world. Hence their modus operandi was called 'World
Class Manufacturing' (Schonberger, 1986; CoIlins and Schmenner, 1993). The WCM
theory thus challenged the idea of trade-offs between MSDs: if trade-offs exist, how
do such companies excel in all those areas? These studies regarded manufacturing
trade-offs a myth and urged operations managers to pursue all their goals in concert.
However, empirical studies in fields such as operations management, industrial
economics or production engineering would not corroborate WCM ideas. Operations
systems have still limited resources and can not simply achieve everything. On the other hand, the cases presented by WCM studies pointed out a reality that the earlier
theory could not explain either. It was necessary to elucidate how some firms could
exceed in many areas despite not getting clear of trade-offs. Further studies were
needed to suggest ideas that might solve this paradox (Skinner, 1992; New, 1992).
Such new studies have been proposing that trade-offs still exist but they are dynamic
(Skinner, 1992; Hayes and Pisano, 1994). Operations management has to recognise
and improve continually the resources and capabilities available in the system to
redefine the nature of trade-offs (Slack et al., 1995). Trade-offs exist but their
performance and importance are contingent to environment variables that may be
improved (New, 1992; Filippini, Forza and Vinelly, 1995).
As part of that effort to understand such reality, this study develops some ideas that
may extend the knowledge about the nature, sources, effects and management of
trade-offs in the context of manufacturing. To achieve that, the research brings the
existing knowledge on manufacturing strategy, flexibility and trade-offs together with
11
Justification
The need for further research on manufacturing trade-offs was pointed out by authors
such as Skinner (1992), New (1992) and Schroeder et al. (1996). This stems from at
least three major factors:
1. Industrial markets' competition has moved from a focus on single dimensions
(specially cost productivity and quality) to a focus on multiple dimensions
(Filippini, Forza and Vinelli, 1995; Hayes and Pisano, 1994). Today's successful
firms need to deal with trade-offs to be able to achieve superior performance in
many areas. Hence there is a need to define frameworks that may help operations
management to deal successfully with trade-offs;
2. The operations management literature has so far provided little knowledge on the
nature, sources, effects and management of trade-offs. Recent studies focus still on
a debate on whether they exist or not (Mapes, 1996; Schroeder et al., 1996). Some
studies focused on the sources (Filippini, Forza and Vinelli, 1995; Ferdows and
De Meyer, 1990) or nature (Skinner, 1992; Hayes and Pisano, 1995) of trade-offs but only as separate from any general framework. Slack et al. (1995) defined the
idea of trade-off pivot but did not suggest what this is in practice;
3. The few ideas suggesting how operations management can deal with trade-offs in
practice seem to be simplistic and/or lack empirical evidence. The W orId Class
Manufacturing theory of Schonberger (1986) has been criticised for its lack of
research evidence and simplistic view of operations management (New, 1992;
Skinner, 1992). Ferdows and De Meyer's (1990) Sand Cone Model was not corroborated by Wood (1991) and just partially corroborated by Noble (1995).
These factors are obviously related. The problem is that trade-offs have got an
increasing role in the new context of manufacturing that is still not well understood. It
seems difficult to define reliable approaches to deal with trade-offs in this new context
before one really understands what are their sources, effects and nature. Extending
III Research Structure
This study is divided into four parts (see Figure 0-1). Part I is the literature review. It
discusses the relevant literature that grounds the investigation. Chapter 1 is about
manufacturing strategy, Chapter 2 is about manufacturing flexibility and Chapter 3 is
about manufacturing trade-offs. This literature unveils the major ideas to ground the
choice of the research methodology in Part IT.
Part IT concerns the definition of the methodological aspects of this research. This is
based on ideas from the literature review in Part I and on theoretical studies on
research methods in Social Sciences. Chapter 4 defines the research framework,
objectives and propositions. Chapter 5 discusses the major aspects of the research
methods such as research strategies, research paradigms and the process of data
collection and analysis. Chapter 6 discusses the research design. The research design,
methods and framework guide the process of data collection and analysis.
Part ill presents the data analysis. Chapter 7 covers the within-case analysis of data.
Each within-case analysis is a case study. Chapter 8 presents the cross-case
comparison of those data. It stresses their major similarities and differences to ground
the research results and conclusions following discussed.
/
I Literature Review
I Manufacturing Strategy 2 Manufacturing Flexibility 3 Manufacturing Trade-offs
n
Methodology4 Research Framework 5 Research Methods 6 Research Design
m
Data Analysis7 Within-Case Analysis
8 Cross-Case Analysis
\
IV Results and Conclusion/
9 Research Results [image:14.541.42.536.462.751.2]10 Conclusion
Part
I -
Literature Review
Part I reviews the literature that is relevant to this research. It discusses the major
ideas on manufacturing strategy, flexibility and trade-offs to be used along the
research framework. Part I is divided into three chapters:
Chapter 1
Manufacturing Strategy
Chapter 2
Manufacturing Flexibility
Chapter 3
Chapter 1 - Manufacturing Strategy
CHAPrER 1 • MANUF ACTURIN'G STRA TEGY ... _ ...•...•... 7
INTRODUCTION ... 8
1.1 MANUFACTURING STRATEGY CONCEPTS ... 9
1.1.1 Focused Manufacturing ... 10
1.1.2 The 4 Stages of Manufacturing Strategic Role ... : ... 12
1.1.3 The Product-Process Matrix ... 14
1.1.4 Qualifying and Order-Winning Criteria ... 16
1.2 THE MANUFACTURING STRATEGY PROCESS ... 17
1.3 THE MANUFACTURING STRATEGY CONTENT ... 19
1.3.1 Manufacturing Mission ... 20
1.3.2 Manufacturing Strategy Objectives ... 20
J .3.3 Manufacturing Decision Areas ... 22
1.4 PRODUCTION CAPABILITIES ... 24
1.4.1 The Resource-Based Theory ... 24
1.4.2 Resources and Capabilities ... 25
1.4.3 Production Capabilities and Competencies ... 26
1.4.4 Production Competence and Business Performance ... 27
1.5 CHAPTER CONCLUSIONS ... 29
Chapter 1
Manufacturing Strategy
Introduction
The research on manufacturing strategy (MS) started in 1969 with Skinner's study on the
competitive failures of USA industrial companies. According to Abemathy, Clark and
Kantrow (1981), major industries such as textiles, machinery, computers and specially cars
had not been able in that time to cope with the competitive changes imposed by new
entrants, specially those from Japan. Industrial managers blamed factors such as
government's regulations, trade-unions and the 1973' s oil shock as their major competitive
barriers. However, according to Hayes and Wbeelright (1984), such problems had affected
other nations too and could not justify competitive weaknesses that had started even before.
According to studies such as Skinner (1969; 1974), Hill (1985) and Hayes and Wbeelright
(1984), the major competitive obstacles came from inside those firms. Deficiencies ranging
from strategic to operational mis-management were the real causes for the US and Europe's
'industrial decline'. The major factors stressed in these studies may be summarised in five
points:
1. An emphasis on productivity and cost reduction at the expense of long term
investments such as product and process innovation and research and development.
This emphasis also reflected in a focusing on existing markets at the expense of new
ones (Hayes and Wheelright, 1984; Skinner, 1969; 1974; Banks and Wbeelright, 1979;
Abernathy, Clark and Kantrow, 1981; Hill, 1985);
2. An excessive attention to finances and marketing at the expense of manufacturing and
technology management. Manufacturing was considered a 'technical liability' instead
3. An excessive simplification in organisational design and a lack of integration between
units. Manufacturing decisions usually concerned single areas and followed a marketing
or finances point of view (Hayes and Wheelright, 1984);
4. The inappropriate application of financial portfolio theories to production assets.
Production assets do not behave as financial assets. This led to excessive industrial
diversification and a lack of focus on production performance (Abernathy, Clark and
Kantrow, 1981). Companies would pay more attention to opportunities on mergers than
to their markets (Hayes and Wheelright, 1984; Skinner, 1969; 1974);
5. The core competition factors were not related to manufacturing abilities. Manufacturing
had no competitive role or coherence. Skinner (1969) called this 'the missing link' in
production management (Hill, 1985; Hayes and Wheelright, 1984).
In the view of these authors, these factors related to the inability of strategic management to
take manufacturing for a source of competitive advantage. While finances and marketing
are supportive areas, manufacturing and sales are the main businesses. The answer for
competitive problems relied in the co-ordination between strategy and manufacturing. It
was necessary to develop and apply a MS theory.
This chapter reviews the major ideas on MS starting from those early studies. Section 1.1
discusses the major MS concepts and frameworks. Sections 1.2 and 1.3 discuss the MS
process and content. This is the application of those frameworks into practice. Section 1.4
discusses the recent literature on production resources and capabilities.
1.1 ManUfacturing Strategy Concepts
The first step in the development of the MS theory was the definition of concepts and
methods that could translate into practice the ideas from early studies. MS relies on core
assumptions such as the compatibility between manufacturing and competitive strategy, the
proactive role of manufacturing and the need for setting competitive priorities. These
assumptions have been translated into operational concepts such as focused factories,
This section discusses the major MS concepts and methods. These ideas appeared from the
beginning of the 70's and are increasingly important in both research and practice.
1.1.1 Focused Manufacturing
The idea of focused manufacturing was developed by Skinner (1974) and follows three
major concerns. First. cost is not the only competitive yardstick. Cost used to be the
primary performance objective of industrial fIrms in the 70·s. However. competitive
advantage may rely on other dimensions such as quality and speed. Second. a production
system cannot perform well on every yardstick. OM should give priority to the objectives
that best relate to the corporate strategy. Third, "simplicity and repetition breed
competence" (1974: 115). The competitive advantage in manufacturing relies on a limited
range of performance objectives that are compatible with the competitive strategy.
In 1974. when just-in-time and flexible manufacturing were still new ideas. Skinner tried to
solve such conflicts through specialisation. He extended the idea of task specialisation.
traditional in mass production, to the limits of the factory. Factories should focus on a
limited range of objectives. products and tasks. They should concentrate on the most
important competitive measures and keep the other measures in the limit necessary to
support the main ones. According to Skinner, "a factory that focuses on a narrow product
mix for a particular niche will outperform the conventional plant, which attempts a broader
mission" (1974: 114). The division of bigger plants into smaller units could be achieved
with the following methodology:
1. Developing an explicit, brief statement of corporate objectives and strategy;
2. Translating this statement into manufacturing language and meaning;
3. Making a careful examination of the elements of the production system and
One major decision of the implementation of focused factories is the choice of the criteria
to divide the units into groups (Hayes and Schmenner, 1978). The literature provides some
different criteria, each one relating to different contexts (Table 1-1).
Criteria Hayesand Hill Lee Sheuand
Wheelright (1984) (1985) (1990) Kralewski 1199Ql
Product X X X X
Process X X X X
OW Criterial X
Volume X X
Market X
Geo~phy X
Infrastructure X
Table 1-1: Criteria/or factory focusing
Product and process are the most important among these criteria (Hayes and Schmenner,
1978). The facilities of a factory focused by product are designed to meet the needs of
specific groups of products (Hill, 1983). This usually requires duplicating resources across
facilities (Sheu and Krajewski, 1990). The facilities of a factory focused by process are
divided according to their tasks (Hayes and Schmenner, 1978). According to Lee (1990),
process plants are more difficult to co-ordinate and control than product plants.
There is a debate in the literature on whether focused factories are appropriate in the
present context. Gerwin (1993) pointed out that the duplication of facilities to attend
different focused plants leads to inefficient use of resources and excessive capacity levels.
He also says that focused firms tend to be less responsive to changing markets. Hayes and
Pisano (1994) suggested that flexible technologies are a better alternative than focused
factories. Focused factories are inherently inflexible and have low scale economies that are
not always compensated by scope economies. According to Wathen (1995: 11), " ... the
degree to which a business unit focuses on the operations and control of production process
does not directly relate to higher performance". That means the implementation of focused
factories has to follow other measures to guarantee superior performance.
On the other hand, focused factories have benefits such as lower system's complexity and
improved control. Focused factories motivate workforce involvement and team-working
practices. Since they deal with marketing niches, the environment control is easier and forecasts tend to be more accurate (Collins and Schmenner, 1993). The consistency within and between manufacturing attributes and marketing requirements increases (Bozarth, 1993). Focused factories may also minimise the impact of manufacturing trade-offs since different units focus on different objectives.
Thus, the value of focused factories depends on contingent aspects such as the system's environment, objectives and structure. They may concern only parts of the system and ~ay serve as short-term basis for more comprehensive, long-term solutions. It is the role of OM to defme whether they are appropriate and what benefits their implementation may bring.
1.1.2 The 4 Stages of Manufacturing Strategic Role
The failure of manufacturing to support the competitive strategy was originally one of the major concerns of MS. OM was restricted to adapt manufacturing to environment changes, usually after their occurrence. However, such approach is no longer compatible with the competitive practices. Manufacturing should have a proactive role in creating strategic opportunities and in supporting the competitive strategy. Naturally, turning 'reactive' systems into such proactive assets takes a long time. It requires persisting and progressive improvements in the manufacturing structure and culture (Wheelright and Hayes, 1985).
According to Wheelright and Hayes (1985), turning manufacturing into a competitive weapon should take four stages. Each stage concerns a more supportive and proactive role of manufacturing. Progressing through stages requires the development of superior capabilities and the strengthening of links between manufacturing and other areas. This development follows three major rules:
1. The stages are not mutually exclusive. Different areas may be in different stages. Improving poorest areas will probably have the major effect in the overall performance; 2. It is almost impossible to skip a stage;
The first stage corresponds to an 'internally neutral' state. Manufacturing is unable to
influence the competitive strategy. OM's major objective is to minimise the impact of
manufacturing failures in other areas. Manufacturing management tends to be simple,
avoiding aspects such as reliability and integration and focusing on cost productivity.
The second stage is the 'externally neutral' manufacturing. The production system should
be as good as its major competitors'. This neutrality relies on copying industry practices
and technologies. OM tends to avoid discontinuous changes and focus on investments in
automation and scale economies.
Stage 3 concerns systems that actively support the competitive strategy (these are called
'internally supportive' systems). That is manufacturing decisions are consistent with the
strategy. This is the fust stage where the formulation of a MS is a reality. OM should
influence and preferably take part in the competitive strategy formulation. Hum and Leow's
(1996) empirical study suggested that most companies were between stages 2 and 3.
Finally, systems in stage 4 are 'externally supportive'. That is they are able to follow and
contribute to the competitive strategy. Companies in this stage promote an intensive
interaction between manufacturing and other functions, the seeking of expertise in new
technologies and the continuous improvement of their structure and infrastructure.
The passage from stage 3 to 4 is the most beneficial but also the most difficult. It requires
extensive restructuring of the manufacturing function and firm commitment. Factors such
as in-house product development, attention to the manufacturing infrastructure and
integration between product and process design are crucial to the 'big jump' to stage 4.
Taxonomies
0/
1IUInu/acturing strategies -
Sweeney (1991) proposed an alternativeapproach to Wheelright and Hayes'. He suggested that Wheelright and Hayes' s approach is
too prescriptive and that the link between manufacturing and corporate strategy could be 'progressively developed' through a taxonomy of manufacturing strategies.
He was not the first to develop such idea. Stobaugh and Telesio (1983) proposed a
and low cost). Roth and Miller (1992) also dermed a model of three strategies (caretakers,
marketeers and innovators).
Sweeney (1991) suggested a taxonomy with four generic manufacturing strategies:
caretaker, marketeer, reorganiser and innovator. Each strategy corresponds to a
combination of Porter's (1985) competitive strategies with types of manufacturing process
design (high volume and high variety). Each strategy concerns alternative types of
manufacturing objectives, capabilities and resources. Sweeney, as Wheelright and Hayes,
suggested that some strategies were better than others. In this case, however, the value of
the strategies is also contingent to some environmental characteristics.
In a later study, Sweeney (1993) proposed that the firm should develop manufacturing
through these strategies until reaching the 'longer-term vision' of innovator strategies. This
development requires extensive changes in the supply chain, process and infrastructure.
1.1.3 The Product-Process Matrix
According to Spencer and Cox (1995), the linking between process strategies and product
strategies has been suggested for a long time. By the end of the 70's, the emergence of new
process management ideas such as group technology and focused factories demanded more
than ever the understanding of that relationship.
The idea of a process life cycle follows that of a product life cycle. It suggests that typical
production systems progress from an initially flexible and disconnected structure (a job
shop system) to a mechanised and standardised (flow shop) structure. According to Hayes
and Wbeelright (1979a), this progress should be consistent with the variety and volume of
products made in that system. That means process types should match corresponding
product volume and range types. The set of combinations of process and product types is
determined in a 'product-process matrix'.
The product-process matrix has two dimensions that are the product variety/volume
low volumellow standardisation, low volume/multiple products, higher volume/few major products and high volume/high standardisation. Their corresponding levels in the process dimension are job shop, batch line, assembly line and continuous flow types. The product and process types should match in the main diagonal of the matrix. That is high product varieties correspond to highly flexible structures and so on. Systems matching in non-diagonal yardsticks are non-economical and have low competitiveness.
The matrix also indicates the performance objectives that should correspond to each product/process strategy. Flexibility and quality correspond to job shop and low volume structures. Cost and dependability correspond to continuous, high volume structures.
If new products have different volume and variety structures, they should be processed in corresponding new process structures, with specific layout, facilities, control systems and competitive strategies. This combines with the idea of focused manufacturing.
According to Hayes and Wheelright (1979b), OM has to continuously adapt the process and product structures as the
rum
grows. Changing the product or process structure with no corresponding change in the other dimension may lead to failures such as loosing focus. Furthermore, changes leading to an addition instead of modification in the other dimension may lead to failures such as de-focusing, over-capacity and high production costs.1.1.4 Qualifying and Order-Winning Criteria
Ideas such as focused manufacturing and the product and process matrix follow one of the
key assumptions in the MS theory: competitive markets have variable needs that production
systems must be able to satisfy. Operations and marketing management need to evaluate
those needs and translate then into manufacturing capabilities needs (Slack, 1991).
Hill (1985) developed a framework that helps OM in evaluating and translating market
needs into production needs. If competitive criteria vary from market to market, that is
because they have different levels of importance in each market. Hill suggested that these
criteria may be classified into qualifying and order-winning.
Qualifying criteria are objectives requiring a minimal performance level to the firm stay in
the market. They do not guarantee the company to win orders but they prevent it from
losing orders (Corbett and Van Wassenhowe, 1993). Improving these criteria beyond their
qualifying level usually brings few competitive benefits to the company (Slack, 1991).
Order-winning criteria are objectives requiring a minimal performance level to the firm
gain new orders. These are the key decision factors on which customers base their
purchasing decisions. Improvements above their qualification level should probably lead to
increasing demand (Slack, 1991).
The major advantage of this idea is that it integrates the marketing and manufacturing
approaches. Competitive criteria earlier defined by marketing as 'price' and 'service' may
be later translated into manufacturing objectives such as cost, quality and dependability
(Corbett and Van Wassenhowe, 1993). These criteria are also dynamic that is they may
shift according to environment changes. Order-winning criteria may become qualifying
criteria and vice-versa. This dynamics require continuous environment control and process
improvements to avoid the lose of competitiveness.
The major problem with this framework is that the competitive criteria follow only external
requirements and not production capabilities (Spring, 1995). Later developments in the MS
of competitive advantage (Hayes and Pisano, 1994). This is not considered in Hill's framework. Perhaps such framework should not only qualify the competitive criteria but also capabilities as order-winners or qualifiers. Another problem is the lack of empirical testing to corroborate so far this framework (Spring, 1995; Swink and Way, 1995).
New (1992) developed a framework similar to Hill's. This distinguishes upon 'Market Hygiene factors' and 'Competitive-Edge factors'. Market Hygiene factors correspond to the Qualifying criteria, while Competitive-Edge factors correspond to the Order Winning criteria. New (1992) suggested that the delivery of Competitive-Edge criteria depended on a set of decisions on manufacturing trade-offs. In spite of trade-offs not always disappearing, New (1992) sees their improvement may lead to better Competitive-Edge criteria.
The distinction upon different competitive criteria and, if possible, capabilities is essential to the management of trade-offs. First, it indicates the importance of distinct trade-offs to competitiveness. Second, it might qualify alternative actions to deal with trade-offs. For example, on deciding upon which objectives could be improved at the expense of others and which trade-offs should be improved at first.
1.2 The Manufacturing Strategy Process
From the late 80' s, the development of MS concepts gave place to studies concerning more 'applied' issues such as the process and implementation of MS (Voss, 1992; Garvin, 1993; Anderson, Schroeder and Cleveland, 1991). Although Skinner (1969) developed a 'process of manufacturing policy determination', most studies in the 70's and early 80's had focused on theoretical aspects of MS and regarded its process and content to a second plane.
General Skinner HiU HoIte et al. Muuchet. Panneli Platts and Garvin Sweeney Steps (1969) (1985) (1987) .t Andenoo(I990) Gregory (1990) (1993) (1993) Competitive Environment Competitive
Analysis Analysis Analysis
Corporate Company Company Competitive Corporate Business Business Corporate Strategy Strategy Objectives Strategy Strategy Strategy Strategy Objectives
Marketing Marketing Marketing
Strategy Strategy Strategy
Manufacture How to win Manufacturing Strategic Target Service
Mission orders? Mission Priorities Standards
Manufacture Manufacture Manufacture Manufacturing Manufacture Objectives Task Obiectives Objectives Objectives
Manufacture Manufacture Process Structure and Manufacturing Manufacturing Policies & Policies Policies Choice Infrastructure Strategy Strategy Initiatives
Manufacture Manufacture Manufacture Tactical Manuf. Systems Programs & Improvement Promms Operations Infrastructure Planning Design Projects Programs
Programs Implement. Implementation Adapt Manuf.
Implement. (Next phase) Structure
Performance Results and Operation and
Control Feedback Audit
Table 1·2: A review of manufacturing strategy process models.
The major difference among these frameworks is on their scope of analysis and
implementation. They usually start with the corporate strategy and finish with the
development or implementation of manufacturing programs. They have always two major
assumptions that are (1) the MS process goes top-down and (2) the information provided by
the process level 'n' serves as input for the process level 'n+l'. That summary suggests at
least nine MS process levels, as follows:
1. Competitive analysis: The formal analysis of the external (competitive) and internal
(structural) environments. It identifies the facts and forecasts that will influence the
corporate strategy;
2. Corporate strategy: The definition of the major corporate objectives to be achieved by
the end of the period;
3. Marketing strategy: The definition of the critical factors that may guarantee the
marketing success;
4. Manufacturing mission: The first step of the MS itself. It defines the main objectives
or strategy priorities to be achieved by manufacturing means;
5. Manufacturing objectives: It describes the manufacturing goals on dimensions such as
cost, quality an~ flexibility. This is the contribution of production to the achievement of
6. Manufacturing policies: This is the heart of the process. It defines the basic choices
and initiatives to support the achievement of manufacturing objectives. Policies concern
different decision areas such as capacity, facilities and workforce (see Section 1.3.3);
7. Manufacturing programs: This is the definition of the activities for the
implementation of manufacturing policies. Manufacturing programs consist in aspects
such as activities, responsibilities, milestones and budget;
8. Implementation: It concerns the execution of ~e policies and programs from steps 6
and 7. Most authors do not extend their frameworks to this and the next phases;
9. Performance control: Skinner (1969) stresses the need for the assessment of the
results achieved by manufacturing programs to support future modifications and
improvements in the process.
Empirical studies (Maruchek, Pannesi and Anderson, 1990; Anderson, Schroeder and
Cleveland, 1991) suggested that the successful formulation and implementation of a MS
depends on some factors. The strategy should be understandable, measurable, durable and
focused on a few key success factors. Both corporate and operations management should
take part in the process (a 'team approach'). Mills et al. (1995) stressed the need for the
participation and commitment of people and for the development of adequate procedures
for the implementation, formulation and audit of the process.
1.3 The Manufacturing Strategy Content
The MS process concerns how to define and implement a MS. The content concerns the
elements of this process. The major elements in the MS content relate to steps 4, 5 and 6 of
the consolidated process model above. According to Schroeder. Anderson and Cleveland
Mission: The manufacturing mission emanates from the business and marketing strategies. It is the main purpose of the manufacturing function. It is defmed in step 4 of the process;
Manufacturing Objectives: These are the performance dimensions that sustain the achievement of a manufacturing competitiveness. They are defmed in step 5 of the process;
Manufacturing Decision Areas: The manufacturing policies from step 6 of the process relate to different domains of the production system. A taxonomy of decision areas identifies these domains and their characteristics;
Distinctive Competence: A competence is a production capability with strong competitive performance and importance. Competencies are usually defined along with the manufacturing mission but. contrasting with the mission, they are singular.
The following sections discuss the manufacturing mission, objectives and decision areas.
Section 1.4 reviews the literature on production capabilities and competencies.
1.3.1 Manufacturing Mission
According to Schroeder, Anderson and Cleveland's survey (1986), manufacturing
managers usually agree on the meaning and objective of a 'manufacturing mission'. This
mission states the objective and meaning of the manufacturing function for a given period.
An example of manufacturing mission is presented in this study as
" ... to produce a high quality product and provide superior delivery service to the
customer by emphasising a preservative approach to quality assurance and by
achieving short manufacturing cycle times. Manufacturing will establish the most
people-oriented operation in the industry. " (p. 410)
The manufacturing mission emerges usually from the business strategy. It leads to the
identification of the system's main capabilities and objectives and of the programs to be
developed in the period.
1.3.2 Manufacturing Strategy Objectives
Manufacturing strategy objectives (or manufacturing strategy dimensions - MSDs) are the
and performance of manufacturing activities depend on the achievement of these objectives (Slack, 1991). The definition of a typology of MSDs is essential to the building of frameworks for the MS planning and control.
The literature on OM has for long been concerned with the definition of MSDs typologies. These typologies are usually similar. The few differences among them reflect often different views on the importance and hierarchy of these objectives. The terminology
referring to these objectives also varies, the same happening with their general denomination. Table 1-3 summarises some typologies with their specific terminology.
Objectives Cost QaaUty F1exibiUty Dependability Speed Additional
Sources Types
Hayes and Wheelright (1984) Cost Quality Flexibility Dependability 'Perfonnaoce Criteria'
HiJJ (1985) Cost Quality Range of Delivery Delivery
'Performance Objectives' Products Reliability Speed Ferdows et al. (1986) Cost Quality Flexibility Delivery
'Manufacturing Capabilities'
Swamidass and Newell (1987) Cost Quality Flexibility Dependability 'Manuf. Strategic Dimensions'
Edmonson and Wbeelright (1989) Cost Product Flexibility Dependability Innovativeness 'Perfonnance Dimensions' Perfonnance
Platts and Gregory (1990) Cost Quality Flexibility Delivery Delivery Product
'Performance Criteria' Reliability Speed Features
Slack (1991) Cost Quality Flexibility Dependability Speed 'Performance Objectives'
De Toni, Filipini and Forza (J992) Cost Quality Flexibility Dependability Time 'Competitive Priorities'
Garvin (1993) Cost Quality Flexibility Delivery Service 'Strategic Priorities'
Table 1-3: A review oftypologies of manufacturing strategy objectives.
The most common dimensions along these typologies are cost, quality, flexibility and dependability. Speed is either considered a single category (Slack, 1991; Hill, 1985; De
Toni, Filipini and Forza, 1992) or a sub-category of dependability or quality (Garvin, 1993; Hayes and Wheelright, 1984). Innovativeness is single category in Edmonson and Wheelright (1989) and a sub-category of speed in Slack (1991). Garvin (1993) refers to
service. This is a sub-category of dependability or quality in Hayes and Wheelright (1984) and Slack (1991). Finally, Platts and Gregory (1990) enumerate product features. This is sometimes a sub-category of quality (Garvin, 1993; Slack, 1991).
The typology to be adopted in this study should summarise those above. It should be well
balanced for reliability and scope that is neither too many nor too few categories should be
included. Cost, quality, flexibility and dependability are major elements of all these
typologies and should thus be considered. Speed is also included since it appears in a
reasonable number of studies (four) and has been associated with recent ideas such as agile
manufacturing. The remaining categories (innovativeness, product features and service) are
in only one source and thus shall be considered sub-categories. Hence this study will adopt
a typology of five MSDs with the following categories:
1. Cost: The total expenditure carried on the manufacturing and distribution of products,
including expenses with raw materials, equipment, operational costs and delivery;
2. Quality: The measure of the achievement of standards in process performance, product
features, customer services and other areas of the system;
3. FlexibUlty: The system's ability to change. Changes may concern new product features,
process structure or activities;
4. DependabUlty: The ability to meet promised delivery schedules;
5. Speed: The time spent from the production order to the final product's delivery. It also
refers to the time spent to introduce a new product (innovativeness).
This typology will make part of the research framework to guide the assessment and
analysis manufacturing trade-offs as in the case studies.
1.3.3 Manufacturing Decision Areas
The determination of manufacturing policies to follow the mission and objectives is a
complex task. Assessing and designing manufacturing systems is not an easy task. Even
small systems have a complex network of units, relations, objectives and constraints. The
determination of MS policies should thus follow a well-defined taxonomy of the different
The major taxonomy of manufacturing decision areas in the literature is that of Hayes and
Wbeelright (1984). Others have been provided in studies such as Haas (1987), Levary
(1992), Garvin (1993), Buffa (1984) and Fine and Hax (1985). These taxonomies involve
usually similar areas and levels. They are summarised in Table 1-4.
Skinner Buffa Hayes and Fine and Haas Lcvary Garvin
Decision Areas (1974) (1984) Whcclrighl (1984) Halt (1985) (1987) (1992) (1993) Structural Decisions
Capacity X X X X X
Distribution X X
Facilities X X X X X X X
Process Technology X X X X X X X
Vertical Integration X X X X
Infrastructural Decisions
-Human Resources X X X X X X
New Products X X X X X
Organisation Structure X X X X X
PPC Systems X X X X
Quality X X X
R&D X
Suppliers X X X X
Table 1-4: A review of taxonomies of manufacturing decision areas.
Table 1-4 suggests at least 12 decision areas to be used in manufacturing assessment and
planning. Each area concerns a set of decisions or characteristics that must agree with the
manufacturing mission and objectives, as indicated in Table 1-5.
Structural Decisions
1. Capacity: amount, timing, type.
2. Distribution: delivery times, reliability, vendors. 3. Facilities: size, localisation, specialisation. 4. Process technology: scale, flexibility, integration. 5. Vertical integration: direction, extent, balance.
Infrastructural Decisions
6. Human resources: selection, training, security. 7. New products: hard-off, start-up, modifications.
8. Organisation structure: communication systems, management policies. 9. Production planning and control systems: organisation, scheduling, control.
10. Quality: definition, roles, responsibilities. 11. Research and development: structure. 12. Suppliers: number, structure, relationship.
Table 1·5: Manufactunng decision areas and related decisions.
Hayes and Wbeelright (1984) suggested dividing these areas into structural and
infrastructural (see Table 1-5). Structural areas concern the 'architectural' configuration of
the system and usually refer to long-term decisions. Infrastructural areas refer to short-term
decisions and concern usually the system's organisation, planning and control (Leong,
Snyder and Ward, 1990).
1.4
Production
Capabilities
Production capabilities and their relationships with MS and performance is a key issue in
today's OM literature. Their study is still recent and follows the well-called
Resource-Based Theory from the business strategy literature.
This section reviews the major literature on production capabilities and competencies to
highlight some issues that are important to this study. It consists in four parts concerning
(1) the Resource-Based Theory, (2) resources and capabilities, (3) capabilities and competencies and (4) the relationship between competencies and business performance.
1.4.1 The Resource-Based Theory
The Resource-Based Theory probably started with Wernerfelt's (1984) work on the
relationship between profitability and firm's resources. However, as he himself stated 11
years later (Wernerfelt, 1995), it was only by 1990 that other authors started investigating
this issue. Prahalad and Hamel's (1990) study on the differences between a portfolio of
competencies and a portfolio of businesses paved the way for a still growing research area.
The Resource-Based Theory follows the idea that resources are the major foundation of a
firm's strategy (Grant, 1991). The firm's competitiveness should be assessed by its
resources instead of products (Wernerfelt, 1984). This idea aims to explain why and how
some companies appear always to explore market opportunities better than others, even
when they use similar competitive strategies and have similar products. The answer is that a
capabilities. Long-term competitiveness relies on the development and exploitation of
resources and capabilities (Stalk, Evans and Schulman, 1992; Prahalad and Hamel, 1990).
According to Grant (1991), the competitive strength of resources and capabilities relies on
two factors that are (1) the long-term sustainability of the competitive advantage that they
provide and (2) the firm's ability to appropriate the rent from these resources and
capabilities. A resource-based approach in the strategy process should thus follow five
steps: (1) identify and classify the firm's resources; (2) identify and classify the firm's
capabilities; (3) evaluate the strategic potential of these resources and capabilities; (4)
select the strategy that best exploits this potential and (5) identify the resource gaps that
need still to be filled.
1.4.2 Resources and Capabilities
Within the Resource-Based Theory. resources are ... the stocks of available factors that are
owned or controlled by the firm." (Amit and Schoemaker, 1993: 35). They are the basic
units of analysis, the basic inputs in the process (Chandler and Hanks, 1994; Grant, 1991).
Wemerfelt (1984) and Zahra and Das (1993) divided resources into tangible and intangible.
Tangible resources are easily observable and may be accurately measured. Examples of
tangible resources are human assets, machinery and properties. Intangible resources are not
directly observed or quantified. These are assets such as reputation and management skills.
Manufacturing involves both tangible and intangible resources.
This theory views resources and strategy as complementary. The competitive strategy
should ground on the availability of resources and resources should be adequate to
marketing and strategy needs2• Strong resources have high uniqueness and low
substitutability and may sustain a long-term competitive strategy (Zahra and Das, 1993).