Faculty of Behavioural Management
and Social Sciences
Master Thesis
M.Sc. Business Administration
M.Sc. Innovation Management & Entrepreneurship
Sebastian Stöckl
The Next Big Thing
The Use of Text Mining Analysis of Crowdfunding Data
for Technology Foresight
University of Twente:
First supervisor: Prof. Dr. Fons Wijnhoven Second supervisor: Dr. Erwin Hofman
Abstract
Management summary
Due to rapidly changing market needs and technological progress, it is essential for companies to scan the future of technologies and identify emerging fields of economic benefits. Various foresight methods have been developed that still primarily rely on manual research and the expertise and internal knowledge of experts. This often results in costly, time-consuming and biased processes. To address these limitations and enhance the knowledge base of foresight activities, this study suggests the design of new quantitative research methods that are based on the exploitation of crowdfunding data to derive novel and detailed insights about the development of technologies and markets. This information can be used to support technology foresight experts during different steps of the foresight process.
To systematically analyze the data, text mining methods are combined with contextual data, as well as trend and co-word analysis. Six different methods are designed: Word clouds, keyword emergence map, market portfolio map, technology risk map, market hype curve, and co-word networks that are meant for supporting the traditional foresight process and facilitate the detection of future signals and trends. These methods are aligned with the requirements for technology roadmapping and scenario planning. The applicability and usefulness of the proposed methods are exemplified by a case study, analyzing the development of robot technologies.
Based on the analysis of more than 26,200 crowdfunding campaigns from the years 2009 until 2017, it is shown that the impact of this thesis on technology foresight activities is multifold: First, crowdfunding as a new and high-potential data source is presented and analyzed, and it is shown that novel and highly relevant insights can be derived from it. Second, innovative methods to analyze technologies from various points are presented and successfully applied. Third, new insights about the identification of weak signals have been made by demonstrating the detection of weak signal technologies in crowdfunding datasets and confirming the correlation between term frequencies and investment rates for weak signal technologies. Fourth, guidance on how to support technology roadmapping and scenario processes during different steps are presented. In this way, these foresight processes are expected to become more efficient and transparent and are enhanced through access to additional data-driven knowledge sources.
Outline of the thesis
1. Introduction 1
1.1. Context of the study and research goal 1
1.2. Research question 3
1.3. Theoretical underpinnings and structure of the thesis 4
2. Theoretical Framework 5
2.1. Technology foresight 6
2.1.1. Scenario analysis 8
2.1.2. Technology roadmapping 9
2.1.3. Future signal analysis 11
2.2. Integrating external data sources into technology foresight 12
2.2.1. Patent analysis 12
2.2.2. Web mining 14
2.2.3. Crowdfunding data 15
2.2.4. Selecting data sources for foresight applications 17
3. Research methodology 19
3.1. Design science 19
3.2. Design science research process 19
4. Design of a crowdfunding data analysis for technology foresight 22
4.1. Data collection 22
4.2. Data analysis 22
4.3. Text mining of crowdfunding campaigns 24
4.4. Design of a data-driven technology foresight process 26 4.5. Design and development of effective crowdfunding based foresight methods 28
4.5.1. Word clouds 28
4.5.2. Keyword emergence map 29
4.5.3. Market portfolio map 30
4.5.4. Technology risk map 30
4.5.5. Market hype curve 31
4.5.6. Co-word networks 34
5. Demonstration of crowdfunding foresight methods 35
5.1. Definition of search fields 35
5.2. Identification of technology, product and market trends 36
5.2.1. Emerging technologies 36
5.2.2. Emerging markets 39
5.2.3. Identification of fields of uncertainty and risk 40
5.2.4. Identification of hypes and oversupply 41
6. Discussion and evaluation 51
6.1. The use of crowdfunding data in technology foresight 51
6.2. Revised technology foresight framework 52
6.3. Impact of the study on weak signal research 54
6.4. Discussion and validation of results at HYVE AG 55
7. Conclusion 58
7.1. Theoretical contributions 59
7.2. Practical and managerial contributions 60
7.3. Limitations and future research 61
References 63
List of figures
Figure 1. Theoretical framework. ______________________________________________________________ 5 Figure 2. Data analysis framework. ___________________________________________________________ 23 Figure 3. Text mining process in RapidMiner. ___________________________________________________ 25 Figure 4. Data-driven technology foresight process. ______________________________________________ 27 Figure 5. Keyword emergence map. ___________________________________________________________ 29 Figure 6. Market portfolio map. ______________________________________________________________ 30 Figure 7. Technology risk map. _______________________________________________________________ 30 Figure 8. Market hype curve. ________________________________________________________________ 33 Figure 9. Market hype curve showing an emerging technology. _____________________________________ 33 Figure 10. Market hype curve showing a declining technology. _____________________________________ 33 Figure 11. Technology network with three layers: Market, product and technology. _____________________ 34 Figure 12. Word cloud for the term robot. ______________________________________________________ 36 Figure 13. Keyword emergence map, years 2009-2013. ___________________________________________ 38 Figure 14. Keyword emergence map, years 2013-2015. ___________________________________________ 38 Figure 15. Keyword emergence map, years 2015-2017. ___________________________________________ 39 Figure 16. Market portfolio map, years 2015-2017. ______________________________________________ 40 Figure 17. Technology risk map. ______________________________________________________________ 41 Figure 18. Market hype curve for robots. _______________________________________________________ 42 Figure 19. Market hype curve for drones. ______________________________________________________ 42 Figure 20. Unstructured co-word network for the term robot. ______________________________________ 44
Figure 21. Co-word network with three layered structure for the term robot. __________________________ 44 Figure 22. Example of a technology roadmap for drone development. ________________________________ 48 Figure 23. Co-word network for the term drone. _________________________________________________ 49 Figure 24. Market portfolio map, years 2009-2013. ______________________________________________ 71 Figure 25. Market portfolio map, years 2013-2015. ______________________________________________ 71
List of tables
Table 1. Data sources analyzed in technology foresight. ___________________________________________ 18 Table 2. Data dashboard example. ____________________________________________________________ 25 Table 3. Example output of the correlation matrix for the term robot. ________________________________ 43 Table 4. Development of weak signal technologies identified in this study. ____________________________ 45 Table 5. Linear regression model, RTF and RIR for weak signal technologies. __________________________ 46 Table 6. Existing studies using web and patent data for technology foresight/forecasting. _______________ 70 Table 7. Correlation matrix, RTF and RIR values (6 years). _________________________________________ 72 Table 8. Linear regression RTF and RIR values, including two-year time lag. ___________________________ 73
List of abbreviations
TF: Term Frequency
1.
Introduction
“When you are running a business, there is a constant need to reinvent oneself. One should have the foresight to stay ahead in times of rapid change
and rid ourselves of stickiness in any form in the business.” Shiv Nadar, founder of HCL technologies
1.1.
Context of the study and research goal
Today’s economic, scientific and social environments are highly characterized by the ever-increasing speed of technological change and disruptive technologies (Saritas & Burmaoglu, 2015). Apart from the potential creation of new opportunities for strategic investments, this also leads to emerging uncertainties and complexities that call for systematic ways to foresee, predict and shape technological change (Martin, 1995; Miles, 2010). Companies have to cope with their competitive business environment and need to react to these technological changes by the early detection of new trends and opportunities (Slaughter, 1997).
To do so, several foresight techniques have been developed, such as brainstorming analysis, scenario analysis, technology roadmapping, Delphi analysis and patent mining (Coates et al., 2001; Martino, 1993). Foresight methods are designed to support decision-making by analyzing future trends, technologies and innovations. These techniques primarily rely on qualitative approaches, knowledge of experts, as well as extensive desk and literature analysis. This, however, often results in an inefficient process that involves high expenditures of time, resources and costs. Furthermore, researchers criticize that traditional foresight activities are non-transparent, encourage isolated thinking and are limited to the domain-specific knowledge of participating experts (Cachia, Compañó & Da Costa, 2007; Geum, Lee, Lee & Park, 2015). Moreover, the increasing amount of data from various sources has led to information overflow that cannot be processed and analyzed manually by traditional approaches (Yoon, 2012). These points of critique have been particularly expressed about the process of technology roadmapping and scenario analysis (Cachia et al., 2007; Geum et al., 2015; Lee, Lee, Seol & Park, 2008).
years, patent and publication data has found its way into foresight research and activities (Abbas, Zhang & Khan, 2014). On the other hand, there is little research on the systematic exploitation of other data sources, such as web content. This is remarkable as through the rise of big data, many more options, actors and views exist that might constitute valuable input for analyzing future developments (Yaqoob et al., 2016). Recent studies started to exploit these new data sources, such as social media data and web news articles (Glassey, 2012; Kayser & Blind, 2017; Yoon, 2012). They suggest the use of text mining, the systematic
approach to analyze textual data, to extend the knowledge base for foresight activities. It is shown that the systematic examination of web data creates several opportunities to support human foresight practitioners and entails valuable input for strategic choices and decision -making. These insights are based on exploratory research methods analyzing the development of term frequencies during several periods. In this context, Yoon (2012) focused on the detection of early indicators in datasets, so called weak signals, to identify future business opportunities. Futurologists describe the identification of innovation signals and trends as a key to anticipating technological changes (Hiltunen, 2008; Holopainen & Toivonen, 2012).
A data source that has not been addressed yet is crowdfunding data. Crowdfunding platforms, such as Kickstarter or Indiegogo become increasingly popular amongst startups, inventors and investors. For foresight analysis, crowdfunding data is interesting as it contains large datasets of technological ideas and future innovations. These ideas and technologies are already evaluated by investors and consumers, who offer financial contributions in return for non-monetary or non-monetary givebacks. Based on these unique characteristics, crowdfunding data bears the potential to indicate future innovation opportunities.
analysis, are investigated in detail and the methods are embedded into the different phases of the foresight process. To assess and demonstrate the functionality of the proposed methods, a case study analyzing the technological field of robotics is presented.
Research goal: The goal of the research is to examine crowdfunding data to increase the knowledge base for technology foresight activities, by detecting emerging technologies and markets and thereby support the development of technology roadmaps and scenarios.
1.2.
Research question
The thesis is organized around the following research question:
How can text mining of crowdfunding data be applied to analyze the detection of emerging technologies, market developments and trends and thereby support the process of technology roadmapping and scenario planning?
Text mining is the empirical approach of evaluating unstructured textual data in a systematic way. Additionally, this thesis integrates the analysis and interpretation of contextual numerical data, such as investment and success rates of crowdfunding campaigns. The study focusses on technology foresight and therefore examines the development of technologies and technological trends. The primer goal is to support foresight analysts and extend the input for existing technology foresight processes by systematically analyzing a new data source and implementing specific data-driven analysis methods.
On the way of analyzing the research question, several sub-questions are being answered. These questions have been formulated to address the potential benefits of crowdfunding data to efficiently support the foresight process of technology roadmaps and scenarios and to fulfill the requirements of successful technology foresight approaches.
Regarding the analysis of crowdfunding data:
• Which methods can be applied to provide access and information about technological contexts and environments?
• Which methods can be applied to identify weak signals, emerging technologies and fields of increasing supply?
• Which methods can be applied to identify emerging market demand?
To answer these questions, new text mining based research methods are suggested that are specifically developed and customized for the use in crowdfunding analysis. These methods are designed in the form of visualization maps to make the results accessible for foresight researchers and easily reproducible in firms’ technology foresight applications. Furthermore, it is examined how these methods can be integrated into the process of technology roadmapping and scenario planning to extend the knowledge base of foresight activities.
1.3.
Theoretical underpinnings and structure of the thesis
The structure of the thesis follows the design science research framework as proposed by Peffers et al. (2007). This model is used to design, develop and demonstrate the application of new methods and research artifacts to resolve existing problems and limitations in the field of technology foresight.
2.
Theoretical Framework
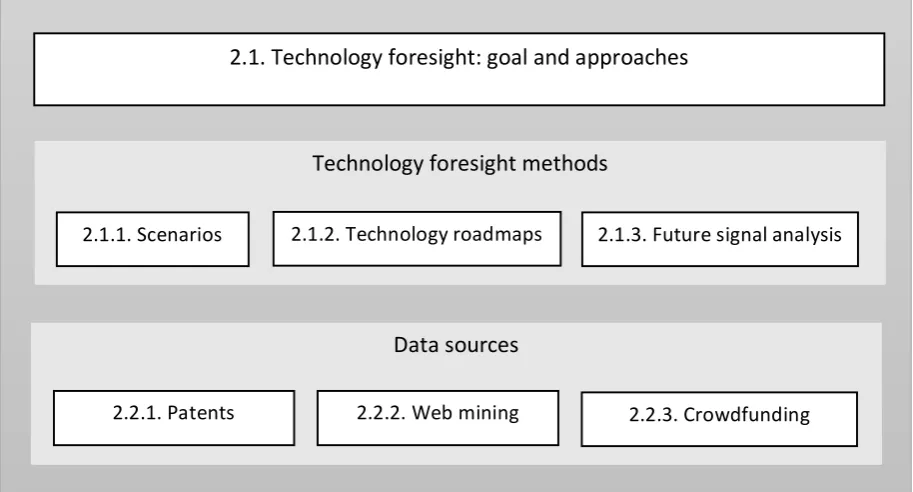
The theoretical framework follows a systematic structure (see figure 1). As technology foresight constitutes the overarching concept of this thesis, a profound introduction into the topic is provided and important definitions and methods are presented. The two foresight methods under investigation are technology roadmaps and scenario analysis. Therefore, recent theories about both are discussed. Then, the concept of future signal analysis is described, which is a technique to identify future technologies and emerging trends and therefore plays an important role for strategy making through technology roadmaps, as well as scenarios. In the subsequent chapters, data-driven methods, such as patent and web mining that have already been suggested for the use in technology foresight approaches are discussed. Furthermore, the principles of crowdfunding and important characteristics of crowdfunding data are outlined to show how the analysis of this data source might add relevant knowledge to the field of technology foresight analysis.
2.1. Technology foresight: goal and approaches
Technology foresight methods
2.1.1. Scenarios
Data sources
2.1.2. Technology roadmaps 2.1.3. Future signal analysis
[image:11.595.75.532.417.663.2]2.2.1. Patents 2.2.2. Web mining 2.2.3. Crowdfunding
2.1.
Technology foresight
The endeavor to analyze future opportunities for strategic planning is of course not new. The concept of technology foresight has its roots in the 1970s, when especially in Japan national technology planning campaigns were introduced (Georghiou et al., 2009; Miles, 2010). Irvine
and Martin (1984) introduced the term ‘foresight’ to describe strategic forward-looking technological analysis. The term finally encountered its breakthrough in the 1990s, when governments throughout the world implemented foresight policy tools to cope with scientific, technological and innovation-related issues (Miles, 2010; Miles, Meissner, Vonortas & Carayannis, 2017). In the following years, governmental programs and researchers used the terms ‘foresight’ and ‘forecasting’ more or less as synonyms to describe future oriented
activities (Georghiou et al., 2009). This led to considerable definitional confusions as there actually exist important differences between both (Georghiou et al., 2009; Martin, 2010). Technology forecasting is an approach to predict and reflect a single future event, such as future revenues, prices or sales. This thesis focusses on the process of technology foresight. Technology foresight is a less deterministic approach that seeks to explore multiple, plausible and contingent pathways that can shape and elaborate an uncertain future (Saritas & Burmaoglu, 2015). From its beginnings as a policymaking tool, the principles of technology foresight diffused through a wide range of regions, companies and organizations during the last decades (Pietrobelli & Puppato, 2016).
Definition of technology foresight
foresight does not predict the probability of future events, but serves actors as early-warning and action tool to actively shape future outcomes; (3) foresight is an open domain that should not be restricted to a small number of experts. Pietrobelli and Puppato (2016) emphasize that technology foresight supports societies and economies to define strategic areas in which the future of science and technology would lead. Researchers highlight that the participatory approach of technology foresight applications does not only increase the awareness, accountability and transparency of future technologies, but also bears the potential to influence future technological directions (Miles, 2010; Pietrobelli & Puppato, 2016). This enables the extension of strategic insights and facilitates decision making.
Technology foresight process
Voros (2003) created a generic foresight process framework that is based on prior works of Horton (1999) and Slaughter (1989). The process consists of three phases for applying foresight activities. The first phase (input phase) is about gathering information, scanning the environment and setting overall objectives, such as the time horizon and process scope. The second step (foresight work) is about the application of foresight methods, including the analysis and interpretation of the data that has been generated in the input phase. The outputs are then presented in the third phase (output phase) in the form of reports, presentations or workshops to generate an expansion of perceptions and perceived options. Voros (2003) furthermore distinguishes between the output of the foresight process (strategic thinking) and the subsequent interpretation of results that lead to the strategic actions taken by the organization. This implies that the foresight process provides relevant input for the strategic decisions in organizations.
Technology foresight methods
Delphi analysis and technology roadmapping rank among the key foresight methods. These approaches are primarily based on qualitative (scenarios) or semi-qualitative (roadmaps) techniques, which may cause limitations, such as subjectivity and lack of transparency. To address these limitations, recent foresight studies suggest the implementation of quantitative approaches during the foresight process (Saritas & Burmaoglu, 2015). Therefore, current developments in foresight analysis are increasingly influenced by the integration of new data sources and the rise of web 2.0 applications. This even prompted researchers to develop the term ‘foresight 2.0’ (Schatzmann, Schäfer & Eichelbaum, 2013). They argue that the rapid increase of content generated by a large number of users can create completely new forms of open and collaborative foresight projects. This leads away from processes that are solely based on subjective expert opinions and results in approaches that combine their expertise with digital-collaborative intelligence. Researchers are convinced that foresight 2.0 applications enable transparent, efficient and rapid foresight approaches (Schatzmann et al., 2013). The systematic analysis of new data sources through text mining might be a building block in the process of new foresight 2.0 applications. Therefore, it will be examined how the methods developed in this thesis can be implemented into the process framework of existing foresight techniques.
2.1.1. Scenario analysis
Scenario analysis is a popular foresight method used in technology strategy development (Schwarz, 2008; Ramirez & Wilkinson, 2014; Tran & Daim, 2008). The scenario process achieved notoriety by its application at Royal Dutch/Shell, developed by Pierre Wack in 1984. Wack (1985) defined scenario planning as a discipline for “rediscovering the original
entrepreneurial power of creative foresight in contexts of accelerated change, greater complexity and genuine uncertainty” (Wack, 1985, p. 150).The purpose of the process is to
literature by formulating a general framework of the scenario process (Burt, Wright, Bradfield, Cairns & van der Heijden, 2006; van der Heijden, 2005; Tapinos, 2012). Tapinos (2012) proposed a scheme for a generic scenario process that consists of eight steps: (1) Defining the scope of the exercise; (2) identifying factors of external uncertainty; (3) reducing or clustering the uncertainties; (4) developing initial scenario themes; (5) checking for internal consistency; (6) expressing scenarios in narratives; (7) assessing the impact of scenarios and (8) developing and selecting potential strategies.
Despite its benefits, the process of scenario development also entails weaknesses (Mietzner & Reger, 2005). Scenario planning is said to be very time-consuming and requires much effort. Large volumes of data and information from different sources are required to study and assess the field of research. Another point of critique is the almost exclusive focus on qualitative data and expert views that leads to non-transparent and subjective results (Hussain, Tapinos & Knight, 2017; Mietzner & Reger, 2005). Data-driven tools bear the potential to address these weaknesses and support foresight practitioners in fulfilling the requirements for well written scenarios. However, studies analyzing the use of text mining for scenario analysis are rare and its particular benefit is not clearly defined yet. This thesis suggests that the use of quantitative crowdfunding based methods might serve as valuable input to develop more plausible and consistent scenarios. Empirical methods could support experts in several stages by providing new insights and facilitating the identification of relevant factors, future signals and alternative technologies. The use of text mining furthermore facilitates the process of desk and literature research which could lead to a substantial reduction of temporal and financial expenditures.
2.1.2. Technology roadmapping
access to information about the identification of critical product needs and the determination of technological alternatives and milestones (Garcia & Bray, 1997; Kostoff & Schaller, 2001). Technology roadmapping ranks among the most frequently used foresight techniques (Saritas & Burmaoglu, 2015). This popularity can be traced back to the extensive research that exists about different application fields (Barker & Smith, 1995; Battistella, De Toni & Pillon, 2015; Carvalho et al., 2013; Kostoff & Schaller, 2001; Moehrle et al., 2013; Phaal et al., 2004; Phaal & Muller, 2009; Saritas & Aylen, 2010).
As roadmapping can be conducted to address various organizational goals, several forms exist. Phaal et al. (2004) identified eight types of roadmaps: Product, service, strategic, long-range, knowledge asset, program, process and integration planning. This thesis focusses on product planning technology roadmaps. This type of roadmap is typically used to structure the development of new products and incremental innovations in firms. According to Phaal et al. (2004) product planning roadmaps constitute the most common type of technology roadmaps. The roadmap design is commonly based on the three main layers, market, product and technology, as well as their interrelations and time-based linkages. To successfully implement a roadmapping process, foresight experts have to explore and discuss the relationships between and within these layers (Phaal et al., 2004). Based on Garcia and Bray (1997) the systematic roadmapping process consists of three phases. In phase 1 (preliminary activity) the scope and boundaries for the roadmap have to be defined and a perceived need has to be identified. Phase 2 is about the development of the technology roadmap. This includes the identification of the relevant product, its related needs and critical requirements, the specification of major technological areas, as well as the identification of technology alternatives. In phase 3 (follow-up activity) the created roadmap is validated and reviewed and its implementation is developed.
al., 2017; Kajikawa, Kikuchi, Fukushima & Koyama, 2013; Phaal & Muller, 2009; Saritas & Aylen, 2010). Researchers claim that next-generation roadmapping tools need to support experts through adding intelligence to the process (Carvalho et al., 2013; Kayser & Blind, 2017; Yoon et al., 2008). The successful creation of technology roadmaps is highly dependent on the available information about the development of markets, products and technologies (Saritas & Aylen, 2010). Four major requirements can be defined to support this process: (1) extending the knowledge base through additional input, (2) integrating information about multiple layers and their relations (marketing, product, technology), (3) facilitating the identification of trends and alternatives, (4) providing impactful input for decision making. This thesis strives to contribute to these four requirements. The use of text mining based analytics allows to access external data and integrate a huge amount of additional information that could not be processed manually. Impactful methods need to provide information about emerging technologies and market opportunities and indicate the relationships within and between the different roadmap layers. The examination of trends and emerging signals can be used to discuss and present the analyzed data and thus facilitate decision making.
2.1.3. Future signal analysis
easy. Already Ansoff (1975) noticed that their identification requires sensitivity, expertise and creativity. Since for a long time, all suggested approaches to examine future signals relied on qualitative methods, such as interview techniques (Geerlings & Rienstra, 2003; Toivonen, 2004), discussions about the reliability of future signal analysis as a foresight method evolved. Popper (2008) reveals that due to missing guidance, the use of weak signal analysis in technology foresight is rare and quantitative empirical methods are still underdeveloped. To address these limitations, Yoon (2012) introduced a method to detect weak signals based on text mining of web news articles. By analyzing the development of occurrence frequencies of pre-defined keywords, he created keyword portfolio maps that serve as indicators for weak and strong signal terms. The analysis is based on two major propositions: (1) Keywords of many occurrences in a collection are important and (2) recent appearances of keywords are more important than past appearances. The determination of weak signals is straightforward: Keywords that have a low term frequency, but a high growth rate can be classified as weak signals, keywords with large term frequency and high increasing rate as strong signals. Park & Cho (2017) used Yoon's (2012) approach to investigate upcoming trends in the smart grid industry. Both are convinced that this method is capable of complementing interview-based approaches and can be implemented into long-term business planning processes.
2.2.
Integrating external data sources into technology foresight
The creation of roadmaps and scenarios, as well as the detection of future signals is highly dependent on the integration of domain-specific expertise and knowledge. To complement and extend the knowledge base of experts, researchers started to analyze the exploitation of external data sources for technology foresight, such as patent data and web content. A detailed overview of foresight studies using external data sources is provided in Appendix 1.
2.2.1. Patent analysis
great variety of innovations over periods of time (Yoon & Park, 2004). Researchers emphasize the advantages of patent data over other data sources in terms of scope, uniqueness, objectivity, recentness, market relevance, availability, detailedness, standardization and analyzability (Gerken, Moehrle & Walter, 2010; Tseng, Lin & Lin, 2007). As of common standards, all patents consist of textual content that includes the patent title, abstract, claims, and description (Bonino et al., 2010).
The evaluation of patents is a demanding task that requires much effort and expertise (Tseng et al., 2007). The utilization of automated tools can support experts to extract and analyze the information and speed up the analysis process (Abbas et al., 2014). To process these large volumes of data, different techniques evolved over time. Abbas et al. (2014) classified common patent analysis techniques into two major approaches: Text mining and visualization techniques. While text mining is applied to extract the information, visualization methods are used to represent the extracted output, simplify the handling of relevant data and enable faster interpretations for decision-making (Keller & Tergan, 2005). Meanwhile, there exist a number of studies that deal with the use of text mining of patent data for technology foresight (Choi, Kim, Yoon, Kim & Lee, 2013; Jin, Jeong & Yoon, 2014; Lee et al., 2008; Park, Ree & Kim, 2013; Tseng et al., 2007; Yoon et al., 2008; Yoon et al., 2013).
Particularly noteworthy is the study of Lee et al. (2008) who used keyword-based text mining to derive ideas and development paths for creating new products and technologies. They suggest the use of patent maps that are embedded into a firm’s technology roadmapping process. The keyword portfolio map shows the occurrence frequency of technological keywords and their increasing rate over time. Keywords are classified into four different types: Core, emerging, established and declining keywords. While core keywords are characterized by a high frequency of appearance and a high rate of increase, the most interesting category for future opportunities is the group of emerging keywords that occur moderately often at a high increasing rate. In fact, this approach is very similar to Yoon's (2012) method for detecting weak signals. Another approach, the keyword relationship map, is based on a co-word analysis of keywords and shows the relations and co-occurrences between different attributes. Technologies that are highly related to each other could be considered simultaneously in future product designs. The applicability of the methods has been confirmed in a case study, leading to more efficient and cost-effective insights for companies.
basis for this study. The evaluation of crowdfunding data can draw upon the same underlying methodological principles, such as the application of text mining-based visualizations that have been suggested by Lee et al. (2008) and Tseng et al. (2007).
2.2.2. Web mining
Next to the analysis of patent data, first approaches exist that make use of web content to extend the input for foresight analysis. Yoon (2012), as well as Park and Cho (2017) analyze web news articles to identify weak signals. They argue that web news cover a wide range of political, economic, social and technological topics and represent a reliable and most often factual source of information (Yoon, 2012). However, as news articles do not contain standardized technological descriptions, a lot of redundant data has to be excluded from the analysis to detect technological keywords. Therefore, predefined term dictionaries are necessary to analyze the dataset and an unsupervised analysis process is rather inefficient. Since only textual data can be analyzed, results from the analysis of web news are limited to the evaluation of term occurrence frequencies.
retrospectively which impedes the identification of longer term trends. Furthermore, Twitter data is not representative of a society or population.
In recent years, an increasing number of studies focused on the analysis of web data to predict future outcomes or sales. Table 6 (see Appendix 1) provides an overview about current research that makes use of web-content to support foresight techniques or conduct predictive analytics. Therein, the difference between technology forecast and technology foresight becomes evident. The goal of this thesis is to provide quantitative backgrounds for strategic options to support decision making. Therefore, this study ties in with existing research about the use of web data to extend technology foresight methods. Results show that the analysis of web and patent data can lead to important implications. However, these studies also obtain several limitations, such as missing time horizons or generalizability. Thus, researchers postulate the establishment of further techniques and methods that can be embedded into the foresight process (Cachia et al., 2007; Kayser & Blind, 2017). It also becomes evident that none of these studies makes use of crowdfunding data.
2.2.3. Crowdfunding data
(Hienerth & Riar, 2013; Macht & Weatherston, 2014). To receive funds, founders have to explain their idea and define the scope of their project, including the target funding amount, the duration of the campaign and givebacks for investors. On the other hand, investors offer financial contributions in return for non-monetary or monetary givebacks. They are not only financially motivated, but also driven by intrinsic and social motives to be part of new, exciting and promising projects (Allison, Davis, Short & Webb, 2015; Lin, Boh & Goh, 2014; Ordanini, Miceli, Pizzetti & Parasuraman, 2011). Crowdfunding platforms serve as intermediaries between founders and investors. Platforms determine different funding rules and mechanisms to provide both sides with necessary information to reduce the risks of investments. Today, there exist various crowdfunding platforms that are specialized on different branches and industries. By 2012, there existed more than 800 active crowdfunding platforms (Crowdsourcing.org, 2012). The total funding volume of crowdfunding increased from 2.9 billion dollars in 2012 to more than 34 billion dollars per year and is expected to grow further (CrowdExpert, 2016). The total number of funding campaigns is estimated to amount to more than 13.7 million by 2021. In terms of technological innovations, alone in 2016, 14,267 technology related campaigns were successfully funded. The leading crowdfunding platform is Kickstarter, followed by Indiegogo, crowdfunder.co.uk and Fundrazr (The Crowdfunding Center, 2016). Kickstarter, which is used as data source in this thesis, was founded in 2009. Since then, over 380,000 campaigns in 14 different categories have been launched. As this thesis focusses on technology foresight, only campaigns related to this category are relevant to the data analysis process. More than 32,000 technology-related campaigns were published on Kickstarter until 2018, with a total funding value of more than 600 million dollars (Kickstarter, 2018).
simulated markets to trade and assess ideas represented by securities. They suggest the use of crowdfunding inside organizations for idea assessment as it provides better access to collective intelligence than surveys or open discussion forums. Although their study pursues a different motive, some interesting implications can be derived: (1) Crowdfunding platforms are marketplaces for ideas and products. (2) Crowdfunding serves as an effective tool for idea assessment and idea generation.
It can be concluded that the emergence of crowdfunding brought about fundamental changes to the funding of ideas, projects and startups and created various possibilities to test the demand for products on a market. After having analyzed the principles of crowdfunding, it is proposed that crowdfunding data also offers additional opportunities for technology foresight: First, crowdfunding platforms are pre-mass markets on which consumers invest in products before they are available on the actual market. Second, they contain large datasets of technological ideas and innovations. Third, investment and success rates can be evaluated. This reveals not only technological but also market and consumer perspectives for detecting future opportunities. It is assumed that these characteristics make crowdfunding particularly interesting to foresee market opportunities and adds additional knowledge to the process of technology foresight applications.
2.2.4. Selecting data sources for foresight applications
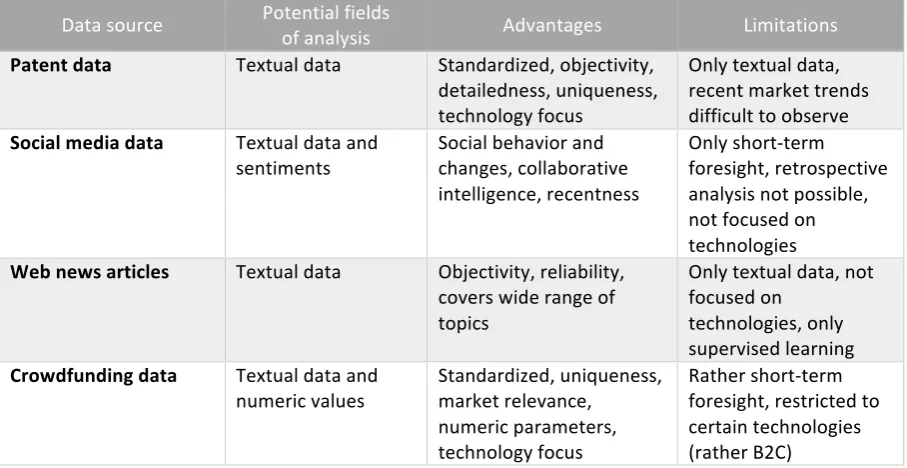
As outlined in the previous sections, recent literature proposed the use of external data sources and quantitative analysis techniques for technology foresight (see Appendix 1). It has to be noted that the output of a foresight approach highly depends on its input and that each data source is also subject to limitations. The possible use cases of the different data sources, patents, social media data, web news articles and crowdfunding are discussed in the following with regard to their specific characteristics and limitations that have been outlined in the preceding chapters.
certain technology. Finally, crowdfunding data might be the most flexible data source, as it allows to analyze textual descriptions and consumer behavior. Therefore, it can be used to conduct analyses of emerging technologies from different angles and not only compare the importance of technologies, but also examine the differences in supply and demand. This might be especially useful for strategic investment decisions. It might be beneficial to analyze various different data sources during the foresight process to include multiple views and information. This, however, would also be very time and resource consuming.
Data source Potential fields of analysis Advantages Limitations
Patent data Textual data Standardized, objectivity, detailedness, uniqueness, technology focus
Only textual data, recent market trends difficult to observe
Social media data Textual data and
sentiments Social behavior and changes, collaborative intelligence, recentness
Only short-term foresight, retrospective analysis not possible, not focused on technologies
Web news articles Textual data Objectivity, reliability, covers wide range of topics
Only textual data, not focused on
technologies, only supervised learning
Crowdfunding data Textual data and
numeric values Standardized, uniqueness, market relevance, numeric parameters, technology focus
[image:24.595.72.526.248.482.2]Rather short-term foresight, restricted to certain technologies (rather B2C)
3.
Research methodology
The research methodology is based on the design science research paradigm as proposed by Hevner, March, Park and Ram (2004), Peffers et al. (2007), as well as Cleven, Gubler and Hüner (2009). In this chapter, the fundamental principles of design science research are presented and it is shown how the structure of this thesis is aligned with the design science research process.
3.1.
Design science
According to Hevner et al. (2004) design science is used to extend the boundaries of human and organizational capabilities by creating new and innovative artifacts. Therefore, it focusses on the creation and development of applicable technology-based solutions for practical problems (Peffers et al., 2007). Hevner et al. (2004) defined several guidelines for conducting design science research in information service disciplines. Design science research requires the creation of innovative and purposeful artefacts that address a specified problem. The artifact itself must be relevant and useful for the solution of an unsolved and important business problem. Thereby, it draws from existing theories and knowledge. Finally, its utility, quality and efficacy must be demonstrated and evaluated.
This thesis follows the design science research approach and seeks to resolve existing limitations in the field of technology foresight analysis. To produce explicitly applicable research solutions, new exploratory quantitative data mining methods are designed that systematically analyze crowdfunding data to identify future signals, trends and opportunities. The validity, reliability and reproducibility of these methods is demonstrated by the application of illustrative case studies.
3.2.
Design science research process
including the planned design, demonstration and evaluation of the research artefacts to be developed in this thesis.
Problem identification and motivation
Foresight analysis and the identification of technological trends is a field of major interest for various stakeholders, such as startups, SMEs and large companies. It became evident that foresight methods foremost rely on subjective perceptions of experts and manual literature analysis. This contradicts with the aspiration of technology foresight to involve the participation and input of various views and leads to costly, non-transparent and inefficient foresight processes. Therefore, voices have been raised to integrate systematic methods and external data sources into traditional foresight activities. First approaches attempt to improve the efficiency of foresight through quantitative data. However, there is still a lack of clear guidance for effective empirical foresight methods. Furthermore, existing research approaches are limited to the analysis of textual data (Lee et al., 2008; Yoon, 2012; Kim & Lee, 2017).
Definition of the objectives for a solution
To enhance the efficiency and transparency of foresight processes and serve managers with relevant information, the main requirements to support technology foresight approaches have been examined. Successful technology roadmapping and scenario applications require profound insights about emerging technologies, markets and trends, as well as knowledge about alternative technologies and fields of uncertainty. Methods have to be developed that support foresight experts in each of these steps and data sources have to be analyzed that allow to draw conclusions on these topics. These methods are ideally built on systematic quantitative analyses to analyze large volumes of data and thereby enhance the efficiency and transparency of foresight approaches. Foresight methods need to be easily understandable, valid, reliable and reproducible. Furthermore, clear guidance has to be provided on how to implement these methods during the foresight process.
Design and development (see section 4)
subsequent chapter. The systematic analysis of the different data points does not only reveal technological, but also consumer perspectives for detecting future opportunities. After systematically analyzing the data, specific methods are used to make the results accessible and interpretable for foresight analysts and managers.
Demonstration (see section 5)
The functioning and applicability of the proposed methods is demonstrated by examining an illustrative case about the development of robot technologies. According to Cleven et al. (2009) and Peffers et al. (2007) case studies are a valid research method to demonstrate the reliability and validity of designed methods. Therefore, first the application and results for each method are presented in section 5. Then, it is shown how they can be used during the process of technology roadmapping and scenario planning. This is achieved through the presentation of two narrative case studies to capture the essential meaning of the suggested methods.
Evaluation and communication (see section 6)
4.
Design of a crowdfunding data analysis for technology foresight
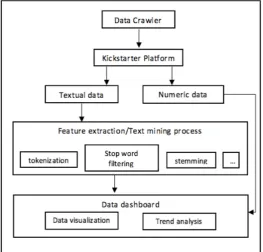
The following sections describe the design of a systematic crowdfunding data analysis to be applied in technology foresight activities. The chapter is separated into five major parts: First, the collection and characteristics of the underlying crowdfunding data is described. Then, the overall data analysis process is outlined. This study suggests a systematic text mining procedure to process the unstructured datasets that is a necessary prerequisite for the application of specific foresight methods. In section 4.4., the possible impact of crowdfunding based methods on foresight activities is illustrated and the design of a data-driven technology foresight process is proposed. Finally, the design and development of six different crowdfunding foresight methods are presented.
4.1.
Data collection
The research is based on crowdfunding data from Kickstarter, which is one of the most famous and biggest crowdfunding platforms. The data used in this study has been crawled and made publicly available by the data analytics company Webrobots using a Python web-crawler via the Kickstarter API (Webrobots, 2018). From these datasets, only those campaigns that are assigned to the category ‘technology’ have been filtered out. The final dataset entails data from 2009 until November 2017, in total more than 26,200 campaigns. The dataset contains diverse information about the single campaigns in this period: The title of the campaign, a short description, number of supporters, starting and end date, target funding amount, the amount actually funded and the link to the campaign page. To conduct trend analysis, the data has been chronologically sorted and semi-annual datasets have been created.
4.2.
Data analysis
widely used data mining and big data software tools. The software has been chosen as it provides the necessary tools to conduct advanced text mining tasks of large datasets and offers various options to pre-process the input as well as evaluate its output. The results from the text mining process are then analyzed in a specifically developed data dashboard. There, the analyzed term frequencies are combined with the contextual data, such as the amount of investments and the success rates of campaigns. This allows to examine and calculate the development of different parameters related to a certain technology. To facilitate and enable the causal interpretation of results, this thesis suggests the application of different visualization methods. Visualizations support analysts to deal with large volumes of data and have proven their use in strategy making (Card, Mackinlay & Shneiderman, 1999; Keller & Tergan, 2005). This thesis draws upon the findings of Yoon (2010), who suggests the use of visualization methods, such as maps, curves and networks for technology foresight. These methods have been selected for three reasons: (1) They facilitate the interpretation of results to be applied in foresight applications and strategy development. (2) They enable the presentation of available indicators of crowdfunding data. (3) They can be implemented and adjusted to the requirements of technology roadmaps and scenario analysis. A simplified overview of the analysis framework can be seen in figure 2.
4.3.
Text mining of crowdfunding campaigns
Text mining is a method to analyze and process textual data (Sanger & Feldman, 2007). It combines techniques from data mining, machine learning, natural language processing, information retrieval and knowledge management (Berry & Kogan, 2010; Sanger & Feldman, 2007). In recent years, text mining methods are increasingly used to process the growing volume of unstructured data from heterogeneous sources, commonly known as big data. Text mining approaches follow the common process framework of data mining applications, consisting of four main steps: Pre-processing tasks, core mining operations, presentation of layer components and refinement techniques (Sanger & Feldman, 2007; Weiss, Indurkhya, Zhang & Damerau, 2005). As results of text mining processes are often limited and not self-explanatory, their interpretation is crucial for the use in foresight analysis. Therefore, they should be conducted by domain experts that are able to embed the findings into the context of the foresight process (Kayser & Blind, 2017).
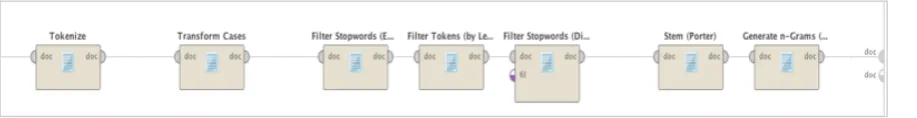
analytics and proved to be very efficient (Hofmann & Chisholm, 2016). Finally, the generate n-gram operator has been executed. This operator enables the aggregation of words that typically occur together, such as for example smartphone and app. The use of n-grams, typically bigrams or trigrams, offers new and useful insights for statistical evaluations.
Figure 3. Text mining process in RapidMiner.
The output of this process leads to a document vector file that indicates the occurrence frequency of terms. The results from the text mining process were then analyzed in a specifically developed data dashboard. There, the determined word frequencies have been combined with the contextual data of the respective campaigns, such as the amount of investments and success rates. The values of different periods were used to calculate the increasing rates of term frequencies (TF) and investment rates. The generation of co-word networks is based on the applications of TF-related correlation matrices using RapidMiner. To make the analyzed values accessible and interpretable for foresight practitioners, they were processed and aggregated into the corresponding methods that are presented in the following sections.
Term frequency
(TF)
TF/ number of Campaigns
$ invested (I) Investment goal
I/total investments
Investors count
Success-rate (inverse
risk-rate)
Spending/ investor
Android 47 0.018 618,541 1,718,550 0.0364 9,472 0.234 65
App 541 0.206 3,857,636 32,084,471 0.2272 29,476 0.114 131
Arduino 37 0.014 860,926 670,129 0.0507 9,080 0.702 95
artificial intelligence
7 0.003 22,714 1,191,500 0.0013 465 0.285 49
Battery 48 0.018 3,807,072 3,496,380 0.2243 10,396 0.416 366
blockchain 2 0.001 6,808 3,210,000 0.0004 75 0 91
bluetooth 28 0.011 4,375,674 1,049,500 0.2577 33,653 0.5 130
[image:31.595.72.527.513.755.2]4.4.
Design of a data-
driv
en technology foresight process
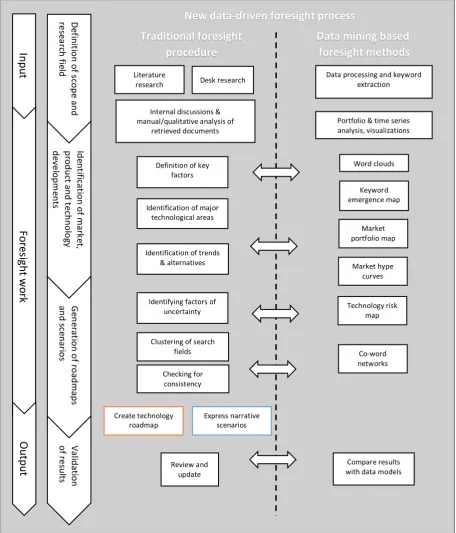
Data mining analysis of web data and the subsequent visualization and interpretation of results can provide several insights for experts about future technological trends. To support strategic planning in organizations, data-driven methods have to be embedded into structured foresight planning processes in which decision makers discuss the overall strategic orientation. Existing text mining research approaches are predominantly limited to supporting technology foresight processes in a specific stage, most commonly in the beginning of the process to support desk and literature research. This thesis strives to follow a different, more extended approach. Since crowdfunding data offers many data points for analyzing emerging technologies from different views, this thesis pursues the claim to implement these findings into structural foresight processes to assist foresight practitioners during different steps. The results of the proposed methods require contextual interpretation and should be understood as supportive tools for the analysis of external information. Therefore, this thesis suggests the design of a data-driven foresight process that combines qualitative thinking and quantitative methods.
Text processing and keyword Market hype curve Word In pu t Fo re sig ht w ork Ou tp ut De fin itio n o f s co pe an d re se arc h f ield Ide nt ific ati on of m ark et, pr oduc t a nd te chno lo gy de ve lo pm ent s Ge ne ra tio n o f r oa dm ap s an d s ce nar io s Va lid ati on of re su lts Traditional foresight procedure
Data mining based foresight methods
Clustering of search fields Literature
research Desk research
Identification of major technological areas Internal discussions & manual/qualitative analysis of
retrieved documents
Identifying factors of uncertainty Definition of key
factors
Identification of trends & alternatives Checking for consistency Review and update Keyword emergence map Market portfolio map Portfolio & time series analysis, visualizations Technology risk map Co-word networks Compare results with data models Data processing and keyword
[image:33.595.74.531.91.625.2]extraction Word clouds Express narrative scenarios Create technology roadmap Market hype curves New data-driven foresight process
4.5.
Design and development of effective crowdfunding based foresight
methods
The following sections describe the development of six methods that are designed to derive useful results from the crowdfunding datasets to support technology foresight research. The analysis methods are inspired by the propositions of Lee et al. (2008), Yoon (2010), Yoon (2012) and Kayser and Blind (2017), who conducted first research on the support of technology roadmapping and scenario planning through text mining analysis. The methods are based on different variables that can be extracted from crowdfunding data (see table 2). Next to term frequencies (TF), the amount of investments (I) and success rates are particularly examined. Through the application of different analysis techniques such as co-word analysis, networks and the conjunction of textual and numerical data, specific methods are developed that are aligned with the requirements of foresight planning as proposed in section 4.4.. The methods are based on a general proposition regarding the quantitative analysis of crowdfunding campaigns.
Proposition 1.Campaigns that contain a certain technological keyword of interest primarily deal with the development and planned commercialization of this specific technology.
4.5.1. Word clouds
4.5.2. Keyword emergence map
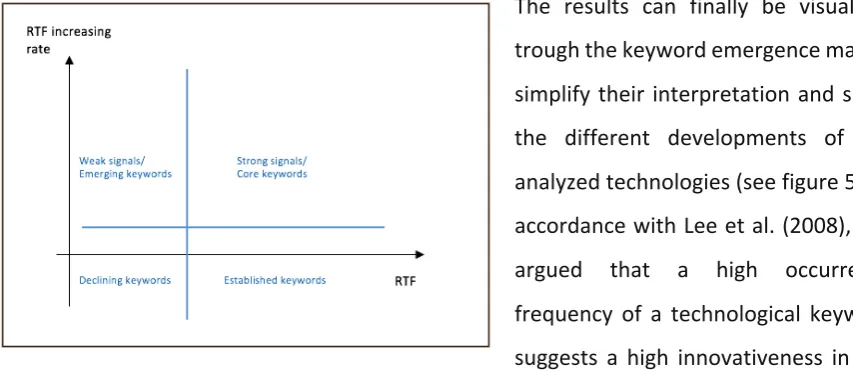
As data from several periods is analyzed, trend analysis can be conducted that is based on the methods of Yoon (2012) and Lee et al. (2008). They argue that the evaluated increasing rates of term frequencies allow to draw conclusions on the detection of strong and weak signals: Based on the theories of Hiltunen (2008), topics that have a high increasing rate but a low absolute occurrence frequency possibly relate to weak signals. This thesis reincorporates these findings in the context of crowdfunding campaigns. The crowdfunding data from the years 2009 until 2017 is divided into 15 time periods. Each period lasts 6 months, except for the years 2009 and 2010, which are aggregated to one period, as the amount of data has been very rare in the early phase of Kickstarter. To control for the varying number of total campaigns in different periods, the term frequency (TF) is divided by the total number of campaigns to calculate the relative term frequency (RTF). Then, the average increasing rate of the RTF in the different periods is calculated.
!"# = "#&' (('
TF: term frequency; NN: total number of campaigns; i: certain term; j: point of time
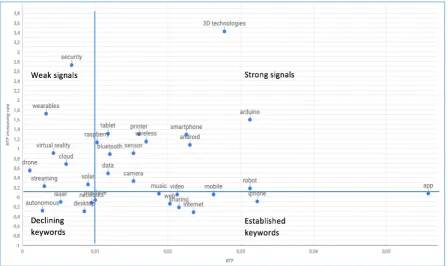
The results can finally be visualized trough the keyword emergence map to simplify their interpretation and show the different developments of the analyzed technologies (see figure 5). In accordance with Lee et al. (2008), it is argued that a high occurrence frequency of a technological keyword suggests a high innovativeness in this field of research. Simultaneously, a significant increase of keywords indicates that this technology is becoming increasingly important. The keyword emergence map hence represents a method that indicates if a certain technology is in an emerging, core, established or declining state.
[image:35.595.77.504.448.634.2]Proposition 2. Technological keywords of many occurrences in a dataset indicate high innovativeness and R&D activities in this technological field.
4.5.3. Market portfolio map
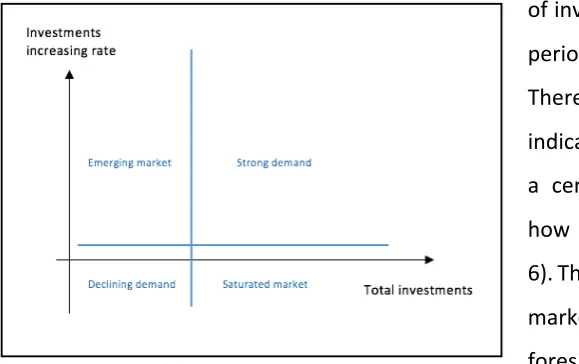
The marketplace character of crowdfunding platforms provides the opportunity to analyze demand-specific economic measures, such as investment rates. The market portfolio map is designed to serve as an indicator for the demand for technologies. The total amount of investments related to a technology keyword are plotted on the x-axis and the increasing rate of investments during the considered periods is plotted on the y-axis. Thereby, the market portfolio map indicates how strong the demand for a certain technology might be and how it evolves over time (see figure 6). This can be especially useful for the market perspective of technology foresight activities.
Proposition 3. The amount of investments and the investment increasing rates related to a technological keyword indicate the market demand for the respective technology.
4.5.4. Technology risk map
[image:36.595.76.366.190.372.2]To assess the risk involved with the development of technologies, the technology risk map is designed. It makes use of the success rates (inverse risk rate) of campaigns associated with the occurrence of a certain keyword. For each keyword, the corresponding success rate is plotted on the y-axis, while the RTF is plotted on the x-axis (see figure 7). The technology keywords can then be classified into four different types: Risky, competitive market, promising and low-risk/established keywords. If a technology keyword appears very frequently and its related projects tend to succeed, an investment in this technology is associated with relatively low risk. On the other hand, if a keyword appears very frequently
[image:36.595.76.506.480.680.2]but the average success rate of related campaigns is very low, this indicates that the market is very competitive and the probability to fail is comparatively high. The map provides relevant support for investment decisions and is especially useful for the business perspective of technology foresight.
Proposition 4. The higher the success rate of campaigns that are related to a certain technological keyword and the more campaigns exist for this keyword, the lower is the risk to develop or invest in this technology.
4.5.5. Market hype curve
To evaluate the development of a specific technology in more detail, the market hype curve approach is developed that integrates the analysis of both, term frequencies and investment rates of a single technological keyword over time. The market hype curve is used to visualize meaningful relations between the RTF and the relative amount of money that is invested in a certain technology. The relative investment rate (RIR) is calculated by dividing the amount of investments of a single technology by the total amount of investments in this period.
!)! = "))*+ +
I: amount of investments; TI: total amount of investments; i: certain term; j: point of time
The approach is based on a time series analysis to examine the evolution of term frequencies and investments. The analysis of historical data points can be used by managers to make decisions, based on the assumption that previous developments will continue into the future. Figure 8 shows that the time is plotted on the x-axis, while the y-axis indicates the values for RIR and RTF.
To facilitate the interpretation of time series, linear trend curves are calculated based on the development of RTF and RIR that indicate whether these values are generally increasing or decreasing. Since the development of RTF and RIR on crowdfunding platforms is often volatile, linear trend curves serve as indicators for the overall long-run developments of technologies. They are calculated through the following equation:
, = - × / + 1 Y: projected y value for the selected t value
t: selected period of time
Based on proposition 2, term frequencies are associated with the degree of innovativeness in a technological field. This is also an indicator for technology supply and market competition. On the other hand, high investments indicate a strong market demand for technologies (see proposition 3). This leads to the proposition that the development of RTF and RIR displayed through market hype curves serve as indicators for technology supply and market demand of technologies (see proposition 5).
Since the values for RTF and RIR do not always evolve in parallel, it is proposed that there are phases in which a market hype or oversupply for technologies exists. In phases of market hype, the RIR exceeds the RTF (see figure 8). This means that consumers invest a relatively high amount of money in the respective technologies, while the amount of innovations in this technological field is comparatively low. Thus, the market hype curve does not only indicate if a technology is becoming more relevant in terms of innovativeness and market demand, but also if there currently exists a hype or oversupply for the respective technology.
Concerning the linear trend curves, the most interesting technologies are those that show a high increasing rate in terms of RIR and a moderate increasing rate in RTF, while the investment curve surpasses the term frequency curve (see figure 9). In this case, the supply and demand for a technology are increasing. However, since the RIR curve exceeds the RTF values, this indicates that there is still potential for further innovations. On the other hand, declining term frequency and investment curves imply that a certain technology is disappearing from the market (see figure 10).
Proposition 5. The developments of relative term frequencies and relative investment rates serve as an indicator for technology supply and market demand.
Proposition 5.1. A period in which the relative investment rate is higher than the relative term frequency indicates a market hype (market demand > technology supply).
Proposition 5.2.A period in which the relative investment rate is lower than the relative term frequency indicates a surplus in supply (market demand < technology supply).
Proposition 5.3.An overall decrease in relative term frequency and relative investment rate implies that a technology is disappearing from the market.
Figure 8. Market hype curve.
Time (t) RTF,
RIR RIR
RTF
Market Hype Market Hype
Time (t) RTF,
RIR RIR
RTF
Time (t) RTF,
RIR RIR
[image:39.595.168.405.335.513.2]RTF
Figure 9. Market hype curve showing an emerging technology.
[image:39.595.168.404.549.728.2]4.5.6. Co-word networks
After the main trends, drivers and topics have been identified, the technology roadmaps or scenarios have to be created. In this phase, the relations within and between these attributes play a major role. For technology roadmapping, the different layers have to be connected and dependencies between objects need to be identified. For scenario analysis, the information has to be aggregated and combined to formulate future alternatives. In both cases, co-word analysis of the identified keywords can be used to visualize meaningful relations and dependencies in the form of networks. Term networks display the relations (edges) between several terms (nodes). The structure of the network indicates the importance of a certain term (by the number of connections), and also whether a node connects a pair of other nodes and therefore plays an interconnecting role in the network. The number and positioning of nodes and edges implies the density of a technological field (Yoon, 2010). This thesis proposes the creation of co-word networks to identify and present links between emerging technologies and related attributes. The goal is to use the information from crowdfunding data and create networks that indicate the correlations between technologies, products and market/application attributes. Figure 11 shows how these three-layered technology networks can be visualized to provide relevant insights in a structured and efficient way.
Market
Product
[image:40.595.75.497.477.755.2]Technology
5.
Demonstration of crowdfunding foresight methods
In this chapter, the functionality and applicability of the proposed crowdfunding foresight methods is demonstrated. The technology ‘robot’ has been selected as an example case to show how the suggested methods provide different insights to the evaluation of a specific technological field. The methods are described in the chronological order of the technology foresight process that has been presented in section 4.4.: (1) Definition of search fields, (2) identification of technology, product and market trends, (3) creation of roadmaps or future scenarios. Therefore, first the results of the consecutive methods are presented, then it is summarized in section 5.4. how these results can be practically implemented during the foresight process to create technology roadmaps and scenarios.
5.1.
Definition of search fields
To get an initial overview of the different aspects of a certain topic, the word cloud approach has been applied. As an example case, the superordinate topic ’robots’ has been chosen. Therefore, only campaigns that belong to the category robot have been analyzed through text mining. Furthermore, data from the years 2016 and 2017 has been evaluated to analyze current topics. As a result, a list of 115 keywords has been created that was used as input for the creation of word clouds. The term robot itself has been excluded from the list as it occurred disproportionally often and would have distorted the final visualization results. The font size of each term in the cloud displays the frequency of terms in the analyzed dataset and therefore indicates its overall importance for the topic. The final result is illustrated in figure 12. It shows that the topic ‘robot’ embraces a wide field of heterogeneous subtopics. Especially prominent is the term ‘programming’. This seems to be a key activity in the development of robots. Furthermore, several other technologies can be identified, such as drones, engines, laser, sensors, cameras, 3D printing, apps or artificial intelligence. The word cloud also shows different application fields of robots. Topics such as education, assistance, toy, game, children or work become apparent and specific product characteristics such as precision, interaction or modularity are mentioned. From a market perspective, affordability seems to play a major role.
application fields and product characteristics are displayed, which are important perspectives that have to be considered in experts’ discussions of foresight applications.
Figure 12. Word cloud for the term robot.
5.2.
Identification of technology, product and market trends
The second phase of the foresight activities involves the analysis of technology and market developments. This includes the specification of major technological areas and drivers and the identification of potential alternatives. To support these tasks, five different analysis methods are applied: Keyword emergence map, market portfolio map, technology risk map, market hype curve and co-word networks.
5.2.1. Emerging technologies