University of Warwick institutional repository: http://go.warwick.ac.uk/wrap
This paper is made available online in accordance with
publisher policies. Please scroll down to view the document
itself. Please refer to the repository record for this item and our
policy information available from the repository home page for
further information.
To see the final version of this paper please visit the publisher’s website.
Access to the published version may require a subscription.
Author(s): Nigel John Burroughs and Christoph Wülfing
Article Title: Differential Segregation in a Cell-Cell Contact Interface: The
Dynamics of the Immunological Synapse
Year of publication: 2002
Link to published version:
Differential Segregation in a Cell-Cell Contact Interface: The Dynamics of
the Immunological Synapse
Nigel John Burroughs* and Christoph Wu¨lfing†
*Mathematics Institute, University of Warwick, Coventry CV4 7AL, United Kingdom; and†Center for Immunology, University of Texas
Southwestern Medical Center, Dallas, Texas 75390-9093 USA
ABSTRACT Receptor-ligand couples in the cell-cell contact interface between a T cell and an antigen-presenting cell form distinct geometric patterns and undergo spatial rearrangement within the contact interface. Spatial segregation of the antigen and adhesion receptors occurs within seconds of contact, central aggregation of the antigen receptor then occurring over 1-5 min. This structure, called the immunological synapse, is becoming a paradigm for localized signaling. However, the mechanisms driving its formation, in particular spatial segregation, are currently not understood. With a reaction diffusion model incorporating thermodynamics, elasticity, and reaction kinetics, we examine the hypothesis that differing bond lengths (extracellular domain size) is the driving force behind molecular segregation. We derive two key conditions necessary for segregation: a thermodynamic criterion on the effective bond elasticity and a requirement for the seeding/nucleation of domains. Domains have a minimum length scale and will only spontaneously coalesce/aggregate if the contact area is small or the membrane relaxation distance large. Otherwise, differential attachment of receptors to the cytoskeleton is required for central aggregation. Our analysis indicates that differential bond lengths have a significant effect on synapse dynamics, i.e., there is a significant contribution to the free energy of the interaction, suggesting that segregation by differential bond length is important in cell-cell contact interfaces and the immunological synapse.
INTRODUCTION
Cell-cell contact is a fundamental process in biology both for information transfer and exchange of molecular mate-rial. In bacteria (F pilus formation) and yeasts (cell conju-gation) it is instrumental in exchange of DNA. In multicel-lular organisms it has principally two functions: adhesion/ structural support, and signaling. The neurological synapse has been the paradigm for cell-cell signaling for many years; a static long-term synapse mediating translocation of chemical signals across the interface. However, a highly dynamic patterning of molecule rearrangement and aggre-gation has been observed to form in cell-cell contacts be-tween T cells and antigen-presenting cells (Bromley et al., 2001; van der Merwe et al., 2000) that leads to T cell activation and proliferation and possible killing of the an-tigen-presenting cell. There is a specific sequence of mo-lecular movements within the contact region; adhesion mol-ecules appear to centrally aggregate initially, and then within 1–5 min these move to an outer ring of the interface with a central region composed of antigen receptors that form the signaling aggregate (Grakoui et al., 1999; Krum-mel et al., 2000; Monks et al., 1998). This structure has been referred to as theimmunological synapse.The driving force for the exclusion between antigen and adhesion molecules and their concerted movement is still debated. However, there are a number of key observations that provide the
basis of a theoretical framework. Small beads with attached antibodies move into the interface, indicating that the T cell cytoskeleton has a global polarized movement toward the interface (Wu¨lfing and Davis, 1998). Secondly, the recep-tor-ligand pairs have differing lengths: the antigen receptor bond is short at 14 nm, while the adhesion bond is long at 41 nm (Wild et al., 1999). Minimization of bond energy could therefore drive segregation through formation of lo-calized regions of different interface depths, enriched in particular molecular species, that are then aggregated by active transportation. Differential bond length driven segre-gation of kinases and phosphatases has been suggested as a means of T cell activation (Davis and van der Merwe, 1996).
Fundamentally, there is a distinction between segregation (the mutual exclusion between the adhesion and antigen receptors) and central aggregation of the antigen receptor (Dustin et al., 1998). This is suggested by the different time scales of the two phenomena: segregation occurs on the scale of seconds, aggregation on minutes. Experimentally, this distinction can be realized in systems that only segre-gate (Dustin et al., 1998) in contrast to the original synapse studies that display segregation and central aggregation. A failure to signal to the cytoskeleton is implicated in this lack of aggregation. There is a further distinction from capping (Taylor et al., 1971; Schreiner and Unanue, 1977) where receptors aggregate at interfaces presenting surface-bound antigen due to bond formation.
The central premise of this paper is that thermodynamic processes can cause segregation. The observation that seg-regation correlates with extracellular domain sizes, i.e., short bonds (14 nm) segregate from long bonds (41 nm), Submitted September 16, 2001 and accepted for publication February 20,
2002.
Address reprint requests to Nigel John Burroughs, Mathematics Institute, University of Warwick, Coventry CV4 7AL, UK. Tel.: 44-24-7652 4682; Fax: 44-24-7652 4182; E-mail: [email protected].
ing and compression may be responsible. The key issue is whether there is a sufficient increase in the total number of bonds formed in the interface, as a result of local optimal membrane separation, to balance the entropy costs of seg-regation. We examine a continuum model of the immuno-logical synapse to analyze the underlying physical processes driving its formation; in particular, whether differing extra-cellular domain sizes can explain the observations. An ear-lier model based on similar processes concluded that the mature synapse pattern could be a consequence of extracel-lular domain size differences alone (Qi et al., 2001). How-ever, their model is unable to explain why some systems only display segregation. Our analysis identifies three key factors in segregation and aggregation; first, segregation must be thermodynamically favorable, i.e., there must be significant free energy associated with bond stretching; sec-ond, domains of different membrane separations must be seeded by spatial heterogeneity either in the membrane separation or receptor/ligand densities; and finally, differ-ential attachment to the cytoskeleton is required for central aggregation. The key question is whether the first criterion is satisfied. Our estimates suggest this is so; however, direct experimental verification is required.
THE IMMUNOLOGICAL SYNAPSE
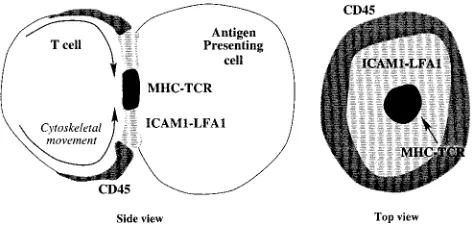
Pathogens are detected by the adaptive immune system through processing of proteins into small peptides (8 –15 amino acids), which are presented on the surface of antigen-presenting cells (APCs) held within the cleft of MHC mol-ecules (Janeway and Travers, 1997). The presented peptide profile is continuously scrutinized by the T cell repertoire: a T cell recognizing a small number of peptide sequences with recognition occurring through the T cell receptor (TCR). The presence of a pathogen perturbs the peptide profile by the appearance of peptides that lie outside the set of peptides derivable from self proteins; the latter consti-tutes the “normal” reference self peptide profile. Thus an immune response involves the detection of the pathogen by T cells specific for pathogen sequences and activation and replication of those T cells. Such cells typically represent only a small fraction, 10⫺4–10⫺6, of the repertoire. The immunological synapse between the T cell and the APC is believed to be essential to the activation process, possibly allowing detection of low-frequency peptides within an excess of self on the APC surface. Important molecular species are the T cell receptor (TCR) for specific recogni-tion, the adhesion molecule LFA1, and a costimulatory molecule CD2 on the T cell, and their associated ligands MHC (and peptide), ICAM1, and CD58 (humans, CD48 in mice) on the APC. The majority of the synapse studies have involved T cells on an artificial lipid bilayer loaded with MHC-peptide (or CD48) and ICAM-1. Our theory will apply to both this scenario and the case of cell-cell contact.
Within seconds of synapse formation, adhesion mole-cules (LFA1-ICAM1) move into the interface (Wu¨lfing et al., 1998). Then, on the time scale of minutes, CD2-CD58 and TCR-MHC move into the center of the interface, ex-cluding LFA1-ICAM1 to a surrounding ring (Grakoui et al., 1999; Monks et al., 1998; van der Merwe et al., 2000) (Fig. 1). This aggregation takes the form of small domains (sub-micron diameter) moving into the center (Krummel et al., 2000). Evidence for possible mechanisms to drive synapse formation is as follows:
1. Molecular segregation (differential enrichment) corre-lates with bond length; TCR-MHC and CD2-CD48 are 14 –15 nm and LFA1-ICAM1 is estimated to be 41 nm (Wild et al., 1999). There is also direct evidence of interface depth correlating with molecule location by interference reflection microscopy (IRM), smaller bonds localizing at regions of tighter contact (Dustin et al., 1998; Grakoui et al., 1999). Further evidence for the importance of bond length comes from mutation studies that increased the CD2-CD48 bond length (Wild et al., 1999), T cell activation being suppressed;
2. Through a variety of techniques it has been observed that lipid bilayers are not homogeneous. Regions of unmelted (ordered) phases exist, called lipid rafts, produced by a higher density of hydrogen bonding between sphingolip-ids (Brown and London, 1998; Simons and Ikonen, 1997). Lipid rafts appear to segregate important signal-ing molecules, and may play a role in T cell activation (Janes et al., 1999; Viola and Lanzavecchia, 1999); 3. A global movement of the T cell cytoskeleton below the
lipid bilayer toward the center of the interface is ob-served in an actin- and myosin-dependent process (Wu¨lf-ing and Davis, 1998). Cytoskeleton-driven movement is not unique to this context (Forscher et al., 1992).
[image:3.605.313.549.59.173.2]Other systems only exhibit segregation, suggesting that segregation and aggregation are driven by different pro-cesses. In Dustin et al. (1998) central aggregation of the coreceptor couple CD2-CD48 and segregation from the adhesion molecule pair LFA1-ICAM1 is observed, while
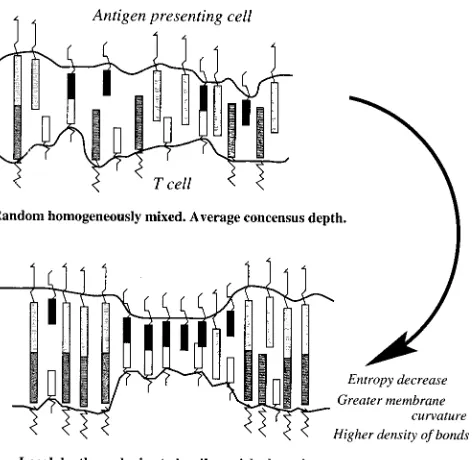
segregation alone is observed with a mutated CD2 lacking the C-terminal 20 residues. Segregation alone is also ob-served when a nonfunctional competitive form of the CD2 adaptor molecule CD2AD is introduced (Dustin et al., 1998); CD2AD interaction with CD2 requires the terminal 20 amino acids and connects CD2 to the cytoskeleton. This strongly suggests that the cytoskeleton is involved in central aggregation, possibly indicating that the global movement observed in Wu¨lfing and Davis (1998) fails to initiate in these aggregation free systems. Double positive thymocytes and natural killer cell systems have recently been reported that also only exhibit segregation; in the latter patches devoid of MHC appear and drift through the synapse (Carlin et al., 2001). Thus a mechanism is required to produce an effective repulsion between unlike receptors or complexes, i.e., either a direct thermodynamic potential, as in rafts, or induced through membrane elasticity effects and differing bond lengths (Fig. 2). Segregation would then be a conse-quence of a minimization of free energy. Thermodynamic minimization has also been implicated in the segregation of cells in the developing embryo driven by differential adhe-sion affinities (McNeill, 2000). However, the spatial sepa-ration between individual molecules in the interface (⬃100 nm) suggests that lateral forces cannot drive segregation in the synapse. In contrast, glycosylation of these molecules implies that they will homogeneously mix to minimize electrostatic repulsion forces (Rudd et al., 2001). Surface overcrowding is also unlikely to affect dynamics because only a fraction of total surface protein aggregates, in con-trast to external electrostatic potential aggregation where overcrowding is observed (Ryan et al., 1988).
It is currently unknown how the two mechanisms for segregation (1 and 2) interact in the development of, and in sustaining, the immunological synapse, or which is the more significant effect. We focus on the bond length hypothesis, given the strength of the data indicating that bond length differences alone can cause segregation and exclusion.
MODEL
[image:4.605.58.294.57.287.2]A mathematical model of the immunological synapse incorporating bond length differences and cytoskeletal movement is presented and analyzed by a combination of bifurcation theory and linear stability analysis (see next section). The physics and thermodynamics of these pro-cesses are explored, and conditions for the system to segregate formulated. In this paper we consider only two receptor-ligand pairs for simplicity, which we model on TCR-MHC and LFA1-ICAM1, respectively, although in a T cell/APC contact they represent the two classes of bond length. This is justified because these molecules have similar kinetics. Our model is described in 1D for simplicity, generalization to 2D is straightforward; the notation is summarized in Table 1.
FIGURE 2 Bond length-driven segregation of short and long bonds will occur if the number of bonds increases sufficiently to outweigh the costs of segregation.
TABLE 1 Model notation
Symbol Description
Variables
z Local membrane separation distance, nm
x Position in the contact interface,m
Ri Receptor density, couple*i
Ai Ligand density, couple*i
Ci Complex density, couple*i
Ri
tot ⫽Ri⫹Ci, total receptor density†
Ai
tot ⫽Ai⫹Ci, total ligand density‡
Cat Complex attached to the cytoskeleton
Rat TCR attached to the cytoskeleton
n(x) Normal force on membrane atx
Parameters
Li Natural bond length, couple*i
i Effective bond elasticity, couple*i
Di,Di
L,Dci Diffusion constants (receptor, ligand, complex)
ki
on(z) Forward reaction rate,‡couple*i
ki
off(z) Reverse reaction rate,‡couple*i
pon Cytoskeletal attachment rate
poff Cytoskeletal detachment rate
v(x) Local cytoskeletal speed
B Membrane rigidity
T Membrane tension
w Glycocalyx potential
z0 Glycocalyx equilibrium distance
s Diameter of typical receptor/ligand
kB Boltzmann constant
ther,c Bifurcation thresholds
*Couples referred to in the text are 1⫽TCR-MHC or CD2-CD48, 2⫽ LFA1-ICAM1.
†
Also includes attached species if present in model.
‡
[image:4.605.314.552.75.361.2]Our model incorporates bond elasticity, molecule diffu-sion, and cell elasticity. The basic methodology utilizes a local contact area depthz(x) as a dynamic variable, i.e., the distance between the two bilayers/membranes in a cell-cell contact, or the cell membrane height above the plane as a function of positionxin the contact interface. The depth of the interface responds to local molecular bond forces and local curvature. In turn, reaction kinetics are affected by the local depth of the interface. We exploit the ideas of Bell (Bell, 1978; Bell et al., 1984), modeling the bond, and transition state (Dembo et al., 1988), as elastic springs for which there is now experimental evidence (Alon et al., 1997). The on- off-rates change exponentially with mem-brane separationzthrough a dependence on the free energy (Dembo et al., 1988; Lauffenburger and Linderman, 1993),
kon共z兲⫽kon共L兲exp
冉
⫺⬘共z⫺L兲2 2kBT
冊
(1)
koff共z兲⫽koff共L兲exp
冉
共 ⫺ ⬘兲 共z⫺L兲2 2kBT
冊
.
Herekon(L) andkoff(L) are the normal unstressed rate con-stants,Lthe natural bond length, and,⬘are the effective bond spring constants. Binding forces are expected to de-crease with distance, and thus⬎⬘(slip bonds) (Dembo et al., 1988). The bond elasticitydetermines the bond free energyF(z)⫽F(L)⫹(z⫺L)2/2, and is related to the bond affinity by the thermodynamic relation
KA共z兲⫽KA共L兲exp
冉
⫺共z⫺L兲2 2kBT
冊
.
The free energy expansion about lengthLcan be extended to include additional (nonlinear) terms.
Membrane dynamics involves a consideration of the forces acting on the membrane, e.g., through receptor-li-gand binding and curvature effects. Assuming the mem-brane is heavily damped, we obtain the following equations in the small angle approximation (Evans, 1985)
⭸⭸zt⫽n⫺B ⭸4z ⭸x4⫹T
⭸2z
⭸x2 (2)
where B is the membrane rigidity relating the bending moment to the membrane curvature,M⫽ B(⭸2z/⭸x2), and
n⫽⫺
冘
ii共z⫺Li兲Ci⫺w共z⫺z
0兲 (3)
is the normal force of the bonds summed over the bound receptor-ligand complexesCi, where the complexCihas a natural bond length ofLiand elasticityi. The final term is a potential well approximation to the glycocalyx forces (Lauffenburger and Linderman, 1993), i.e., the balance be-tween the attractive van der Waals and repulsive electro-static forces around the minimum at z0. These forces are
weak compared to receptor-ligand bonds and therefore can be crudely approximated. The surface tension also has a weak spatial variation
⭸T
⭸x⫽⫺ B 2
⭸ ⭸x
冉
⭸2z ⭸x2
冊
2 ⫹n
⭸2z
⭸x2, (4)
although this is ignored in the simulations. Implicit in this analysis is that the membrane is homogeneous and the surface topography determined by the surface tension and rigidity. This is supported by the fact that the surfaces are tight in the synapse as indicated by IRM (Dustin et al., 1998; Grakoui et al., 1999) and by EM (Donnadieu et al., 2001). This contrasts to the presence of macrostructures such as microvilli, membrane ruffles, and lamellapodia on the rest of the cell (Dustin and Cooper, 2000) where the surface is determined by the underlying cytoskeleton.
The receptorRi, ligandAi, and complex Cidensities are given by
⭸Ri ⭸t ⫽D
i⭸ 2Ri
⭸x2 ⫹koff
i 共z兲Ci⫺k on i 共z兲RiAi
⭸Ai ⭸t ⫽DLi
⭸2Ai
⭸x2 ⫹koffi 共z兲Ci⫺koni 共z兲RiAi
(5)
⭸Ci ⭸t ⫽Dc
i ⭸ 2Ci
⭸x2 ⫺koff i 共
z兲Ci⫹k on i 共
z兲RiAi
⫹ Dci kBT
⭸ ⭸x
冉
i共z⫺Li兲Ci⭸z ⭸x
冊
where Di, DL
i, and D c
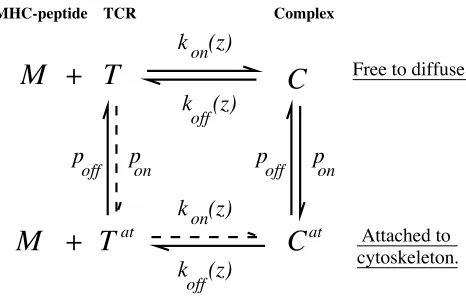
i are diffusion constants. Here we assume that receptors and ligands freely diffuse (see below for cytoskeletal attachment), and receptor-ligand complexes diffuse with a diffusion constant lower than either receptor or ligand separately. Forward and reverse rateskoni (z),koffi (z) for complexidepend on the local depth of the interfacez, as in Eq. 1. A schematic is shown in Fig. 3. The last term in the dynamics of the complexCi, Eq. 5, is the movement of complexes down the free energy gradient generated by changes in the depthz.Physically, this corresponds to the binding force between receptor and ligand not transmitting normal to the cell surface because of local changes of depth z.By decomposing into normal and tangential components, each molecule has a tangential force component i(z ⫺ Li)(⭸z/⭸x), using the small angle approximation. Assuming lateral motion is damped by viscosity, the flux is therefore
lateral force, and the fact that the complex is embedded in two opposing membranes.
A similar system of equations was used in Qi et al., 2001, except they included TCR downregulation and distin-guished the bond elasticity in Eq. 1, 25–170 N m⫺1, from Hookes constant in Eq. 3, 0.2N m⫺1. We argue these are both parametrized by a single elasticityi. Our different conclusions are undoubtably due to this difference and the high membrane relaxation distance,公B/T⬃1m, used in their study.
If a receptor attaches to the cytoskeleton, additional terms for attachment and detachment are included in Eqs. 5, and the attached species are included in the sum in Eq. 3. We assume there is differential attachment to the cytoskeleton; for simplicity, we assume only receptor 1 (TCR) attaches. The attached TCR-MHC complex,Cat, has dynamics
⭸Cat ⭸t ⫽⫺
⭸ ⭸x共v共x兲C
at兲⫺p offCat
⫹ponC1⫺koff
1 共z兲Cat⫹k on
1共z兲RatA1, (6)
and similarly for the attached TCRRat, Fig. 3. Herep on,poff are the cytoskeleton attachment and detachment rates, re-spectively. The complex dissociates into an attached recep-tor and free ligand with a rate equal to that of the unattached complex. We ignore any effects of attachment on bond kinetics because these forces are likely to be small given the slow velocity of cytoskeletal movement, and assume move-ment down the free energy gradient is prevented by attach-ment. Attached species move with the cytoskeleton. Cy-toskeletal movement is directed toward the center of the interface, so the velocity v(x) of the local cytoskeleton is position-dependent. We delay attachment to the cytoskele-ton by 60 s postconjugation to model the rearrangement of the MTOC. Other models, for example modeling the density of attachment sites on the cytoskeleton, give similar results.
There are a number of effects ignored in our model. For example, local membrane bending in the vicinity of a bond will probably induce additional aggregation of similar bond lengths not included in the above model because of our use of a local average separationz.This can be incorporated in the continuum model by addition of an interaction term to Eq. 5, e.g., for complex 1
C1共x兲
冕
dS共HA共x⫺x⬘,z兲C1共x⬘兲⫺HR共x⫺x⬘,z兲C2共x⬘兲兲with attraction and repulsion kernelsHAandHRdependent on the average local depth. These terms are negligible if the relaxation distance of the membrane公B/T is small com-pared to the separation between molecules, which appears to be the case.
To complete specification of the system we need to specify boundary conditions. We are only modeling the contact interface, and thus need to specify boundary condi-tions at the edge of the contact region. We use cyclic boundary conditions in all simulations. Alternative bound-ary conditions are zero flux for all receptors and ligands, and zero bending moment and transverse shear,⭸kz/⭸xk⫽0, k ⫽ 2, 3 for the membrane or zero contact angle and transverse shear,⭸kz/⭸xk⫽ 0, k⫽ 1, 3. Alternatively, the contact angle could be fixed, e.g., based on Young’s relation (Lauffenburger and Linderman, 1993). Because the relax-ation distance公B/Tis short compared to the diameter of the contact interface, these boundary conditions are not important to the overall dynamics, i.e., similar segregation and aggregation patterns are observed (not shown).
STEADY STATE ANALYSIS: AN ELASTICITY CRITERION
Analysis of the homogeneous system is the first step toward an understanding of the spatial dynamics of Eqs. 2 and 5. The number of steady states of the homogeneous system primarily depends on the balance of bond elasticity and bond affinity. This can be seen from the steady state criteria for Eqs. 3 and 5
koni 共L兲 koff
i 共L兲exp
冉
⫺i共z⫺L兲2 2kBT
冊
⫽Ci
共Atot
i ⫺Ci兲共R tot i ⫺Ci兲,
for eachi, (7)
冘
i i共z⫺Li兲Ci⫽w共z⫺z0兲. (8)
[image:6.605.58.291.57.205.2]This implies that Ci are approximately Gaussian with a height determined by the affinityKA0i ⫽koni (L)/koffi (L) and width公kBT/i. Ifwis negligible, the solutions to Eq. 8 are the intersection points of1(z⫺ L1)C1and2(L2⫺ z)C2. For low i these have one intersection point, for high i three: an average state and a state corresponding to each
bond length. A bifurcation plot with respect to bond elas-ticity is shown in Fig. 4. A linear stability analysis can be performed giving an analytic expression for the bifurcation points. For the simplified case where the two pairs are identical except for bond length, the average state (z ⫽ (L2⫹L1)/2⬅z0) is unstable when
共L1⫺L2兲2 4kBT ⬎
冉
1⫹KA0exp
冉
⫺共L1⫺L2兲2 8kBT
冊
⫻共Atot⫹Rtot⫺2C兲冊冉
1⫹w 2C
冊
(9)
whereCis the complex density at the average state. A lower bound on the threshold can be extracted from this relation that is independent of the concentrations of ligand and receptor,
ther⫽ 4kBT
共L1⫺L2兲2
. (10)
A second bifurcation of the average state occurs for larger in the presence of a glycocalyx potential (Fig. 4) with an approximate form
c ⬃
8kBT
共L1⫺L2兲2 loge
冉
kBT
共L1⫺L2兲2
KA0AtotRtot
w
冊
, (11) for the bifurcation point. This occurs because asincreases the number of bonds formed at the average state decreases, and eventually becomes insufficient to destabilize this stateagainst the stabilizing effect of the (weak) glycocalyx po-tential. This stabilization of the average state also occurs for low receptor or ligand concentrations because the second term in parentheses in Eq. 9 is large as a consequence of low complex densityC.As shown in Eq. 11,cdecreases with AtotandRtot. For realistic reaction kineticsther ⫽ 23 N m⫺1(ther⫽38N m⫺
1
) and the threshold in Eq. 9 is 68
N m⫺1(84N m⫺1), whenw ⫽ 0 (w ⫽ 5⫻ 10⫺3N
m⫺3); other parameters as in the appendix. Dependence on the receptor/ligand densities is determined by the strength of the glycocalyx potential; at densities of 30 and 50 molecules
m⫺2, respectively, the threshold is reduced to 59N m⫺1 andther⫽35N m⫺
1
atw⫽5⫻10⫺4Nm⫺3. There is no instability if w ⬎ 5 ⫻ 10⫺3 N m⫺3 at these densities.
The linear stability analysis can be extended to analyze the stability of the average steady state to spatially hetero-geneous perturbations, i.e., analyze the stability of the Fou-rier mode with wavenumbers, z⫽z0⫹ue
isx
, amplitudeu. The average state is unstable to spatial perturbations for⬎
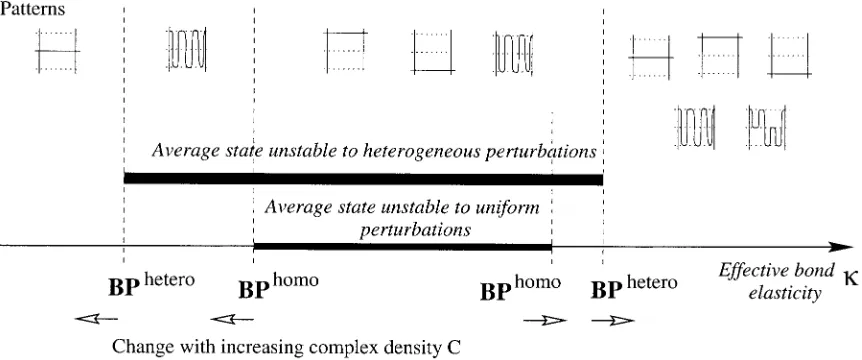
[image:7.605.61.547.58.242.2]ther(1⫹(w/2C)), i.e., for low elasticity the average state can be stable to homogeneous perturbations but unstable to spatially heterogeneous ones reminiscent of diffusion driven instability. This effect is primarily a consequence of the drift term moving complexes down the free energy gradient in Eq. 5. The glycocalyx potential also introduces a second bifurcation similar to that for homogeneous perturbations, i.e., at larger elasticities(bifurcation close to but abovec) the average state becomes stable to heterogeneous pertur-bations. These bifurcations are summarized in Fig. 5. The lower threshold for spatially heterogeneous instability (ig-noring the glycocalyx correction,w ⫽ 0), Eq. 10, can be
FIGURE 4 Bifurcation diagram showing contact region depth of the homogeneous steady state with respect to bond elasticity1⬅2, both couples
identical except for bond length. Stable steady states (s) and unstable (u) are indicated. (A) No glycocalyx potential. For low elasticity, only the average steady state with the average bond length exists, while at high elasticity three steady states exist. The small interval when five steady states exists is not robust with respect to model assumptions. The pitchfork bifurcation occurs because of the symmetry of the two receptor-ligand pairs with respect to all parameters except for bond length. In general, this unfolds to a saddle-node bifurcation. (B) With a glycocalyx potential,w⫽0.005Nm⫺3. A second
interpreted as the requirement that the amplitude of vibra-tional degrees of freedom under thermal excitation, i.e., root-mean-square fluctuation 公2kBT/, must be smaller than the stretching length (L2⫺L1)/公2. The thermal fluc-tuation公2kBT/ can possibly be identified with the con-finement width relating 2D and 3D affinities (Bell et al., 1984; Orsello et al., 2001; Qi et al., 2001).
There exists a range of wavenumberss僆[0,sc] that are unstable forin the instability regime, the maximum wave-number decreasing to zero as approaches either bifurca-tion point. The maximum wavenumbersc, which has a scale determined by 公k⫺/D defines the minimum domain size that can develop; on the scale of a fraction of a micron for the parameter values in the appendix. Fourier modes with lower wavenumbers grow faster, so the fastest-growing mode on linear theory iss⫽/l,wherelis the system size. Which wavenumbers dominate in the pattern, i.e., which domain size occurs, will depend on initial conditions, i.e., heterogeneity in the membrane separation when the T cell/ APC conjugate is formed.
For the system to ever display segregation condition (10),
⬎ ther must therefore be satisfied while receptor-ligand densities (and affinities) and the glycocalyx potential deter-mine the exact thresholds for spontaneous segregation to occur. Segregation is therefore amenable to kinetic control, i.e., shifting from a nonsegregated to a segregated state by receptor density or affinity changes. Avidity change on T cell activation of both CD2 (Hahn et al., 1992) and LFA1 (Lollo et al., 1993) are observed. If⬎csegregation may not occur; this will depend on the initial conditions. How-ever, we also note that domains with three different sepa-rations are now stable and thus more complex patterns could occur (Fig. 5), especially if there are receptor-ligand couples of intermediate bond length.
ELASTICITY
The continuum description in Eq. 5 is based on a local average depth z that averages out local forces. However, both receptor and ligand are embedded in lipid bilayers, and during bond formation transmit forces through the lipid bilayer and cytosol. For instance, if a receptor is pulled the membrane bends locally in addition to the stretching of the bond itself. This leads to the problem of estimating the elasticitybecause both effects contribute to the apparent bond elasticity in situ. The effective bond elasticity is therefore given by
⫺1⫽ bond
⫺1 ⫹ protein
⫺1 ⫹ mem
⫺1
where mem relates the membrane movement to a force applied to a small object in the membrane, bond is the elasticity of the bond, and protein that of the receptor and ligand along their length. For cell-cell interactions there are contributions from both membranes, i.e., if the membranes are elastically identical,⫺1 ⫽ bond⫺
1 ⫹ protein
⫺1 ⫹ 2mem⫺
1 . The key to determiningis estimating which component is most flexible.
In linear theory with the membrane modeled as an elastic 2D sheet, the displacement satisfies
[image:8.605.87.518.61.241.2]⫺Tⵜ2z⫹Bⵜ4z⫽0 (12) which leads to the modified Bessel equation upon integra-tion assuming axial symmetry. The soluintegra-tion of interest decays to zero as r 3 ⬁, and is given by z(r) ⫽ AK0 (公T/Br)/K0(公T/Bs) for a displacementAof a protein with radiuss,whereK0is the modified Bessel function of order zero. The membrane height decays exponentially away from the point of contact with decay constant (B/T)1/2, i.e., a decay length of⬃50 nm, parameters as in the appendix.
This compares to an average molecule separation of⬃100 nm for a density of 100 moleculesm⫺2on the cell surface. The effective elasticity is computed by either calculating the force required to displace the protein by a given distance or calculating the potential energy of this solution. The elas-ticity ismem⫽4T/loge(B/Ts
2
) ifs⬍⬍(B/T)1/2, the decay length. Fors⫽1 nm we obtainmem⬃1.4T,or⬃40N m⫺1. This is significantly lower than the elasticity of the protein itself, which is on the scale of mN m⫺1(Fritz et al., 1998), while bond elasticity is on the scale of N m⫺1 (L-selectin) (Alon et al., 1997). The latter is also comput-able from the enthalpy and bond breakage force giving similar values for biotin-avidin (Moy et al., 1994). Thus we conclude that the membrane will be the main determinant of the effective/in situelasticity, i.e., the nature of the receptor-ligand couple does not affect the bonds effective elasticity except through a weak dependence on protein diameter.
This calculation ofmemused an oversimplified model of the cell surface. Tether experiments have suggested that there is an effective osmotic pressure or adhesion between the surface membrane and the cytoskeleton (Dai and Sheetz, 1999), indicating that binding of the membrane to the cy-toskeleton must also be considered. An alternative method of analysis treats the cell as an elastic medium. Atomic force microscopy has measured the effective Young’s modulus of the cell. Although estimates vary depending on the cell type, typical values are in the range 1– 400 kPa (Le Grimellec et al., 1998; Raucher and Sheetz, 1999; Rotsch et al., 1997), while spatially the elasticity varies according to the local microstructure, e.g., actin filament density, microtubules, or organelles. For comparison, the Young’s modulus of a protein is on the scale of GPa (Alon et al., 1997). Treating the protein as a cylinder of radiuss pushing on the mem-brane, the elasticity is 8sY,/3 Young’s modulusY(Johnson, 1985). Fors⬃ 1 nm the elasticity is 2⫺ 103N m⫺1.
Combining these two approaches, we model a finite re-gion of elastic membrane with attachment sites to the cy-toskeleton in the neighbourhood of the bond. This requires boundary conditions for Eq. 12 to be given on the first derivative at the boundaries, i.e., at the protein interface. We take⭸z/⭸r⫽0 for simplicity. The effective elasticity is then determined by a combination of these two material elastic-ities, i.e., the surface tension and the cytoskeletal elasticity. IfLis the typical distance between cytoskeletal attachments, then the elasticity contributions from the membrane and the cytosol decrease and increase with L, respectively. The decrease of the former is determined by the decay length
公B/T. The contributions are approximately equal when L⬃50 nm. This is when the elasticity is maximal. Typical values over a variation of L are 40 –500N m⫺1(Y ⫽ 4 kPa,s⫽2 nm, T⫽ 30N m⫺1).
Currently, there are no direct measurements of the elas-ticity on this spatial scale. On a macroscopic scale, mi-crovilli have an elasticity of 43N m⫺1(Shao et al., 1998). Based on a diameter of 0.2– 0.4m, the above cell elasticity
theory would suggest that the elasticity should be signifi-cantly higher in the mN m⫺1 range. Such low elasticity possibly comes from special properties of the microvilli in producing tethers under pN forces that are vital to cell rolling and adhesion to endothelial cells in blood vessels (Shao et al., 1998). Microvilli are not present in the contact interface (Dustin and Cooper, 2000).
In summary, all estimates indicatememis larger than 2 N m⫺1, while 40N m⫺1is a more likely lower bound based on the surface tension calculation. Cytoskeletal ef-fects could, however, increase this by an order of magni-tude; the effective elasticity may therefore be under cellular control by changing the number of cytoskeletal attachments. Bilayer systems therefore lie in the segregation regime; however, T cell/APC conjugates require a membrane/cell elasticitymemhigher than⬃60N m⫺
1
, above the lower range of the estimates. We use ⫽ 40 N m⫺1 in our simulations. Segregation occurs for all higher values under suitable initial conditions.
RESULTS
make domain seeding highly robust and insensitive to the glycocalyx minima.
There are a number of length scales that determine the dynamics and patterning. Very small domains are unstable dynamically because of the free energy costs of domain walls (cf. minimum unstable wavenumbersc). Our calcula-tions indicate that domains are on the scale of a micron in diameter or greater, although asincreases from the lower threshold domains become smaller and increase in number. These length scales imply that to see segregation, the con-tact interface must be larger than a few microns in diameter. This is why segregation is so clear in Jurkat cells (Dustin et al., 1998), which have a contact region on the scale of 20
m, large compared to T cells. Domain walls have width
公B/T⬃50nmwhich, compared to the domain separation and domain size, means that these domains will not coalesce except over long time scales. Simulations confirm this con-clusion; in both 1D, Fig. 6, and 2D, Fig. 7, the domains remain unaggregated but take on a more geometric shape to minimize curvature. If domains are dense when generated there is coalescence of nearby domains, but this slows as domains become more separated (Fig. 7). These isolated domains would in fact drift through Brownian motion and
therefore may collide. To obtain coalescence and central aggregation of domains on a scale of minutes an additional mechanism is required. Cytoskeletal movement reorganizes the domains into a central aggregate of antigen receptors surrounded by a region of enhanced adhesion molecule density (Fig. 9), qualitatively identical to that observed in T cell synapses (Grakoui et al., 1999; Monks et al., 1998; van der Merwe et al., 2000). Our simulations in Fig. 7 and Fig. 9 compare favorably to the mutant and wild type CD2 experiments of Dustin et al., 1998, respectively.
In the 2D simulations (Figs. 7 and 9), we have introduced a bias toward adhesion molecule binding by using a lower TCR density than LFA1. This means that isolated domains of short bond couples (14 nm), TCR-MHC, appear in a long bond length background (41 nm). Bias can also be intro-duced by differing ligand densities, diffusion constants, bond affinities, or elasticities i. By altering this bias to favor the antigen receptor a reverse image can be produced, e.g., patches devoid of MHC occur as observed in natural killer cell synapses (Carlin et al., 2001).
[image:10.605.57.547.59.205.2]Factors that are not addressed by our model include the initial synapse location of long and short receptor pairs, i.e., the initial central location of the long bonds, and diffusion
FIGURE 6 Spatial instability (1D) in a two-receptor-ligand pair system with natural bond lengths of 14 and 41 nm, in absence of cytoskeletal attachment. Graphs show time sequences of (A) interface depth and (B) total ligand 1 density (MHC), every 2.5 s up to 60 s. Ligand 2 (ICAM1) has the inverse behavior, localizing with identical kinetics to the complement pattern toB.(C) Final pattern of MHC density. Initially the average contact area depth was 27.5 nm with thermal fluctuations, as shown in A, and the receptor and ligand densities were uniform. Lowering the bond elasticity constantbelow the threshold/bifurcation point prevents molecular segregation, i.e., the final state is uniform. Parameters as in the Appendix.
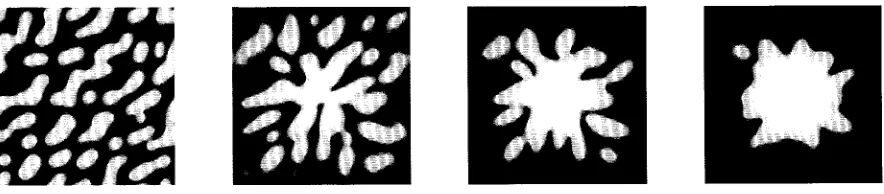
FIGURE 7 Segregation without aggregation in 2D. The spatial distribution of the membrane separationzis shown at 30 s, 1 min, 2 min, and 5 min. White 37 nm, black 18 nm. Receptor densities of 100 and 150 moleculesm⫺2for TCR and LFA1, respectively, bias the pattern toward a connected region with
[image:10.605.88.525.586.683.2]of molecules from the rest of the cell surface into the contact region (Wu¨lfing et al., 1998). The driving force for the former is at present unclear, but possibly due to active cytoskeletal movement flattening the cell against the surface at the edge of the interface. Diffusion of molecules from the rest of the cell is also possibly significant in the initial synapse structure (Qi et al., 2001), especially if MHC and LFA1 have different diffusion rates and mobility fractions. A full cell model that captures contact region boundary dynamics is required to analyze these issues. However, allowing for contact depth in this case is highly nontrivial because the small angle approximation breaks down. In effect, a model of cell-cell zipping up is required (Lauffen-burger and Linderman, 1993).
AMPLIFICATION OF THERMODYNAMIC SEPARATION
A key question that needs to be answered is whether the segregation threshold needs to be satisfied given that cy-toskeletal transport could aggregate TCR-MHC centrally in any case. Thus, under active central aggregation of TCR-MHC will segregation occur; i.e., are adhesion molecules excluded from the central region? A simple compartment model (Fig. 10) generalizes the argument and allows the essential characteristics to be studied. The essential question is when can bond length size differences amplify segrega-tion/aggregation created by another thermodynamic effect, e.g., differential solubility in rafts, or the active aggregation
produced by the cytoskeleton. In both of these cases a spatial gradient is established in one or more of the molec-ular species. This could cause a local adjustment of the contact interface depth, and thus increase segregation.
To simplify the analysis of the compartment model, we assume that the system is totally symmetric and the receptor-ligand pairs are identical except for length, i.e., z⫽(L2⫹L1)/2 in both compartments. Then we break the symmetry by introducing differential diffusion of one of the species⫹i ⬎⫺i , and compare the cases of⫽0 to non-zero elasticity.
DefineSi⫽Ri⫹Ci⫺R⬘i⫺C⬘ias the segregation factor, where Ri ⫹ Ci is the total amount of receptor in the left compartment, and the prime denotes quantities in the right compartment. Then the quantity
M⫽⭸⭸ logeS共兲兩⫽0
measures the amplification of aggregation through bond length differences. For instance, ifis of the order ofM⫺1, then the segregation factor S will increase by a factor of order e. Here we are assuming that the complex mixes slower than the receptors and ligands, i.e.,C⫾ ⬍ ⫾. If these are equal, then S is independent of the elasticity.
[image:11.605.59.287.59.158.2]Under the assumption that mixing between the two com-partments is slow (i.e., binding/unbinding kinetics is faster
FIGURE 8 Long and short bonds spatially segregate TCR-MHC form-ing isolated domains, excludform-ing LFA1-ICAM1.Left:MHC density;right:
[image:11.605.314.550.61.184.2]ICAM1 density. Simulation of Fig. 7 at 2 min.
FIGURE 9 Patterning with active cytoskeleton aggregation of TCR. MHC density at 1 min postconjugation before attachment to cytoskeleton, at 2 min, 3 min, and 4 min. TCR attachment to the cytoskeleton initiated at 1 min, i.e.,pon⫽0,t⬍60 s;pon⫽0.1 s⫺1fortⱖ60 s. Other parameters as in the
[image:11.605.82.524.585.682.2]Appendix.
than moving compartments), then we find thatM⬍ther⫺ 1
of Eq. 10. It is in fact close to this bound. Thus, significant amplification only occurs when the elasticity is of the order of/greater than ther. We conclude that both spontaneous segregation and amplification only occur when the energy of stretching is significant, i.e.,⬃theror larger.
CONCLUSIONS
Our model examines the basic physical processes that gov-ern contact interface dynamics and are possibly involved in immune synapse formation. Our analysis identifies three key conditions that have applicability beyond the model used here. First, bond stretching must be sufficiently expen-sive such that the average depth steady state is unstable to spatially heterogeneous perturbations. Bond length differ-ences set the scale of the threshold (Eq. 10) but reaction kinetics, receptor-ligand concentrations, and the glycocalyx potential fine-tune this threshold, allowing for dynamic control of segregation. More generally, there must exist a thermodynamic mechanism to overcome the entropy costs of segregation. Second, spatial fluctuations are required to seed domain formation. Thermal fluctuations in the mem-brane were used in our simulations; however, spatial heter-ogeneity in receptor or ligand densities, such as those caused by raft microdomains, could equally function to seed domain formation. Third, differential attachment to the cy-toskeleton must exist between the receptor species to achieve a central aggregation of one of the receptor-ligand pairs, working with segregation to generate the observed pattern. Without this cytoskeletal movement domains will not coalesce/centrally aggregate unless the relaxation length of the membrane公B/Tis larger or equal to domain sepa-ration distances.
With realistic parameter values we conclude that bond length differences contribute significant free energy to the system through local membrane depth changes. Bond length is therefore likely to be an important determinant in synapse formation and stability, as previously con-cluded by Qi et al., 2001. Other factors may contribute to segregation or rearrange the domains into a mature syn-apse pattern; the most significant is cytoskeletal-driven aggregation. Segregation in this theory, as opposed to central aggregation, is effectively a thermodynamic driven process to minimize free energy. Thus we predict that differential segregation is a passive process, i.e., it will occur outside of the cell context, for instance on micelles suitably loaded with receptors on a lipid bilayer surface provided the surface tension is high enough. Experiments with a mutant CD2 molecule (Dustin et al., 1998) that fail to induce cytoskeletal polarization still produce segregation of CD2-CD48 and LFA1-ICAM1 pairs, but no central aggregation. This is the closest experiment to date that could be argued as thermody-namic. The degree to which nonthermodynamic
pro-cesses such as signaling are involved in synapse forma-tion is of immense experimental interest, and a quesforma-tion that is highlighted by the modeling. Agonist peptides detected on an antigen-presenting cell by a T cell only constitute 0.02–2% of the MHC-peptide population, and yet over that range synapse formation occurs and stabi-lizes (Krummel et al., 2000). Direct thermodynamic changes caused by the presence of the agonist peptide are minimal, and thus to see a phase shift from no segrega-tion to segregasegrega-tion on increasing agonist concentrasegrega-tion there must be a significant change in the thermodynamic parameters. There is evidence that TCR signaling signif-icantly alters adhesion molecule LFA1 affinity (Lollo et al., 1993) and the coreceptor CD2 avidity (Hahn et al., 1992), although the latter is not due to expression level changes. Furthermore, the cell surface tension and cell membrane attachment to the cytoskeleton may be under control of PIP2 (Raucher et al., 2000), a signaling mol-ecule downstream of the TCR. We propose the following model for synapse formation: initial contact occurs with the average state (separation⬃25–30 nm) stable to both homogeneous and heterogeneous perturbations in mem-brane separation because of low complex densities. TCR recognition of MHC-agonist leads to TCR signaling and an upregulation of CD2 and LFA1 affinity and an in-crease in the effective elasticity . The antigen and adhesion complex densities increase taking the system into the heterogeneous instability regime. Domains of both bond lengths, 14 nm and 41 nm, are generated and segregation occurs within a minute, thereby stabilizing the conjugate through a further increase in complex den-sity. Active cytoskeletal transportation then rearranges the domains to form the mature synapse, thereby sustain-ing signalsustain-ing.
Simplistic models of the cytoskeleton were used in our calculations of the effective bond elasticity, and so, al-though indicative that an elasticity in the appropriate range is achieved, experimental confirmation is required. Neutro-phil surface tension appears to change on activation (Need-ham and Hochmuth, 1992), while on detection of the ap-propriate agonist peptide a T cell rounds up, which may indicate an increased surface tension. In addition, elasticity properties vary from cell to cell (Strey et al., 1995). There-fore, the effective elasticity of a receptor-ligand bond lying in a cell membrane needs to be measured for nanometer perturbations, ideally both pre and postsynapse formation. This will indicate whether effective bond elasticity corre-lates with the efficiency of synapse formation, as predicted here.
APPENDIX
Parameter values
2D; the lengthlof the region simulated is 10m, approximately the size of a contact region diameter.
Receptor-ligand couples
MHC-TCR and CD2-CD48 have a bond length of 14 nm and elasticity
1⫽40⫻10⫺6N m⫺1. The long bond couple, LFA1-ICAM1, has a
length of 41 nm, typical of an integrin plus the length of a five-immuno-globulin domain ligand, with the same elasticity. Only the bond length difference between the pairs and the effective elasticity are important; all other parameters can be altered within realistic ranges without affecting the results. The bond elasticity (for receptors and ligands embedded in lipid bilayers) is taken to lie in the lower range of the various estimates discussed in the text.
We use receptor and ligand densities of 100 –150 and 180 molecules per
m2, respectively (Johnson et al., 2000), equivalent to 104⫺106
mole-cules per cell. Because the MHC-peptide population will be mixed with
ⱕ20% loading by the agonist peptide (planar bilayers), we have used a low value for MHC density. We do not separate MHC-agonist and MHC loaded with a neutral peptide, for simplicity. In practice, the high degree of MHC aggregation implies that MHC loaded with peptides other than the agonist must also aggregate, suggesting receptor-ligand binding in this case (Wu¨lf-ing et al., 2002).
Diffusion constants of receptors and ligands are all taken to be 0.1
m2s⫺1(Favier et al., 2001), typical for proteins of this size,D⫽10⫺1⫺
10⫺2m2s⫺1. The diffusion coefficient of the complex is assumed half this
at 0.05m2s⫺1.
Molecular kinetics
TCR-MHC kineticsM⫹TºCare known to have low affinity, with a dissociation constant ofKD⬃10⫺100M, andkon⫽102⫺103M⫺1s⫺1
andkoff⬃0.05⫺0.1 s⫺1, as measured for a typical agonist (Lyons et al.,
1996). The LFA1-ICAM1 reaction has two affinities, differing by a factor of 200, with affinities on unstimulated T cells estimated as 100M(Lollo et al., 1993). These on/off rates are measured in solution. The only direct measurement of 2D kinetics is for the CD2-CD58 interaction where an affinity of 21 moleculesm⫺2was estimated (Dustin et al., 1996). The
traditional method for conversion between 2D and 3D is to assume a confinement depth (Lauffenburger and Linderman, 1993; Orsello et al., 2001), either from receptor length or thermodynamic considerations. An effective membrane thickness of 10 nm convertskonrates to an effective
surface rate constant (Bell et al., 1984), thus 1 M⫺1s⫺1converts to 1.67⫻
10⫺7molecules⫺1m2s⫺1. We takek
on⫽5⫻10⫺3m2s⫺1for both
receptor-ligand pairs, andkoff⫽0.1 s⫺1corresponding to a typical agonist;
this gives a 2D affinity of 20 molecules perm2, similar to that measured
directly for CD2. To model CD2-CD48 the off-rate should be increased to 8 s⫺1 (Pierres et al., 1996); however, the dynamics are only weakly
dependent on these exact values (not shown).
Cytoskeleton
Attachment kineticsC º Ca,T ºTa, are at present uncharacterized.
However, it is reasonable that these are low/medium-affinity fast reactions, and thus only the affinity constant will be important and not separate on/off rates. We usepon⫽0.1s⫺1, andpoff⫽0.1 s⫺1, giving an unbound/bound
ratio of 1:1. This ratio may be estimatable from the mobility fraction in FRAP measurements.
Cytoskeleton velocity is modeled as a sine wave(x)⫽0sin(r/2r0)
with兩0兩⫽0.04m/s directed toward the center of the interface (polar
coordinater). Beyondr0⫽2.5m the velocity is constant and directed
toward the center. The speed corresponds to that of a bead moving from apex to the contact area (a distance of⬃5–10m) over 10 min (Wu¨lfing and Davis, 1998). Attachment to the cytoskeleton in Fig. 9 is switched on
at 60 s. Similar results were obtained with attachment from the start of the simulation.
Membrane parameters
Membrane parameters are typical of resting cells: membrane tension 24⫻ 10⫺6
N m⫺1
(Needham and Hochmuth, 1992) and rigidity 5⫻10⫺20
N m (Raucher et al., 2000). Rigidity increases with wavelength, range 2–70⫻ 10⫺20
N m (Strey et al., 1995), our value corresponds to a short wavelength value (0.25–1 m). These values are significantly lower than for lipid vesicles, while the tension is higher, rigidity is lower than forDictyostelium discoideumas used in Qi et al., 2001.
The damping parameteris 2⫻1010
kg m⫺2
s⫺1
. This value gives segregation within seconds, as observed experimentally.
The glycocalyx potential (Lauffenburger and Linderman, 1993) in sim-ulations is 5⫻10⫺4
Nm⫺3
, significantly weaker than receptor-ligand bonds, with a mean depthz0⫽27.5 nm, intermediate between the two
bond lengths. Potentials over the range 10⫺2
– 10⫺6
N m⫺3
were explored.
Simulation
Simulations in 1D were performed with 400 lattice points, in 2D on a 300 ⫻ 300 lattice. Accuracy was monitored by conservation of total receptor and ligand counts and an independence of lattice spacing. Con-tinuation analysis was performed with AUTO.
N.J.B. is grateful for discussions with Clemens Utzny, Mathew Turner, Mike Allen, Andrew Stuart, Daniel Davis, and Anton van der Merwe. C.W. acknowledges Mark Davis. We acknowledge the anonymous referees for their valuable comments.
REFERENCES
Alon, R., S. Chen, K. D. Puri, E. B. Finger, and T. A. Springer. 1997. The kinetics of L-selectin tethers and the mechanics of selectin-mediated rolling.J. Cell Biol.138:1169 –1180.
Bell, G. I. 1978. Models of specific adhesion of cells to cells.Science.
200:618 – 627.
Bell, G. I., M. Dembo, and P. Bongrand, 1984. Cell adhesion. Competition between nonspecific repulsion and specific bonding.Biophys. J.45: 1051–1064.
Bromley, S. K., W. R. Burack, K. G. Johnson, K. Somersalo, T. N. Sims, C. Sumen, M. M. Davis, A. S. Shaw, P. M. Allen, and M. L. Dustin. 2001. The immunological synapse.Annu. Rev. Immunol.19:375–396. Brown, D. A., and E. London. 1998. Functions of lipid rafts in biological
membranes.Annu. Rev. Cell Dev. Biol.14:111–136.
Carlin, L. M., K. Eleme, F. E. McCann, and D. M. Davis. 2001. Intercel-lular transfer and supramolecular organization of human leukocyte an-tigen C at the inhibitory natural killer cell synapse. JEM. 194: 1507–1517.
Dai, J. W., and M. P. Sheetz. 1999. Membrane tether formation from blebbing cells.Biophys. J.77:3363–3370.
Davis, S. J., and P. A. van der Merwe. 1996. The structure and ligand interactions of CD2: implications for T-cell function.Immunol. Today.
17:177–187.
Dembo, M., D. C. Torney, K. Saxman, and D. Hammer. 1988. The reaction-limited kinetics of membrane-to-surface adhesion and detach-ment.Proc. R. Soc. Lond. B.234:55– 83.
Dustin, M. L. and J. A. Cooper. 2000. The immunological synapse and the actin cytoskeleton: molecular hardware for T cell signaling.Nat. Immu-nol.1:23–29.
Dustin, M. L., L. M. Ferguson, P.-Y. Chan, T. A. Springer, and D. E. Golan. 1996. Visualization of CD2 interaction with LFA-3 and deter-mination of the two-dimensional dissociation constant for adhesion receptors in a contact area.J. Cell Biol.132:465– 474.
Dustin, M. L., M. W. Olszowy, A. D. Holdorf, J. Li, S. Bromley, N. Desai, P. Widder, F. Rosenberger, A. P. van der Merwe, P. M. Allen, and A. S. Shaw. 1998. A novel adaptor protein orchestrates receptor patterning and cytoskeletal polarity in T-cell contacts.Cell.94:667– 677. Evans, E. A. 1985. Detailed mechanics of membrane-membrane adhesion
and separation. I. Continuum of molecular cross-bridges.Biophys. J.
48:175–183.
Favier, B., N. J. Burroughs, L. Wedderburn, and S. Valitutti, 2001. T cell antigen receptor dynamics on the surface of living cells.Int. Immunol.
13:1525–1532.
Forscher, P., C. H. Lin, and C. Thompson. 1992. Novel form of growth cone motility involving site directed actin filament assembly.Nature.
357:515–518.
Fritz, J., A. G. Katopodis, F. Kolbinger, and D. Anselmetti. 1998. Force-mediated kinetics of single P-selectin/ligand complexes observed by atomic force microscopy.PNAS.95:12283–12288.
Grakoui, A., S. K. Bromley, C. Sumen, M. M. Davis, A. S. Shaw, P. M. Allen, and M. L. Dustin. 1999. The immunological synapse: a molecular machine controlling T cell activation.Science.285:221–227. Hahn, W. C., Y. Rosenstein, V. Calvo, S. J. Burakoff, and B. E. Bierer.
1992. A distinct cytoplasmic domain of CD2 regulates ligand avidity and T-cell responsiveness to antigen,PNAS.89:7179 –7183.
Janes, P. W., S. C. Ley, and A. I. Magee. 1999. Aggregation of lipid rafts accompanies signaling via the T cell antigen receptor. J. Cell Biol.
147:447– 461.
Janeway, C. A. and P. Travers 1997.Immunobiology.Current Biology Ltd. Johnson, K. G., S. Bromley, M. L. Dustin, and M. L. Thomas. 2000. A supramolecular basis for CD45 tyrosine phosphatase regulation in sus-tained T cell activation.PNAS.97:10138 –10143.
Johnson, K. L. 1985.Contact Mechanics.Cambridge University Press. Krummel, M., M. D. Sjaastad, C. Wu¨lfing, and M. M. Davis. 2000.
Differential clustering of CD4 and CD3 during T cell recognition.
Science.289:1349 –1352.
Lauffenburger, D. A. and J. J. Linderman. 1993.Receptors. Models for Binding, Trafficking, and Signaling.Oxford University Press Le Grimellec, C., E. Lesniewska, M. Giocondi, E. Finot, V. Vie´, and J.
Goudonnet. 1998. Imaging of the surface of living cells by low-force contact mode atomic force microscopy.Biophys. J.75:695–703. Leupin, O., R. Zaru, T. Laroche, S. Mu¨ller, and S. Valitutti. 2000.
Exclu-sion of CD45 from the T-cell receptor signaling area in antigen-stimulated lymphocytes.Curr. Biol.10:277–280.
Lollo, B. A., K. W. H. Chan, E. M. Hanson, V. T. Moy, and A. A. Brian. 1993. Direct evidence for two affinity states for lymphocyte function-associated antigen 1 on activated T cells. J. Biol. Chem. 268: 21693–21700.
Lyons, D. S., S. A. Lieberman, J. Hampl, J. Boniface, Y. Chien, L. J. Berg, and M. M. Davis. 1996. A TCR binds to antagonist ligands with lower affinities and faster dissociation rates than to agonists. Immunity.
5:53– 61.
McNeill, H. 2000. Sticking together and sorting things out: adhesion as a force in development.Nat. Rev. Genet.1:100 –108.
Monks, C. R., B. A. Freiberg, H. Kupfer, N. Sciaky, and A. Kupfer. 1998. Three-dimensional segregation of supramolecular activation clusters in T cells.Nature.395:82– 86.
Moy, V. T., E.-L. Florin, and H. E. Gaub. 1994. Intermolecular forces and energies between ligands and receptors.Science.266:257–259. Needham, D., and R. M. Hochmuth. 1992. A sensitive measure of surface
stress in the resting neutrophil.Biophys. J.61:1664 –1670.
Orsello, C. E., D. A. Lauffenburger, and D. A. Hammer. 2001. Molecular properties in cell adhesion: a physical and engineering perspective.
Trends Biotech.19:310 –316.
Pathria, R. K. 1996.Statistical Mechanics,Butterworth-Heinemann, Ox-ford, U.K.
Pierres, A., A. M. Benoliel, P. Bongrand, and P. A. van der Merwe. 1996. Determination of the lifetime and force dependence of interactions of single bonds between surface-attached CD2 and CD48 adhesion mole-cules.PNAS.93:15114 –15118.
Qi, S. Y., J. T. Groves, and A. K. Chakraborty. 2001. Synaptic pattern formation during cellular recognition.PNAS.98:6548 – 6554. Raucher, D., and M. P. Sheetz. 1999. Membrane expansion increases
endocytosis rate during mitosis.J. Cell Biol.144:497–506.
Raucher, D., T. Stauffer, W. Chen, K. Shen, S. Guo, J. D. York, M. P. Sheetz, and T. Meyer. 2000. Phosphatidylinositol 4,5-biphosphate func-tions as a second messenger that regulates cytoskeleton-plasma mem-brane adhesion.Cell.100:221–228.
Rotsch, C., F. Braet, E. Wisse, and M. Radmacher. 1997. AFM imaging and elasticity measurements on living rat liver macrophages.Cell Biol. Internat.21:685– 696.
Rudd, P. M., T. Elliot, P. Cresswell, I. A. Wilson, and R. A. Dwek. 2001. Glycosylation and the immune system.Science.291:2370 –2376. Ryan, T. A., J. Myers, D. Holowka, B. Baird, and W. W. Webb. 1988.
Molecular crowding on the cell surface.Science239:61– 64.
Schreiner, G. F., and E. R. Unanue, 1977. Capping and the lymphocyte: models for membrane reorganization.J. Immunol.119:1549 –1551. Shao, J.-Y., H. P. Ting-Beall, and R. H. Hochmuth. 1998. Static and
dynamic lengths of neutrophil microvilli.PNAS.95:6797– 6802. Simons, K., and E. Ikonen. 1997. Functional rafts in cell membranes.
Nature.387:569 –572.
Strey, H., M. Peterson, and E. Sackmann. 1995. Measurement of erythro-cyte membrane elasticity by flicker eigenmode decomposition.Biophys. J.69:478 – 488.
Taylor, R. B., W. P. H. Duffus, M. C. Raff, and S. de Petris. 1971. Redistribution and pinocytosis of lymphocyte surface immunoglobulin molecules induced by anti-immunoglobulin antibody. Nature. 233: 225–227.
van der Merwe, A. P., S. J. Davis, A. S. Shaw, and M. L. Dustin. 2000. Cytoskeletal polarization and redistribution of cell-surface molecules during T cell antigen recognition.Seminars in Immunology12:5–21. Viola, A., and A. Lanzavecchia. 1999. T-cell activation and the dynamic
world of rafts.APMIS.107:615– 623.
Wild, M. K., A. Cambiaggi, M. H. Brown, E. A. Davies, H. Ohno, T. Saito, and A. P. van der Merwe. 1999. Dependence of T cell antigen recog-nition on the dimensions of an accessory receptor-ligand complex.J. Exp. Med.190:31– 41.
Wu¨lfing, C., and M. M. Davis. 1998. A receptor/cytoskeletal movement triggered by costimulation during T cell activation. Science. 282: 2266 –2269.
Wu¨lfing, C., M. D. Sjaastad, and M. M. Davis. 1998. Visualizing the dynamics of T cell activation: intracellular adhesion molecule 1 migrates rapidly to the T cell/B cell interface and acts to sustain calcium levels.
PNAS.95:6302– 6307.