ORIGINAL RESEARCH
Low Choline Concentrations in Normal-Appearing
White Matter of Patients with Multiple Sclerosis
and Normal MR Imaging Brain Scans
M.C. Gustafsson O. Dahlqvist J. Jaworski P. Lundberg A.-M.E. Landtblom
BACKGROUND AND PURPOSE: Spectroscopic studies (1H-MR spectroscopy) of normal-appearing white matter (NAWM) in patients with multiple sclerosis (MS) with MR imaging brain lesions have already been performed, but our intention was to investigate NAWM in MS patients who lack brain lesions to elucidate whether the same pathologic changes could be identified.
MATERIALS AND METHODS: We checked 350 medical files of patients with MS who are registered in our institution. Fourteen patients (11 women and 3 men; mean age, 48.6 years; handicap score, Expanded Disability Status Scale [EDSS] 2.9; range, 1– 6.5) with clinically definite MS and a normal MR imaging of the brain were included.1H-MR spectroscopy was performed in 4 voxels (size approxi-mately 17⫻ 17 ⫻17 mm3) using absolute quantification of metabolite concentrations. Fourteen healthy control subjects (11 women and 3 men; mean age, 43.3 years) were analyzed in the same way.
RESULTS: Significant differences in absolute metabolite concentrations were observed, with the patients with MS showing a lower total concentration ofN-acetyl compounds (tNA), includingN -acetylaspartate andN-acetyl aspartylglutamate (13.5 mmol/L versus 14.6 mmol/L;P⫽.002) compared with the healthy control subjects. Unexpectedly, patients with MS presented significantly lower choline-containing compounds (Cho) compared with healthy control subjects (2.2 mmol/L versus 2.4 mmol/L;P ⬍ .001). The EDSS showed a positive correlation to myo-inositol concentrations (0.14 mmol/L per EDSS; r2⫽0.06) and a negative correlation to tNA concentrations (⫺0.41 mmol/L per EDSS; r2⫽0.22).
CONCLUSION:The unexpected finding of lower Cho concentrations has not been reported previously. We suggest that patients with MS who lack lesions in the brain constitute a separate entity and may have increased protective or healing abilities.
M
ultiple sclerosis (MS) is an inflammatory disease of the central nervous system causing demyelination, gliosis, and loss of neurons, mainly involving white matter.1,2For di-agnosing MS, MR imaging is widely used; lesions appear as hypo-, iso-, or hyperintense “spots” on the MR imaging scans. The McDonald criteria3specify the application of MR imaging lesions in MS diagnosis.By using proton MR spectroscopy (1H-MR spectroscopy), it has become possible to analyze several brain metabolites in vivo.4,5There are 3 different metabolic patterns, and they are attributed to acute lesions, chronic lesions, and normal-ap-pearing white matter (NAWM), respectively.5
The pathologic process in MS typically shows lowN -acetyl-aspartate (NAA) concentrations, increased myo-inositol (mIns), and choline (Cho)-containing compounds.4,6It has been suggested that the increase in Cho concentration is mainly associated with inflammation, not demyelination it-self, and the reduction in NAA may reflect dysfunction rather than actual loss of neurons.7In addition, lactate (Lac) is an
indicator of acute inflammation, the first step in the evolution of a lesion focus.8
Furthermore, in vivo1H-MR spectroscopy studies have shown that mIns and Cho increase can be consequences of glial proliferation, being nonspecific reactions to brain dam-age.9Conversely, normalization of Cho concentration may be the result of remyelination.10
1
H-MR spectroscopy studies of NAWM have also revealed pathologic processes that remain below the threshold for MR imaging detection.10,11Prelesional choline increase (expressed as Cho/creatine [Cho/Cr] spectral ratio) has been described recently, indicating prelesion pathology in NAWM.12 Accord-ingly, T2 relaxation studies have revealed evidence of a patho-logic process with heterogeneous, diffusely prolonged T2 in NAWM of patients with MS.13
Cr has often been regarded as a rather stable metabolite in MS and has subsequently been used as a reference metabolite. However, such a procedure is not always justified because of complex pathologic changes in the tissue.14A recent study has also reported diffusely elevated cerebral Cho and Cr in NAWM in relapsing-remitting (RR) MS.15The motivation for using absolute concentrations was that a change of the ratio of 2 metabolites does not reveal which one of the 2 has changed, and during intersubject analysis, absolute quantification en-ables comparison of a single metabolite.
In conclusion, several studies on NAWM in patients with clinically definite MS have reported increases in Cho, Cr, and mIns absolute concentrations and decreases in NAA andN -acetyl aspartylglutamate (NAAG).6,10,15It is important to note that these reports focus on NAWM in patients with developed Received March 18, 2005; accepted after revision January 9, 2007.
Division of Neurology (M.C.G., J.J., A.-M.E.L.), Department of Radiation Physics (O.D., P.L.), Department of Radiology (P.L.), and Center for Medical Imaging and Visualization (O.D., P.L.), University Hospital, Linko¨ping, Sweden.
Drs Gustafsson and Dahlqvist contributed equally to this work.
This study was financially supported by the University Hospital in Linko¨ping, including University Hospital Research Funds.
lesions in other regions of cerebral white matter. In contrast, our intention was to investigate patients with MS who lack lesions on MR imaging of the brain to elucidate whether 1H-MR spectroscopy elicits abnormal absolute cerebral
me-tabolite concentrations. Our hypothesis was that these pa-tients show the same pathologic changes as observed in NAWM in patients with MR imaging lesions, that is, a de-crease in NAA and an inde-crease in Cho and mIns.
Materials and Methods
Subjects
Between 1998 and 2001, the medical files of 350 patients with MS registered at the neurologic clinic of our institution were checked, and 18 patients with normal MR imaging brain scan reported in the files were identified. The MR imaging scans were evaluated by a neurora-diologist for the presence of MS lesions, because the intention of the study was to include only patients with a normal MR imaging scan of the brain.16Four of these patients had developed brain lesions in the follow-up and were therefore excluded.
Fourteen (4%) of 350 patients who were initially checked were recruited for1H-MR spectroscopy. All of these patients fulfilled the Poser criteria for clinically definite MS (CDMS), which implicates at least 2 relapses, separated in space and time.17There were 11 women and 3 men (mean age, 48.6 years; range, 21– 62 years). Nine patients had RR MS, and 5 had the secondary-progressive (SP) form.
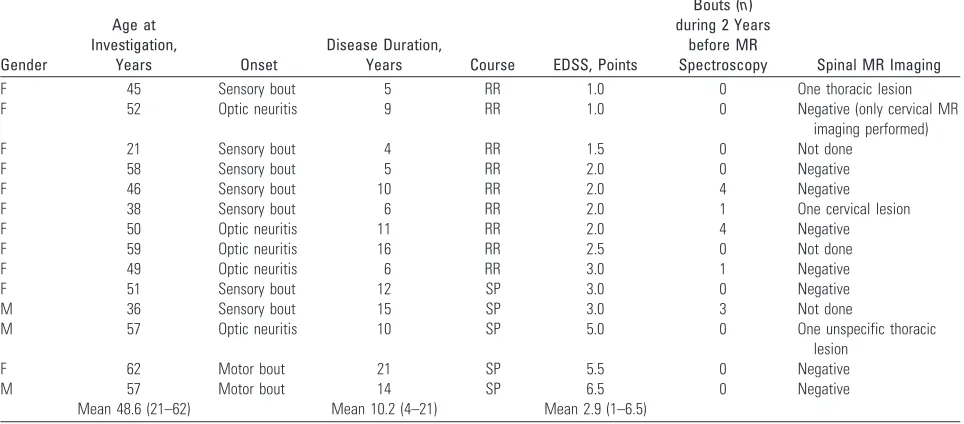
Mean disease duration was 10.3 years (range, 4 –26 years) and was longer in SP (mean, 14.4 years) than in RR (mean, 8.0 years). Neither immunomodulatory nor immunosuppressive treatment was used in 10 patients before the study; 3 patients were continuing interferon therapy during the study; 1 female patient was treated with intrave-nous immunoglobulins. None of the patients used steroids or had a relapse 1 month before the study. Disability ascertainment was based on the Expanded Disability Status Scale (EDSS)18(Table 1). Mean EDSS was 2.9 (range, 1– 6.5).
The medical files were checked regarding differential diagnostics excluding other conditions that may mimic MS, such as neuroborre-liosis, vitamin B12deficiency, arteriovenous malformations, mass
ef-fects, systemic lupus erythematosus, Behc¸et disease, sarcoidosis, and neurosyphilis. All of the patients had been confirmed positive for oligoclonal bands in the CSF before inclusion in the study.
Nine patients had negative MR images of the spinal cord (1 of these patients only had the cervical part of the spinal cord examined; another had 1 unspecific thoracic lesion, interpreted as probably not demyelinating; and a third patient had normal MR imaging of the spinal cord a couple of years before MS diagnosis), 2 patients had 1 demyelinating lesion, and 3 patients were not investigated (Table 1). The relapse rate of the patients during the 2 years before the study entry was rather low: only 5 patients had had bouts (Table 1).
Fourteen healthy subjects, 11 women and 3 men, were used as control subjects. The healthy volunteers were recruited from the med-ical staff or were medmed-ical students in our institution (mean age, 43.3 years; range, 34 –52 years).
The study was approved by the local ethics committee. All of the patients and control subjects gave their informed consent before inclusion.
MR Measurements
MR imaging and the1H-MR spectroscopy examinations were per-formed on a Signa Horizon EchoSpeed Plus 1.5T MR scanner (GE Healthcare, Milwaukee, Wis) using a standard quadrature head coil. Axial scans for evaluating the presence of lesions (⬃40 sections, de-pending on head size), were obtained using a double-echo fast spin-echo, with 5-mm section thickness. This gave both proton density (TR, 2300 ms; TE, 14 ms), and T2-weighted images (TR, 2300 ms; TE, 98 ms). The matrix and FOV were 256⫻192 and 24⫻18 cm2, respectively.
Coronal T1-weighted scans for placement of spectral voxels were acquired using a 3D fast-spoiled gradient recalled acquisition in steady-state sequence (TR, 14.1 ms; TE, 5.4 ms; FOV, 35 cm with 4-mm section thickness) using a flip angle of 20°.
[image:2.585.53.535.62.274.2]Point-resolved single voxel spectroscopy (PRESS) was used to ob-tain1H-MR spectroscopy spectra at 63.87 MHz using TR at 6 seconds, TE at 35 ms, and voxel dimension at approximately 17⫻17⫻17 mm3(⫽4.91 mL), with a shape adjusted to the specific white matter
Table 1: Clinical findings in patients with multiple sclerosis and normal MR imaging scan of the brain
Gender
Age at Investigation,
Years Onset
Disease Duration,
Years Course EDSS, Points
Bouts (n) during 2 Years
before MR
Spectroscopy Spinal MR Imaging
F 45 Sensory bout 5 RR 1.0 0 One thoracic lesion
F 52 Optic neuritis 9 RR 1.0 0 Negative (only cervical MR
imaging performed)
F 21 Sensory bout 4 RR 1.5 0 Not done
F 58 Sensory bout 5 RR 2.0 0 Negative
F 46 Sensory bout 10 RR 2.0 4 Negative
F 38 Sensory bout 6 RR 2.0 1 One cervical lesion
F 50 Optic neuritis 11 RR 2.0 4 Negative
F 59 Optic neuritis 16 RR 2.5 0 Not done
F 49 Optic neuritis 6 RR 3.0 1 Negative
F 51 Sensory bout 12 SP 3.0 0 Negative
M 36 Sensory bout 15 SP 3.0 3 Not done
M 57 Optic neuritis 10 SP 5.0 0 One unspecific thoracic
lesion
F 62 Motor bout 21 SP 5.5 0 Negative
M 57 Motor bout 14 SP 6.5 0 Negative
Mean 48.6 (21–62) Mean 10.2 (4–21) Mean 2.9 (1–6.5)
Note:—Mean values are shown as a geometric mean. F indicates female; M, male; EDSS, Expanded Disability Status Scale; RR, relapsing-remitting; SP, secondary-progressive.
BRAIN
ORIGINAL
anatomy and 64 transients. The PRESS version used was Probe-p (Proton brain examination-PRESS; GE Medical Systems, Waukesha, Wis), in which 167° pulses are used for the inversion pulses to achieve optimal bandwidth, section profile, and power usage. Water sup-pression was obtained using chemical shift selective imaging using stimulated echoes). Four voxels of interest (VOIs), 2 frontal (left/ right) and 2 parietal (left/right), in NAWM were identified for the MR spectroscopy examination (Figs 1 and 2). Gray matter was avoided as much as possible.
Absolute Quantification
The quantification of metabolite concentrations was performed using modified procedures based on the work of Helms and colleagues,10,19 and the main modification was that PRESS localization technique was used instead of stimulated echo acquisition mode, providing a 2-fold gain in signal intensity-to-noise ratio. The most important part of the method was that the local sensitivity of the radio-frequency (RF) coil used (for both transmission and reception of RF signal intensity) was measured in each voxel. The reciprocity principle states a propor-tional relation between the sensitivity during transmission and recep-tion in the nuclear magnetic resonance experiment, and based on the local sensitivity measurement, a correction factor used for scaling of the received signal intensity is obtained. Likewise, Linear Combina-tion of Model spectra (LCModel; version 6.0 –1, S Provencher,
Can-ada) was used to fit spectra to metabolite line shapes, in addition to correcting for a common protein baseline.
Outline of the Procedures.The following main steps were used in
the procedures for subject measurements: 1) acquisition of water-suppressed spectra using a short TE and a long TR; 2) acquisition of unsuppressed water spectra as a function of RF pulse amplitude (or “transmit gain,” using the manufacturer’s terminology)19; 3) acqui-sition of unsuppressed water spectra as a function of TE19; 4) LC-Model analysis of the spectra using eddy-current artifact correction20 and a manufacturer-provided metabolite library, as well as reso-nances corresponding to lipid signals; 5) correction of the flip angle deviations from the desired in the PRESS sequence; 6) correction of the CSF partial volumes in the spectroscopy voxels (using the water amplitude versus TE measurements); 7) correction of the concentra-tions for tissue water content21; 8) correction for unequal Boltzmann equilibrium magnetization because of differences in temperature be-tween the calibration phantom and the subjects; and 9) correction for differential relaxation between in vitro references and in vivo measurements.
Additional Procedures.Data correcting for partial volumes and
the reciprocity effects19were collected for a single parietal voxel in each subject. The water spectra were collected using different transmit gains (RF pulse amplitude) and TE. The LCModel output concentra-tion values were calibrated periodically during the study to compen-sate for time variability in scanner parameters using an approximately 50.000 mmol/L of Cr solution in physiologic buffer (“Cr calibration phantom”). Data were recalculated to reflect the tissue concentra-tions based on the water content in average white matter (71%21).
Correction for Flip Angle Errors.The deviation between actual
RF pulse amplitude (Ractual), (obtained from the scanner auto pres-can), and ideal RF pulse amplitude (Rideal) was determined using the following PRESS-specific signal intensity expression (assuming 180° inversion pulses19):
1) f共␣,TR,T1兲 ⫽ sin5␣
冤
冉
1⫺e⫺TR T1
冊
冉
1⫺e⫺TR T1cos5␣
冊
冥
where the actual flip angle (␣), was obtained fromRactualandRidealin equation 2.
2) ␣ ⫽
2䡠 Ractual
Rideal
The RF pulse amplitude curves acquired in the subjects were fitted to equation 1 to obtainRideal.19The flip angle dependence (sin5␣and cos5␣), however, was slightly modified to account for the actual 167° “inversion pulses” used in the manufacturer-provided pulse sequence (see above).
Relaxation Values.T1 and T2 values were obtained from the
lit-erature.22,23Specifically, the following values were used: T1 in vivo(in ms) Cho 1150, Cr 1550, mIns 900, NAA 1450; T2in vivo(in ms) Cho 330, Cr 240, mIns 110, NAA 450; and T2in vitro(in ms) Cho 810, Cr 765, mIns 284, NAA 945. The T1 value of the main Cr resonance in the Cr calibration phantom was determined (using an inversion recovery experiment) to be 1652 ms at 295 K.
Metabolite Concentrations.Using these T1 values and the
mod-ified equation 1, the metabolite concentration (Cmetabolite) could then be evaluated as:
Fig 1.Aand B, Coronal brain images (radiologic orientation) showing the standard locations of the 4 actual spectroscopy voxels in a healthy volunteer.
C, The spectrum of voxel 1 (parietal right). Assignments:1, Cr-CH2-;2, Glu␣/Gln␣;3, Gln
[image:3.585.54.286.41.370.2]3) Cmetabolite⫽Smetabolite CCr SCr
Rideal,in vivo Rideal,Cr
f共Cr兲 f共in vivo兲
whereSmetaboliteis the signal intensity from a metabolite,CCris the concentration of the Cr calibration phantom,SCris the signal inten-sity from the Cr calibration phantom, andRidealis the RF pulse am-plitude, which gives it the peak amplitude of the water resonance. The f(Cr) andf(in vivo) refer to equation 1 and the Cr calibration phantom and in vivo voxel, respectively.
Additional Corrections for Partial CSF Volume, Differential
Temperature, and T2.The CSF fraction of the voxel volume was
estimated using bi-exponential decay analysis of the water spectra acquired as function of TE; in this analysis 40% of water signal inten-sity was assumed invisible in the conditions used for these experi-ments.19Correction for differences in thermal equilibrium magneti-zation dependent on the temperature of the body and the Cr calibration phantom was performed using the following expression: (1/T298)/(1/T310). Finally, differential T2 correction takes into ac-count differences in T2 between in vitro and in vivo measurements as follows:
4) ⫽e
冋
TE冉
T2,in vivo1 ⫺T2,in vitro1冊册
Quantification Aspects
On System Performance.The correlation plot between the
es-timated maximum in vivo water signal intensity (SH2O,in vivo) and Rideal,in vivofor Signa LX (5.8) data showed a strong linear correla-tion between signal intensity and estimated ideal RF pulse
ampli-tude (Rideal,in vivo); r⫽0.97 (data not shown). This showed that the receiver parameters of the MR scanner are stable as long as the hard-ware is not modified.
Error Analysis.It is important to evaluate the
influence of various types of errors in a study based on absolute quantification.19The absolute quantification was performed in several separate steps, and the contribution of each of these to the accuracy and precision was subject to an evalua-tion, which is briefly described here. Here the data for control subjects were used for such an evaluation (Table 2).
Correction Influence.The correction for the
reciprocity effect was the most significant cor-rection (50% variation between different sub-jects). It is interesting to note that the other cor-rections (Table 2) did not alter the (population-wide) precision as expressed by the coefficient of variation (shown for 1 row of data only), which was approximately 10%. The other corrections did not alter the accuracy of the data by more than 5%–10%. The most important (other than reciprocity) correction was the differential T2 correction (approximately⫹8%), followed by the flip angle correction (approximately⫺7%). The latter arose from systematic scanner behavior.
Differential Correction Weights.It is of interest to note that
some of the corrections affect all of the measurements the same way, and their main effect is to achieve more accurate values in terms of biochemical function. Other corrections, notably the reciprocity cor-rection, are very important for intersubject comparisons (such as pa-tients versus control subjects).
Statistical Evaluation
Two statistical approaches were used. First, the subjects were analyzed for intrasubject variability for each metabolite between the 4 individ-ual VOIs in the patient and in the control group separately by using analysis of variance (1-way ANOVA). Post hoc, Fisher pairwise com-parisons test was performed continuously to show which voxels dif-fered. The Studentttest was then adopted to compare metabolite concentrations in respective voxels between the patient group and the control group. In these calculations, we compared sets of data that included 14 measurements, consistent with the number of subjects in the patient group and the control group.
Second, the single voxel measurements were used as a basis for analysis, according to the assumption that pathologic changes of all of the VOIs in each subject are correlated, irrespective of brain region. Thus, 56 measurements (14 patients⫻4 voxels) were compared for each metabolite. Two-way ANOVA was adopted to calculate inter-subject differences in metabolite concentrations between the patients and the control subjects. We also performed the Studentttest to compare intersubject general concentrations of respective metabo-lites in 4 VOIs altogether.
Fig 2.A,B, andC, Spectra of WM voxels from 3 different control subjects.
[image:4.585.62.505.38.436.2]Statistical correlations were performed using the Spearman test. The normal distribution and equality of variances (Levene test) for each group of measurements was always ensured before ANOVA analysis.P⬍.05 was considered statistically significant.
Results
Metabolite Concentrations
Patients versus Control Subjects.The absolute aqueous concentrations of metabolites in NAWM are shown in Table 3. Note that these concentrations reflect the conditions in the aqueous phase, after all of the above-mentioned corrections. The most interesting and unexpected finding was that the ab-solute concentration of Cho was significantly (P⬍.001) lower in NAWM of patients with MS than in control subjects. In addition, patients showed lower NAA (P ⫽ .003) and NAA⫹NAAG (tNA) concentrations (P⫽ .002), as well as slightly lower Cr (P⫽.03). In contrast, no significant differ-ences in mIns or glutamine/glutamate concentrations be-tween patients and control subjects were detected.
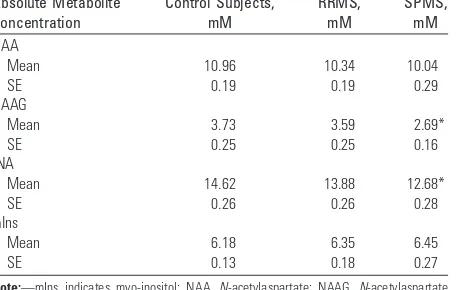
RRMS versus SPMS.The concentrations of NAA/NAAG were highest in control subjects, lower in RRMS, and lowest in SPMS, a statistically significant difference, obviously progress-ing as the disease deteriorates. The correspondprogress-ing concentra-tions of mIns showed a slight increase. This is expressed in Table 4 in mmol/L (SD), aqueous solution.
Concentrations versus EDSS. The correlation between disability (EDSS) and respective metabolite concentrations in the patient group was also analyzed. There was a weak positive correlation between EDSS and mIns concentration (0.14 mmol/L per EDSS; r2⫽0.06), whereas a negative correlation was found for tNA (⫺0.41 mmol/L per EDSS; r2⫽0.22).
Concentrations versus Age. Metabolite concentrations versus age were also investigated. In the patient group, we found a weak negative correlation between tNA and age (⫺0.04 mmol/L per year; r2⫽0.08), as well as a weak positive correlation for mIns concentration (0.02 mmol/L per year; r2
⫽0.04). In the healthy control group, a slight positive corre-lation between Cho and age was observed (0.03 mmol/L per year; r2⫽0.23).
Spatial Concentration Differences.No significant differ-ence in Cho, Cr, mIns, and NAA concentrations was found between the 4 voxels in healthy subjects. The tNA concentra-tion was higher in parietal regions compared with frontal vox-els on both sides, which may be because of anatomic differ-ences. NAAG and tNA have been shown to be higher in
regions with high neuron density, such as the occipital area, compared with lower neuronal density areas, such as the fron-tal regions.24,25In the MS group, there were no statistically significant differences in Cho, Cr, mIns, and tNA concentra-tions between voxels (right/left/frontal/parietal). We, thus, report an unexpectedly low absolute Cho concentration in NAWM of patients with MS and a negative MR imaging brain scan.
Discussion
[image:5.585.301.532.77.263.2]Our results supported the hypothesis that altered metabolism in NAWM can be detected in patients with MS without brain lesions. NAWM is a term used to express the inability to reveal pathologic changes on the MR imaging brain scan. It has been suggested that it may not be normal, but just a reflection of the restrictions imposed by the measurement device. At higher field strength (⬎1.5T), it is possible that minute lesions might have been observed. Nevertheless it is quite rare for patients
Table 2: Influence of absolute concentration corrections other than for reciprocity deviations on the relative absolute concentrations of 4 major metabolites averaged in healthy control subjects (nⴝ14)
Variable Cho, % Cr, % NAA, % NAA⫹NAAG, %
With reciprocity 100.0 100.0 100.0 100.0
Coefficient of variance 13.5 9.3 11.6 12.3
Flip angle correction 93.2 94.7 94.2 93.7
⫹CSF 97.7 99.2 98.7 98.2
⫹Differential T2 104.0 109.7 102.8 102.3
⫹Boltzmann 108.2 114.1 107.0 106.4
Note:—The top row 100% represents the concentrations without any correction other than the reciprocity correction. Subsequent rows show the accumulated effect of additional quantification step on the concentration values. Fully corrected relative values are shown in the last row. Cho indicates choline; Cr, creatine; NAA,N-acetylaspartate; NAAG,
[image:5.585.53.286.78.154.2]N-acetyl aspartylglutamate.
Table 3: Differences in absolute metabolite concentrations (and SE, in mM in aqueous fraction) in NAWM between patients with MS (and normal MRI scan of the brain) and control subjects
Absolute Metabolite Concentration
Patients, mM
Control Subjects,
mM
P (Mann-Whitney)
P (2-way ANOVA) Cho
Mean 2.16 2.38 ⬍.001 ⬍.001
SE 0.04 0.05
Cr
Mean 7.03 7.35 .029 .013
SE 0.07 0.10
m-Ins
Mean 6.38 6.18 n.s. n.s.
SE 0.15 0.13
NAA
Mean 10.26 10.96 .003 .004
SE 0.16 0.19
tNA
Mean 13.54 14.62 .002 ⬍.001
SE 0.21 0.26
[image:5.585.301.533.333.478.2]Note:—Cho indicates choline; Cr, creatine; m-Ins, myo-inositol; NAA,N-acetylaspartate; tNA, totalN-acetyl compounds including NAA and NAAG; n.s., not significant; MS, multiple sclerosis; NAWM, normal-appearing white matter.
Table 4: Absolute metabolite concentrations (and SE, in mM in aqueous fraction) in NAWM between patients with MS (and normal MRI scan of the brain) and control subjects
Absolute Metabolite Concentration
Control Subjects, mM
RRMS, mM
SPMS, mM NAA
Mean 10.96 10.34 10.04
SE 0.19 0.19 0.29
NAAG
Mean 3.73 3.59 2.69*
SE 0.25 0.25 0.16
tNA
Mean 14.62 13.88 12.68*
SE 0.26 0.26 0.28
mIns
Mean 6.18 6.35 6.45
SE 0.13 0.18 0.27
with MS to have a negative MR imaging brain scan. Approxi-mately 5% of patients with MS, assigned previously to a group of CDMS according to the Poser criteria, do not exhibit patho-logic changes on MR imaging of the brain. In this study we found that 4% of our patients with MS had normal MR imag-ing scans. In a study of patients with suspected MS and nega-tive brain MR imaging, all (n⫽20) had lesions in the spinal cord.26The authors proposed that a combination of brain and spinal MR imaging can reach almost 100% sensitivity. Of course, this raises the question of whether MS diagnosis is plausible in case subjects with a negative brain and spinal MR imaging. In our patient population, many fewer subjects (14%) had spinal lesions (although not all of the patients were investigated; Table 1). From our point of view, the large frac-tion of negative spinal MR imaging in our patients (64%) sug-gests that there is indeed a subtype of MS with minimal demy-elination. However, some of the spinal MR imaging examinations of our patients were not recent.
Our main finding of a low absolute concentration of Cho in the NAWM of patients with MR imaging-negative MS was unexpected but interesting. It could indicate a lack of inflam-mation, but we believe that it may also be possible because of increased uptake of Cho from the free phase for the building of cell membranes (only mobile choline-containing compounds are observed under the conditions of the present experi-ments). If this is true, it might reflect the onset of a healing process in these patients with MS. The only report with similar findings was from Richards et al27 dealing with a model of experimental acute encephalomyelitis in primates. They de-scribed a decline in Cho concentration in animals with no lesions in voxels seen on1H-MR spectroscopy examination, though the animals developed lesions in other regions of the central nervous system. The cause for this finding still remains unknown. Sarchielli et al28detected no significant difference in apparent Cho concentrations between patients with MS and control subjects when investigating NAWM in patients with lesions. Aging affects Cho concentration slightly; levels in-crease very slightly with age in a young and middle-aged healthy population (Cho versus age; r⫽0.38).29This is con-sistent with our finding in the healthy control group (r⫽ 0.48). The patient group had a slightly higher mean age com-pared with the healthy control subjects, but the effect of this on Cho concentration is opposite of the observed difference; the age difference can therefore not explain our results.
One of the most important limitations in the interpretation of Cho changes in1H-MR spectroscopy is that the Cho reso-nance, under the conditions of in vivo spectroscopy, is com-plex and represents several metabolites, including phospho-choline and glycerophosphophospho-choline, and changes in any of these may result in similar spectral changes in proton spec-tra.30One should also realize that the major Cho-containing metabolite of the brain, phosphatidylcholine, remains invisi-ble for 1H-MR spectroscopy, because it is immobilized in membranes to a large extent. Any Cho alterations should therefore be interpreted very cautiously. Thus, absolute Cho concentration determined by using 1H-MR spectroscopy might therefore be a “tip of an iceberg” of all Cho intermedi-ates taking part in brain metabolism.31
It is possible that to maintain myelin sheath integrity, mIns can be replaced by Cho in phospholipids in the form
of lecithin (phosphatidylcholine), a major component of the myelin membrane. Some subjects may have an en-hanced ability to repair their myelin sheaths effectively, and they therefore do not develop typical MS lesions.
It seems that as soon as the myelin sheath is irreversibly damaged, Cho concentration increases and, consequently, le-sion foci develop.12It has been reported that Cho is an essen-tial nutrient for cell function, and deficiency of Cho leads to apoptosis.32In addition, recent genetic research has revealed altered gene expression in NAWM in patients with MS, com-pared with control subjects. This should be kept in mind when considering our results. Further study, including genetic, is therefore warranted in this field.
NAA and NAAG are regarded as markers of neuron cells. A decrease in absolute concentration of these metabolites re-flects loss of neurons in the course of illness, either reversible or persistent.33Interestingly, we also found significantly lower tNA concentrations in patients with SPMS compared with those with RRMS, consistent with a progression in the course of the disease. In the work by Pouwels and Frahm,24it was shown that there are more pronounced differences in regional intrasubject concentrations of tNA than of NAA alone, com-paring frontal, parietal, and occipital white matter. This vari-ability was attributed to NAAG distribution. We, therefore, assume that NAAG is a typical marker for neuron cells, be-cause its distribution is correlated with neuron density.
In our study, we noticed statistically significant differences in tNA between control subjects and patients. It is important to note that tNA was not strongly correlated with age, as has been shown previously.29Therefore, tNA concentration dif-ferences should not be influenced by a nonoptimal age match-ing between patients and control subjects. In patients with MS with brain lesions, axonal damage in NAWM is associated with retrograde degeneration of fibers transversed by the re-mote lesions.34No apparent lesions were detected in brain MR imaging, but this does not exclude the presence of small le-sions, which are smaller than the resolution of conventional 1.5T MR systems. These may be associated with relatively maintained myelin sheath integrity. We suggest that this might explain the observation of parallel tNA and Cho alterations.
Furthermore, we believe that the weak correlations among EDSS, tNA (negative), and mIns (positive), respectively, are likely to reflect actual metabolic changes. Other investigators have described a similar but stronger correlation between mIns and disability (EDSS).35
Conclusion
We report a lower absolute concentration of Cho in NAWM of patients with MS with a normal MR imaging brain scan. These patients may represent a subtype of MS characterized by an increased ability to protect against or a decreased ability to form lesions. Thus,1H-MR spectroscopy may help to eluci-date the metabolic variability in MS patients with different clinical expressions.
Acknowledgments
ref-erence by Richards et al.27MR Technologist Jens Engstro¨m is appreciated for skilled assistance during patient scanning. Ra-diologists Tomas Hindmarsh, Håkan Lindstam, and Leif Dav-idsson are gratefully acknowledged for expert radiologic ad-vice. Drs Declan Chard and David H. Miller at Queen’s Square Neurologic Centre in London are gratefully acknowledged for their advice and support.
References
1. Compston A, Coles A.Multiple sclerosis.Lancet2002;359:1221–31 2. Kapeller P, McLean MA, Griffin CM, et al.Preliminary evidence for neuronal
damage in cortical grey matter and normal appearing white matter in short duration relapsing-remitting multiple sclerosis: a quantitative MR spectro-scopic imaging study.J Neurol2001;248:131–38
3. McDonald WI, Compston A, Edan G, et al.Recommended diagnostic criteria for multiple sclerosis: guidelines from the International Panel on the diagno-sis of multiple sclerodiagno-sis.Ann Neurol2001;50:121–27
4. Larsson HB.Magnetic resonance imaging and spectroscopy.Acta Neurol Scand
1995;91:(suppl 159):36
5. Filippi M, Grossman RI.MRI techniques to monitor MS evolution: the present and the future. Neurology2002;58:1147–53
6. Chard DT, Griffin CM, McLean MA, et al.Brain metabolite changes in cortical grey and normal-appearing white matter in clinically early relapsing-remit-ting multiple sclerosis.Brain2002;125:2342–52
7. Brenner RE, Munro PM, Williams SC, et al.The proton NMR spectrum in acute
EAE: the significance of the change in the Cho:Cr ratio.Magn Reson Med
1993;29:737– 45
8. Rovira A, Pericot I, Alonso J, et al.Serial diffusion-weighted MR imaging and proton MR spectroscopy of acute large demyelinating brain lesions: case re-port.AJNR Am J Neuroradiol2002;23:989 –94
9. Bitsch A, Bruhn H, Vougioukas V, et al.Inflammatory CNS demyelination: histopathologic correlation with in vivo quantitative proton MR spectros-copy.AJNR Am J Neuroradiol1999;20:1619 –27
10. Helms G, Stawiarz L, Kivisakk P, et al.Regression analysis of metabolite con-centrations estimated from localized proton MR spectra of active and chronic multiple sclerosis lesions.Magn Reson Med2000;43:102–10
11. Tourbah A, Stievenart JL, Abanou A, et al.Normal-appearing white matter in optic neuritis and multiple sclerosis: a comparative proton spectroscopy study.Neuroradiology1999;41:738 – 43
12. Tartaglia MC, Narayanan S, De Stefano N, et al.Choline is increased in
pre-lesional normal appearing white matter in multiple sclerosis.J Neurol
2002;249:1382–90
13. Whittall KP, MacKay AL, Li DK, et al.Normal-appearing white matter in mul-tiple sclerosis has heterogeneous, diffusely prolonged T(2).Magn Reson Med
2002;47:403– 08
14. Davies SE, Newcombe J, Williams SR, et al.High resolution proton NMR spec-troscopy of multiple sclerosis lesions.J Neurochem1995;64:742– 48 15. Inglese M, Li BS, Rusinek H, et al.Diffusely elevated cerebral choline and creatine
in relapsing-remitting multiple sclerosis.Magn Reson Med2003;50:190 –95
16. Filippi M, Rocca MA, Minicucci L, et al.Magnetization transfer imaging of
patients with definite MS and negative conventional MRI. Neurology
1999;52:845– 48
17. Poser CM, Paty DW, Scheinberg L, et al.New diagnostic criteria for multiple sclerosis: guidelines for research protocols.Ann Neurol1983;13:227–31 18. Kurtzke JF.Rating neurologic impairment in multiple sclerosis: an expanded
disability status scale (EDSS).Neurology1983;33:1444 –52
19. Helms G.A precise and user-independent quantification technique for re-gional comparison of single volume proton MR spectroscopy of the human brain.NMR Biomed2000;13:398 – 406
20. Klose U.In vivo proton spectroscopy in presence of eddy currents.Magn Reson Med1990;14:26
21. Whittall KP, MacKay AL, Graeb DA, et al.In vivo measurements of T2
distri-butions and water contents in normal human brain.Magn Reson Med
1997;37:34 – 43
22. Frahm J, Bruhn H, Gyngell ML, et al.Localized proton NMR spectroscopy in different regions of the human brain in vivo. Relaxation times and concentra-tions of cerebral metabolites.Magn Reson Med1989;11:47– 63
23. Brief EE, Whittall KP, Li DK, et al.Proton T1 relaxation times of cerebral metabolites differ within and between regions of normal human brain.NMR Biomed2003;16:503– 09
24. Pouwels PJ, Frahm J.Differential distribution of NAA and NAAG in human
brain as determined by quantitative localized proton MRS.NMR Biomed
1997;10:73–78
25. Pouwels PJ, Frahm J.Regional metabolite concentrations in human brain as de-termined by quantitative localized proton MRS.Magn Reson Med1998;39:53– 60 26. Thorpe JW, Kidd D, Moseley IF, et al.Spinal MRI in patients with suspected
multiple sclerosis and negative brain MRI.Brain1996;119:709 –14 27. Richards TL, Alvord EC Jr, He Y, et al.Experimental allergic encephalomyelitis
in non-human primates: diffusion imaging of acute and chronic brain lesions.
Mult Scler1995;1:109 –17
28. Sarchielli P, Presciutti O, Pelliccioli GP, et al.Absolute quantification of brain metabolites by proton magnetic resonance spectroscopy in normal-appear-ing white matter of multiple sclerosis patients.Brain1999;122:513–21 29. Leary SM, Brex PA, MacManus DG, et al.A (1)H magnetic resonance
spectros-copy study of aging in parietal white matter: implications for trials in multiple sclerosis.Magn Reson Imaging2000;18:455–59
30. Bluml S, Seymour KJ, Ross BD.Developmental changes in choline- and eth-anolamine-containing compounds measured with proton-decoupled (31)P
MRS in in vivo human brain.Magn Reson Med1999;42:643–54
31. Danielsen ER, Ross B.Magnetic Resonance Spectroscopy Diagnosis of Neurological Disease. New York, NY: Marcel Dekker; 1998
32. Zeisel SH.Choline: an essential nutrient for humans.Nutrition2000;16:669 –71 33. Bjartmar C, Kinkel RP, Kidd G, et al.Axonal loss in normal-appearing white
matter in a patient with acute MS.Neurology2001;57:1248 –52
34. Evangelou N, Esiri MM, Smith S, et al.Quantitative pathological evidence for axonal loss in normal appearing white matter in multiple sclerosis.Ann Neu-rol2000;47:391–95