Emission and economic performance assessment of a solid oxide fuel cell micro-combined heat and
power system in a domestic building
Theo Elmer
1*, Mark Worall
1, Shenyi Wu
1, Saffa B Riffat
11Architecture, Climate and Environment Research Group, University of Nottingham, NG7 2RD (UK) *corresponding author email:laxte1@nottingham.ac.uk
ABSTRACT
Combined heat and power (CHP) is a promising technological configuration for reducing energy consumption and increasing energy security in the domestic built environment. Fuel cells, on account of their: high electrical efficiency, low emissions and useful heat output have been identified as a key technological option for improving both building energy efficiency and reducing emissions in domestic CHP applications. The work presented in this paper builds upon results currently reported in the literature of fuel cells operating in domestic building applications, with an emission and economic performance assessment of a real, commercially available SOFC mCHP system operating in a real building; under a UK context.
This paper aims to assess the emission and economic performance of a commercially available solid oxide fuel cell (SOFC) mCHP system, operating at The University of Nottingham’s Creative Energy Homes. The performance assessment evaluates, over a one year period, the associated carbon (emission assessment) and operational costs (economic assessment) of the SOFC mCHP case compared to a ‘base case’ of grid electricity and a highly efficient gas boiler.
Results from the annual assessment show that that the SOFC mCHP system can generate annual emission reductions of up to 56% and cost reductions of 177% compared to the base case scenario. However support mechanisms such as; electrical export, feed in tariff and export tariff, are required in order to achieve this, the results are significantly less without. A net present value (NPV) analysis shows that the base case is still more profitable over a 15 year period, even though the SOFC mCHP system generates annual revenue; this is on account of the SOFC’s high capital cost. In summary, grid interaction and incubator support is essential for significant annual emission and cost reductions compared to a grid electricity and gas boiler scenario. Currently capital cost is the greatest barrier to the economic viability of the system.
KEYWORDS:Solid oxide fuel cell, micro-combined heat and power, domestic, emission, economic
NOMENCLATURE Abbreviations
CCGT = combined cycle gas turbine CHP = combined heat and power DB = DesignBuilder
DEG = Decentralised energy generation DHW = domestic hot water
H:P = Heat to power demand ratio mCHP = micro-combined heat and power PEMFC = proton exchange fuel cell SE = Stirling engine
SOFC = solid oxide fuel cell SPBP = simple payback period
Parameters and variables
Ed= Electrical demand (kWh) ESOFC= SOFC electrical output (kWh) Eim= Imported electricity (kWh) Eex= Exported electricity (kWh) Qd= Thermal demand (kWh) QSOFC= SOFC thermal output (kWh) αE= Electricity cost (£ / kWh) αNG= Natural gas cost (£ / kWh) αFIT= Feed in tariff (£ / kWh) αEX= Export tariff (£ / kWh)
εE= Electrical emission factor (kg CO2 / kWh) εNG= Natural gas emission factor (kg CO2 / kWh)
εCCGT= Combined cycle gas turbine emission factor (kg CO2 / kWh) ηb= boiler efficiency
1. INTRODUCTION
This paper aims to assess the emission and economic performance of the commercially available BlueGEN 1.5kWe solid oxide fuel cell (SOFC) micro-combined heat and power (mCHP) system. The paper is split into seven sections. Section one provides an introduction to mCHP and fuel cell mCHP operating in domestic built environment applications. Following this the papers aims and objectives are introduced, along with the two scenarios investigated, base case (grid electricity and gas boiler) and fuel cell mCHP. Section two provides details of the building and its associated electrical and thermal energy loads. Section three outlines the calculation methodology used in the performance assessment. Section four presents the results of the annual emission assessment. Section five provides the results of the annual economic and net present value assessment. In section six the heat to power demand ratio of the home is varied to see its impact on the fuel cell mCHP system’s performance. Section seven provides conclusions to the results and looks forward in reference to their impact on fuel cell mCHP deployment in domestic built environment applications.
1.1 Micro-combined heat and power
Combined heat and power (CHP) is defined as the generation of heat and power from a single fuel source, with the view to using both products. Fuel is supplied from the central network to the prime mover technology (internal combustion engine, Stirling engine (SE), fuel cell), to produce electrical power, and in the process heat is generated, as shown in Figure 1. The electricity is used directly in the home, and if grid interactive; can be imported or exported as required. The heat produced in the electrical generation process is recovered and used in applications such as space heating or domestic hot water (DHW). Depending on the prime mover technology and the extent of waste heat utilisation, system efficiency can be elevated from as low as 20% to over 90% [1]. CHP in domestic buildings is often referred to as mCHP and is commonly defined as anything with a power output of less than 5kWe. mCHP systems produce electricity at point of use, this is referred to as decentralised energy generation (DEG). Advantages associated with DEG, as opposed to traditional centralised generation, include:
Improved system efficiency, otherwise wasted heat is utilised , therefore system efficiency can be elevated from as low as 30-50% in central power stations to around 70 - 90% [1]. Figure 1 illustrates the potential efficiency gains possible when switching from centralised to decentralised energy generation with mCHP.
DEG with mCHP significantly reduces transmission losses, which account for 6 – 24% in the European transmission network [2].
Improved system efficiency and greater fuel utilisation leads to reduced primary energy demands, resulting in cuts to CO2 emissions and operating costs [3].
Electricity is regarded as having an economic value of roughly three times that of gas. Therefore converting lower cost gas (common fuel in domestic mCHP) to electricity allows households to recover cost and reduce energy bills. This is an important factor in the fight against fuel poverty [4].
Centralised decarbonisation of electricity generation in many countries is problematic because of opposition to low carbon technologies such as renewables and nuclear. mCHP in consumers’ homes offers an option to assist in both decarbonising electricity production and providing energy saving benefits directly to the home owner [4].
1.1 Fuel cell mCHP systems in the domestic built environment
Currently there are three main technologies used as prime movers in mCHP systems; internal combustion engine, Stirling engine – both combustion based technologies, and fuel cells. Because of the low electrical efficiency and correspondingly high thermal output of the combustion based technologies, their operation is restricted to periods where their thermal output can be fully utilised i.e. winter, otherwise the mCHP system cannot expect to deliver a net benefit relative to grid electricity and a highly efficient condensing boiler [5]. Fuel cells, however, with their higher electrical efficiency have much lower heat to power ratios; therefore their operation can be largely independent of thermal demand, making them a well suited technology for domestic mCHP applications [6]. As a result, the fuel cell can be operated either constantly or in an electrically-led manner throughout the year, thus providing increased net benefit to the user. Furthermore, the near silent operation of fuel cells make them more easily integrated into a domestic setting. E.ON believes most UK homes are technically suitable for fuel cell mCHP, equal to a potential total installed capacity of 24GWe[7].
Of the six developed fuel cell technologies on the market, the low temperature proton exchange membrane fuel cell (PEMFC) and the high temperature SOFC demonstrate the greatest promise for early market application as mCHP systems in domestic buildings [8-10]. The fuel cell considered in this paper is a SOFC type.
In the literature it is apparent that a large proportion of work has focussed on the optimisation of the size of fuel cell mCHP systems for domestic built environment applications; however limited work has been conducted on the assessment of a real, commercial system in a real working environment [14, 15]. The work presented in this paper builds upon results currently reported in the literature of fuel cells operating in domestic building applications, with an emission and economic performance assessment of a real, commercially available SOFC mCHP system operating in a real building; under a UK context. The assessment includes UK emission and economic externalities; however the relative performance and summary conclusions are applicable in a wider context.
1.2 Aims and objectives
[image:4.595.91.514.242.383.2]This paper aims to assess the emission and economic performance of the commercially available BlueGEN 1.5 kWeSOFC mCHP system. The performance assessment evaluates, over a one year period, the associated carbon (emission assessment) and operational costs (economic assessment) of the BlueGEN SOFC mCHP case compared to a ‘base case’ of grid electricity and a highly efficient gas boiler. Figure 1 illustrates the two cases investigated. Additionally, a net present value (NPV) analysis is used to compare both cases over a 15 year lifetime.
Figure 1 - The energy scenarios investigated
A secondary aim of the paper is to assess the impact the heat to power demand ratio (H:P) of the home has on the BlueGEN SOFC mCHP system’s emission and economic performance. The H:P of a home is the ratio of how much thermal energy to electrical energy is required. Traditionally, UK homes are characterised by a high H:P, however, it is now widely accepted that in newer houses this ratio is falling on account of reduced thermal demand (improved building practice and materials) and increased power demand (more electrical appliances with higher power ratings) [16]. Two H:P cases are investigated by firstly simulating the home as built to 2006 UK building regulations, which yields a low H:P [16, 17], seen in Sections 3, 4 and 5. The home, is then re-simulated in Section 6, built to pre-1970s UK building regulations, which yields a high H:P [16, 17]. The two H:P cases are then compared, to see which scenario produces the greatest relative savings compared with the base case of grid electricity and gas boiler. This is an important investigation as it can help inform where future investment and deployment of fuel cell mCHP technology in the domestic built environment should be targeted. Throughout the paper, an evaluation by Conroy et al. [13] of a SE mCHP system operating in a domestic dwelling will be used as a comparison for the BlueGEN SOFC mCHP system, to illustrate any performance differences between the two technologies.
1.3 Base case scenario data
[image:4.595.111.482.606.761.2]Table 1 outlines the input data used for the base case scenario of grid electricity and gas boiler. These values are assumed constant for the entire assessment period and are also used in the SOFC mCHP analysis for the supplementary heat and electricity.
Table 1 - Base case scenario data
Base case scenario variable Value
Electricity supply National grid
Boiler seasonal efficiency (SEDBUK) 90%
Unitary distribution loss 5%
Heating system CoP 85.5%
System Central heating using water: radiators
Heating system fuel Natural gas
Domestic Hot water (DHW) Instantaneous combination
Supply water temperature 65°C
1.4 BlueGEN SOFC mCHP system
[image:5.595.177.389.148.262.2]A BlueGEN 1.5kWeSOFC mCHP system has been installed at The University of Nottingham’s Creative Energy Homes. Figure 2 shows a photograph of the installed unit, auxiliary boiler and heat recovery circuit. The SOFC internally reforms methane from the natural gas stream into hydrogen, and thus cannot be considered a zero carbon generator on account of some CO2production. Currently, it is estimated that the achievable reduction in CO2emissions for a fuel cell mCHP system running on natural gas is around 30% compared to grid electricity and a gas fired boiler [18].
Figure 2 - BlueGEN SOFC mCHP installed at The University of Nottingham
[image:5.595.192.404.443.535.2]Due to technological constraints, the BlueGEN SOFC runs continuously without the possibility for shut / turn down [19]. During periods of excess electrical demand, electricity is imported from the national grid. Conversely, during periods of excess electrical generation, electricity is exported to the national grid. During periods of excess thermal demand, auxiliary energy is supplied by a condensing gas boiler, and during periods of excess thermal supply from the BlueGEN, is stored in a hot water cylinder. Other mCHP technologies such as PEMFCs or SEs, have the option for shut / turn down, and thus can follow the homes energy loads in an electrical or heat led manner, thus minimising the electrical export / heat storage condition. Table 2 gives the BlueGEN SOFC mCHP performance indices. The BlueGEN unit aims to continuously maintain its 1.5 kWe electrical output, the observable performance fluctuations over time are seen in its electrical efficiency, which in turn affects the calculated input gas flow. Data collected from the installed BlueGEN SOFC shows very stable performance over the six week period since installation. Based on the experimental data (normally distributed), a mean electrical efficiency of 59.74% has been calculated, and assumed constant for the entire assessment period. The assumption of stable electrical efficiency is supported by a standard deviation of 0.38 i.e. a considerably small standard deviation indicates that all the data points (electrical efficiency) are clustered closely about the mean.
Table 2 BlueGEN performance summary SOFC performance summary Value
Electrical power 1.5 kWe Electrical efficiency 59.74% ± 0.38
Thermal power 0.75 kWth
Thermal efficiency ~ 30%
CHP efficiency ~ 90%
2. BUILDING SIMULATION
In this section, details of the building and its associated electrical and thermal energy loads are provided. DesignBuilder (DB) has been employed to simulate the home’s hourly thermal (space heating and DHW) and electrical (lighting and appliances) demand profile over the course of one year. Using a high temporal resolution (hourly) means an accurate analysis can be completed for each case.
2.1 Building simulation data
[image:5.595.212.382.665.778.2]Table 3 outlines the building’s main construction elements used in the simulation, typical of a home built to 2006 Part L Building Regulations in the UK. These values represents the ‘low’ H:P home [16].
Table 3 building simulation data
Building element Value
External wall 0.27 W/m2.K Glazing 2.042 W/m2.K
Roof 0.13 W/m2.K
Occupied floor area 146 m2
2.2 Building electrical and thermal demand profile
[image:6.595.130.470.152.454.2]Figure 3 represents the annual thermal and electrical demand profile of the home. The profile is characterised by a high space heating load in winter, and low/no load in summer. DHW and electrical demand is almost constant throughout the year. From Table 4, it can be seen that the average H:P is around 1.75, typical of a low to average UK home [16, 17].
Figure 3 - Building energy load profile
Table 4 - Building energy loads
Annual thermal demand 7814 kWh Annual electrical power demand 4525 kWh Annual H:P demand ratio ~ 1.75
3. CALCULATION METHODOLOGY
This section outlines the calculation methodology used in the emission and economic performance assessment. Using the hourly simulation data, taken from Section 2, an emission and economic assessment can be completed for both the base and SOFC mCHP case on an hourly basis over the course of one year. The procedure and mathematical representation is described below.
3.1 Base case – emission and economic assessment
The total emission for the base case at each time step (t) is shown in Equation 1. ܤܽݏ݁݁݉ ݅ݏݏ݅݊ݏ(ݐ) =ܧௗ.ߝா+൬ߟ ܳௗ
.ߟௗ௦௧.ߝேீ൰
1
The annual emissions for the base case are calculated by summing each hourly time step over one year, shown in Equation 2.
ܶݐ݈ܽ௦ ௦௦௦(௧)
଼
௧ୀଵ
2
The total cost for the base case at each time step (t) is shown in Equation 3. ܤܽݏ݁ܿݏݐ(ݐ) =ܧௗ.ߙா+൬ߟ ܳௗ
.ߟௗ௦௧.ߙேீ൰
3
The annual costs for the base case are calculated by summing each hourly time step over one year, shown in Equation 4.
0 50 100 150 200 250 300 350
0 10 20 30 40 50 60 70
Day number
E
n
er
g
y
d
em
an
d
(k
W
h
)
ܶݐ݈ܽ௦௦௧(௧)
଼
௧ୀଵ
4
3.2 BlueGEN SOFC mCHP case - emission and economic assessment
The BlueGEN SOFC mCHP system runs constantly, it cannot be shutdown, the electrical output, thermal output and electrical efficiency are known from experimental data given in Table 2. To calculate the energy usage of the BlueGEN SOFC mCHP case, an electrical and thermal energy balance was completed at each time step, using binary variables to indicate whether electricity was imported or exported to and from the national grid and whether the auxiliary boiler was required.
The total emission at each time step (t) is shown in Equation 5. ܱܵܨܥ݁݉ ݅ݏݏ݅݊ݏ(ݐ) =൬ܧௌைி
ߟௌைி+
ܳௗ−ܳௌைி
ߟ.ߟௗ௦௧ .ߝேீ൰+ (ܧ.ߝா)−(ܧ௫.ߝீ்)
5
The annual emissions for the SOFC case are calculated by summing each hourly time step over one year, shown in Equation 6.
ܶݐ݈ܽௌைி ௦௦௦(௧)
଼
௧ୀଵ
6
The total cost for the SOFC case at each time step (t) is shown in 7. ܱܵܨܥܿݏݐ(ݐ) =൬ܧߟௌைி
ௌைி+
ܳௗ−ܳௌைி
ߟ.ߟௗ௦௧ .ߙேீ൰+ (ܧ.ߙா)−(ܧௌைி.ߙிூ்)−(ܧ௫.ߙா)
7
The annual costs for the SOFC case are calculated by summing each hourly time step over one year, shown in Equation 8.
ܶݐ݈ܽௌைி௦௧(௧)
଼
௧ୀଵ
8
The Simple payback period (SPBP) is calculated using 9.
ܵܲܤܲ=ܱܵܨܥܥܽ݅ݐ݈ܽܿݏݐܣ݊݊ݑ݈ܽݏܽݒ݅݊݃ݏ
9
3.3 Net present value analysis
The present value (PV) of each annual cash flow in both the base case and SOFC case can be discounted back to its present value. The NPV, shown in 10, can be determined by summing the PV for each year, staring at year 0 i.e. the investment, to year 15 (lifetime of the SOFC device).
ܸܰܲ (1 +ܴ݅) ଵହ
ୀ
10 4. EMISSION ASSESSMENT
Table 5 - Emission analysis constants
Emissions analysis constants Value Reference
Grid electricity emission factor 0.555 (kg CO2/ kWhe) [21] CCGT electricity emission factor 0.36 (kg CO2/ kWhe) [22] Natural gas emission factor 0.184 (kg CO2/ kWhe) [23]
Figure 4 - Emissions analysis annual plot
[image:8.595.131.464.548.645.2]Figure 4 shows the results of the emission assessment over the one year period. Table 6 shows that the BlueGEN SOFC mCHP system reduces the homes associated CO2emissions by over 56% compared to the base case scenario. It is evident from Table 6 that natural gas consumption has increased by 189%; however electrical import has reduced by 98%, and there is now electrical export. The associated CO2of electrical import is around three times that of gas and electricity export one and a half, thus, the BlueGEN SOFC mCHP system has made a marked improvement to the emission performance of the home. However without electrical export being considered, the BlueGEN SOFC mCHP system would actually have a 17% increase in associated CO2 emissions, illustrating the critical importance of having grid interaction available for the device. An assessment of a 1kWe WhisperGen SE mCHP in a domestic dwelling demonstrated emission reductions of around 16.1% per annum, around a third of that of the BlueGEN device [13]. The SE device has a lower electrical efficiency and is operated in a heat led on/off manner. This limits the amount of low carbon electricity produced by the SE onsite, whereas the BlueGEN SOFC mCHP system has a much higher electrical efficiency and is operated constantly, and thus benefits from large emission abatement due to exported electricity. However, constant operation will only provide net benefit when grid interaction is possible i.e. it can export its electricity.
Table 6 - Emission analysis results Emissions(kg CO2/ per annum)
Base Case BlueGEN Percentage change
Natural gas 1691.60 4889.15 189.62
Electricity import 2511.50 30.54 -98.78
Electricity export --- -3121.13
---TOTAL 4203.09 1808.56 -56.97
5. ECONOMIC ASSESSMENT
[image:8.595.135.466.746.780.2]In this section, the results of the economic assessment are presented. Table 7 outlines the economic constants used in the assessment, and are assumed constant for the entire assessment period. These apply to both the base and SOFC case. In the UK, fuel cell mCHP qualifies for the micro-generation FiT. Under this scheme, the UK government pays 12.5 pence per kWh of electricity generated, regardless of whether it is consumed or exported. Furthermore, 4.5 pence is paid for every kWh of electricity exported to the national grid [24].
Table 7 - Economic analysis constants
Economic analysis constants Value Reference
Grid electricity 0.172 (£/kWhe) [25]
0 1000 2000 3000 4000 5000 6000 7000 8000
0 0.5 1 1.5 2 2.5
Hour number
A
ss
o
ci
at
ed
em
is
si
o
n
s
(k
g
/C
O
2)
Natural gas 0.0421 (£/kWh) [23]
mCHP FiT (OFGEM) 0.125 (£/kWhe) [24]
Export tariff (OFGEM) 0.045 (£/kWhe) [24]
BlueGEN cost (£) 19,950 (£) [26]
BlueGEN installation cost (£) 1,000 (£)
Boiler cost 800 (£)
[image:9.595.136.464.69.177.2]Boiler / BlueGEN gas check 60 (£ / per annum)
Figure 5 shows the results of the economic assessment over the one year period. Table 8 shows that the SOFC mCHP scenario creates a 177% reduction in annual operating cost i.e. it now generates a revenue, when the FiT and export tariff are considered, a 36% reduction in cost when only export tariff is considered, and a 3% reduction in cost when no FiT or export tariff is considered. These results illustrate the importance of having both grid interaction available for the SOFC device and national support mechanisms such as the FiT, to generate profitable returns compared to the base case scenario.
[image:9.595.107.472.258.558.2]Figure 5 - Economics analysis annual plot
Table 8 - Economic analysis results Cost(£ / per annum)
Base Case BlueGEN with FiT BlueGEN without FiT Percentage change
Gas 387.04 1120.95 1120.95 189.62
Electricity 778.34 9.46 9.46 -98.78
Electricity export --- -390.14 -390.14
---FiT --- -1642.50 ---
---TOTAL 1165.38 -902.23 740.27
---Percentage change with base case -177.42 -36.48
---Conroy et al. [13] report that a 1kWeSE mCHP unit, operating in a similar application, generated an annual cost saving of around £150 compared to the condensing gas boiler and grid electricity, this value includes an export tariff, but not FiT. The BlueGEN SOFC mCHP case without FiT considered generates an annual cost saving of £425. This almost three fold improvement is due to the BlueGEN’s higher electrical efficiency (creates more value) and constant operation. Based on the economic analysis, and including the FiT / export tariff, the SOFC mCHP system has a simple payback period (SPBP) of 9.65 years, excluding the FiT it has a SPBP of almost 47 years. In comparison, the SE mCHP system [13], with no FiT support, has a SPBP of 13.8 years. Although the SE is not as profitable on annual operating costs, its lower capital cost of around £2000 means its SPBP is more acceptable. The BlueGEN mCHP system will only be attractive to investors with the current UK support mechanisms in place (FiT); otherwise the SPBP is too long. In order to achieve a reasonable SPBP, that is both attractive and profitable for the consumer, of around 5 years, the initial capital cost of the BlueGEN SOFC mCHP system needs to fall to around £10,300 with FiT support and £2,125 without.
0 1000 2000 3000 4000 5000 6000 7000 8000
-0.15 -0.1 -0.05 0 0.05 0.1 0.15 0.2 0.25 0.3 0.35 0.4 0.45 0.5 0.55 0.6
Hour number
A
ss
o
ci
at
ed
co
st
(£
)
5.1. Net present value (NPV) analysis
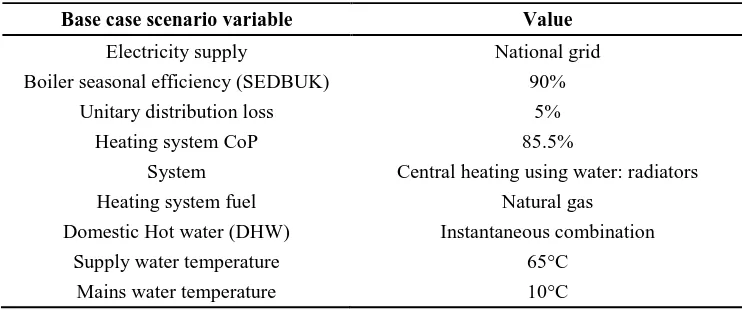
[image:10.595.130.466.228.539.2]The NPV analysis has been carried out for both cases at a high (15%) and low (7%) interest rate condition. Inflation has also been accounted for at 2.5% per annum for all cases. The cash flows in the analysis include; purchase of the boiler / BlueGEN SOFC unit, installation, annual servicing, energy cost and revenues gained from FiT and export tariffs. These values are assumed constant for the entire 15 year NPV assessment period. Table 9 and Figure 6 shows the result of the NPV analysis over a 15 year period (lifetime of the SOFC), neither scenario return a positive NPV, however the higher NPV of the base case scenario shows that it is economically better to invest in the boiler and grid electricity system, rather than the BlueGEN SOFC mCHP system. It is thus apparent that it is the initial capital cost of the BlueGEN SOFC mCHP system that is the largest barrier to investment, because, as seen in Section 5, the BlueGEN SOFC mCHP system generates annual revenue instead of cost. In the SE mCHP analysis conducted by Conroy et al. [13], the significantly lower investment cost of £2,000 (90% cheaper) means the SE mCHP system returns a higher NPV than the boiler and grid electricity scenario (both still negative, and in the range of -£13,000), again illustrating that the largest barrier to the economic viability of the BlueGEN SOFC mCHP lies with its initial cost.
Table 9 - NPV analysis results
Scenario NPV (£)
BlueGEN at 7% -14,423.32 Base Case at 7% -10,795.82 BlueGEN at 15% -16,638.04 Base Case at 15% -7,573.57
Figure 6 - Base case and BlueGEN NPV analysis
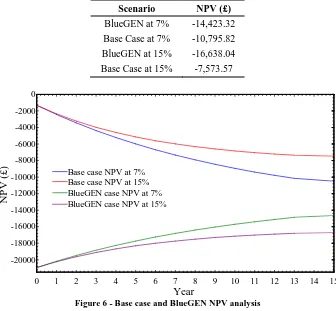
6. HEAT TO POWER DEMAND RATIO ASSESSMENT
In this section, the H:P of the home is varied to see its impact on the BlueGEN SOFC mCHP system’s performance. The home is re-simulated with building materials that comply with pre-1970s UK building regulations. The summary of the annual energy loads are shown in Table 10. It is evident that the H:P is now around twice that of the case investigated in Sections 3, 4, 5 and 6, and is considered a high H:P in the UK [16, 17].
Table 10 - Summary of building energy loads of the high H:P case
Thermal demand 18167 kWh Power demand 4525 kWh H:P demand ratio ~ 4
The same emission and economic assessment procedure used for the low H:P case has also been carried out for the high H:P case. The results in terms of percentage reduction between the BlueGEN SOFC mCHP and base case of grid electricity and boiler have been plotted for both the low and high H:P cases in Figure 7. It is clear that the relative percentage reduction across all performance indices (emission and economic) is greatest in the low H:P case. The greatest reduction is found in the low H:P case due to a greater proportion of the total energy demand of the home coming from the BlueGEN SOFC mCHP system, which has overall greater efficiencies than grid electricity and gas boiler. There is a reduced requirement of imported electricity and the auxiliary boiler. Based on the result, the recommendation would be to focus BlueGEN SOFC mCHP deployment in newer domestic homes with a lower (< 2) H:P.
0 1 2 3 4 5 6 7 8 9 10 11 12 13 14 15
-20000 -18000 -16000 -14000 -12000 -10000 -8000 -6000 -4000 -2000 0
Year
N
P
V
(£
Figure 7 - H:P emission and economic performance comparison
7. CONCLUSIONS
The aim of this paper has been to assess the emission and economic performance of the commercially available BlueGEN 1.5kWe SOFC mCHP system against a ‘base case’ scenario of grid electricity and a highly efficient condensing gas boiler. Results from the assessment show that that the BlueGEN SOFC mCHP system can generate annual emission reductions of up to 56% and cost reductions of 177% compared to the base case scenario. The emission assessment in this paper has considered electrical export as a form of carbon abatement. Without this consideration, the SOFC mCHP system would actually generate an emission growth due to the increased import of natural gas. The BlueGEN SOFC mCHP system generates such a large reduction in cost due to the combination of; high electrical efficiency, constant operation and the inclusion of the FiT. When the FiT is not considered the annual cost reductions are only 36% less than the base case, signifying the importance of incubator support for this technology. A SPBP analysis shows that the system will pay for itself within 10 years with FiT support and 47 years without. In order for the SPBP to fall to a more reasonable level of around 5 years, the capital cost of the BlueGEN SOFC mCHP system needs to be £10,300 with FiT support (possible in the next couple of years), and £2,125 without (similar to that of a SE mCHP system). An NPV analysis of both the BlueGEN SOFC mCHP case and base case has showed that the base case is still more profitable over the 15 years even though the BlueGEN SOFC mCHP system generates annual revenue. The NPV results further exemplifies the fact that it is the initial capital cost of the BlueGEN SOFC mCHP systems that is the largest barrier to a profitable economic case. Overall the BlueGEN SOFC mCHP system shows better performance in terms of emissions and cost compared to the base case scenario and the SE mCHP system; however support mechanisms (electrical export, FiT and export tariff) are still required in order to achieve this.
A further aim of the paper was to assess the impact the H:P of the home has on the performance of the BlueGEN SOFC mCHP system compared to the base case scenario of grid electricity and gas boiler. The results show that the BlueGEN SOFC mCHP system performs best in a low H:P home (<2), generating greater relative savings with the base case, due to a greater proportion of the total energy demand of the home coming from the BlueGEN SOFC mCHP system. Thus, the recommendation would be to focus BlueGEN SOFC mCHP deployment in newer domestic homes with lower H:Ps.
Fuel cell technology operating in the domestic built environment offers significant advantages, most significantly, sizeable emission and cost reductions compared to conventional domestic building energy supply. However, there are some key considerations that need to be addressed before the wider uptake of the BlueGEN and SOFC technology in general, occurs:
1. Grid interaction is essential for significant emission and cost reductions.
2. Currently, capital cost makes the BlueGEN SOFC mCHP system un-economical compared to grid electricity and gas boiler.
3. The BlueGEN SOFC mCHP system generates greatest savings in homes with a low H:P 0
20 40 60 80 100 120 140 160 180 200
CO2 Cost with FiT Cost without FiT
P
er
ce
n
ta
g
e
ch
an
g
e
(b
as
e
w
it
h
S
O
F
C
C
as
e)
4. The increased reliance on natural gas in the case of the BlueGEN SOFC mCHP system needs consideration, as this could have serious implications for the future development of a more robust and secure energy system, less reliant on foreign imports of energy.
ACKNOWLEDGEMENTS
REFERENCES
[1] A. Choudhury, Chandra, H., Arora, A., "Application of solid oxide fuel cell technology for power generation—A review,"Renewable and Sustainable Energy Reviews,vol. 20, pp. 430-442, 2013.
[2] M. Peht, Cames, M, Fischer, C, Prateorius, B, Schneider, L, Schumacher, K, Voss, J, Micro Cogeneration Towards
Dencentralized Energy Systems. Berlin: Springer, 2006.
[3] T. C. Fubara, Cecelja, Franjo., Yang, Aidong., "Modelling and selection of micro-CHP systems for domestic energy supply: The dimension of network-wide primary energy consumption,"Applied Energy,vol. 114, pp. 327-334, 2014. [4] I. Staffell, "Fuel Cells for Domestic Heat and Power: Are They Worth It?," Chemical Engineering, The University of
Birmingham, Birmingham, 2009.
[5] I. Beaussoleil-Morrison. (2008, An Experimental and Simulation-Based Investigation of the Performance of Small Scale Fuel Cell and Combustion-Based Cogeneration Devices Serving Residential Buildings. Annex 42 of the International
Energy Agency’s Energy Conservation in Buildings and Community Systems Programme.
[6] A. Hawkes, Staffell, Iain., Brett, Dan., Brandon, Nigel, "Fuel cells for micro-combined heat and power generation,"
Energy & Environmental Science,vol. 2, pp. 729-744, 2009.
[7] J. Harrison, "E.ON - Smart Homes with Fuel Cell micro CHP," in Smart Hydrogen & Fuel Cell Power Conference, Birmingham, 2012.
[8] P. Kazempoor, Dorer, Viktor., Weber, Andreas., "Modelling and evaluation of building integrated SOFC systems,"
International Journal of Hydrogen Energy,vol. 36, pp. 13241-13249, 2011.
[9] M. T. Gencoglu and Z. Ural, "Design of a PEM fuel cell system for residential application," International Journal of
Hydrogen Energy,vol. 34, pp. 5242-5248, 2009.
[10] N. M. Sammes and R. Boersma, "Small-scale fuel cells for residential applications,"Journal of Power Sources,vol. 86, pp. 98-110, 2000.
[11] A. D. Peacock and M. Newborough, "Impact of micro-CHP systems on domestic sector CO2 emissions," Applied
Thermal Engineering,vol. 25, pp. 2653-2676, 2005.
[12] D. Carter. (2012). Fuel Cell Residential Micro-CHP Developments in Japan, ENE.FARM. Available: http://www.fuelcelltoday.com/media/1597029/29-02-12_ene-farm.pdf
[13] G. Conroy, Duffy, A., Ayompe, L. M., "Economic, energy and GHG emissions performance evaluation of a WhisperGen Mk IV Stirling engine μ-CHP unit in a domestic dwelling," Energy Conversion and Management,vol. 81, pp. 465-474, 2014.
[14] A. Adam, Fraga, Eric S., Brett, Dan J. L., "Modelling and Optimisation in Terms of CO2 Emissions of a Solid Oxide Fuel Cell based Micro-CHP System in a Four Bedroom House in London,"Energy Procedia,vol. 42, pp. 201-209, 2013. [15] V. Dorer, Weber, R., Weber, A., "Performance assessment of fuel cell micro-cogeneration systems for residential
buildings,"Energy and Buildings,vol. 37, pp. 1132-1146, 2005.
[16] DECC. (2013, 23/03/2014). Energy Consumption in the UK (2013) Chapter 3 - Domestic energy consumption in the UK
between 1970 and 2012. Energy Consumption in the UK. Available:
https://www.gov.uk/government/uploads/system/uploads/attachment_data/file/65954/chapter_3_domestic_factsheet.pdf [17] OFGEM. (2011, 26/03/2014). Typical domestic energy consumption figures. OFGEM Factsheet 96. Available:
https://www.ofgem.gov.uk/ofgem-publications/76112/domestic-energy-consump-fig-fs.pdf
[18] FCT. (2012, 21/10/2013). Fuel Cell Today; the leading authority on fuel cells: The Fuel Cell Today Industry Review 2012. Fuel Cell Today; the leading authority on fuel cells [Electronic article]. Available: http://www.fuelcelltoday.com/media/1713685/fct_review_2012.pdf
[19] CFCL. (2009). Electronic resource: CFCL BlueGEN Modular Generator - Power and Heat [Electronic resource]. Available:http://www.bluegen.info/Assets/Files/BlueGen_Brochure_(ENG_GER)_April_2010.pdf
[20] M. Buick. (2013, 25/04/2014). How much CO2 pollution do solar panels save. Available: https://www.ethex.org.uk/blog/?p=243
[21] AMEE. (2014, 06/04/2014).realtime carbon. Available:http://realtimecarbon.org/
[22] AMEE. (2014, realtime carbon project methodology. Available:www.realtimecarbon.org/forum
[23] E. s. Trust. (2014). Energy Saving Trust - Our Calculations. Available: http://www.energysavingtrust.org.uk/Energy-Saving-Trust/Our-calculations
[24] DECC. (2014, 06/04/2014).CHP Incentives - Feed-in Tariff. Available:http://chp.decc.gov.uk/cms/feed-in-tariff/ [25] Comparemysolar. (2013, 06/03/2014). Electricity Price per kWh (2013). Available:
http://blog.comparemysolar.co.uk/electricity-price-per-kwh-2013-comparison-of-e-on-edf-npower-british-gas-scottish-and-sse/
[26] F. C. Today. (2012, 24/09/2013). BlueGen Domestic Fuel Cell Available for Under £20,000 in the UK. Available: