Journal of Real-Time Image Processing manuscript No. (will be inserted by the editor)
Kristina Doycheva · Christian Koch · Markus K¨onig
Implementing Textural Features on GPUs for
Improved Real-time Pavement Distress Detection
Received: date / Revised: date
Abstract The condition of municipal roads has deteriorated considerably in recent years, leading to large scale pavement distress such as cracks or potholes. In order to enable road maintenance, pavement distress should be timely detected. However, manual investigation, which is still the most widely applied approach towards pavement assessment, puts maintenance personnel at risk and is time-consuming. During the last decade several efforts have been made to automatically assess the condition of the municipal roads without any human intervention. Vehicles are equipped with
K. Doycheva
Ruhr-University Bochum, Universitaetsstr. 150, Gebaeude IC 6-69, 44780, Bochum, Germany Tel.: +49-234-3224640
E-mail: kristina.doycheva@rub.de
C. Koch
University of Nottingham, Room B67 Coates Building, University Park, Nottingham, NG7 2RD, UK Tel.: +44-115-8468933
E-mail: christian.koch@nottingham.ac.uk
M. K¨onig
Ruhr-University Bochum, Universitaetsstr. 150, Gebaeude IC 6-59, 44780, Bochum, Germany Tel.: +49-234-3223047
E-mail: koenig@inf.bi.rub.de
sensors and cameras in order to collect data related to pavement distress and record videos of the pavement surface.
Yet, this data is usually not processed while driving, but instead it is recorded and later analyzed offline. As a result, a vast amount of memory is required to store the data and the available memory may not be sufficient. To reduce the amount of saved data, the authors have previously proposed a Graphics Processing Units (GPU)-enabled pavement distress detection approach based on the wavelet transform of pavement images. The GPU implementation enables pavement distress de-tection in real time. Although the method used in the approach provides very good results, the method can still be improved by incorporating pavement surface texture characteristics.
This paper presents an implementation of textural features on GPUs for pavement distress detec-tion. Textural features are based on gray tone spatial dependencies in an image and characterize the image texture. To evaluate the computational efficiency of the GPU implementation, perfor-mance tests are carried out. The results show that the speed-up achieved by implementing the textural features on the GPU is sufficient to enable real-time detection of pavement distress. In addition, classification results obtained by applying the approach on 16,601 pavement images are compared to the results without integrating textural features. There results demonstrate that an improvement of 27% is achieved by incorporating pavement surface texture characteristics.
Keywords pavement distress detection, textural features, Haralick features, graphics processing units
1 Introduction
In recent years, the pavement condition has deteriorated rapidly. As a result of this deterioration, pavement distress, such as crack and potholes, occurs. In order to keep the roads in good condition and to extend pavement life, it is necessary to detect this distress in the early stages of pavement deterioration.
However, the detection of pavement distress is still mostly performed manually by trained person-nel, which is time-consuming and tedious. Therefore, efforts to automatically assess the condition of the roads using cameras and sensors installed on vehicles have been made in recent years. Various
research methods for pavement assessment and evaluation have been proposed, namely sensor-based and visual-sensor-based methods [16].
Yet, most of these methods do not detect key indicators of deteriorating pavement condition in real-time, since state-of-the-art CPU processors which are used for pavement image processing are not able to execute the corresponding algorithms fast enough.
Nevertheless, current technology provides us with an opportunity to implement these methods on various architectures in order to accelerate the execution and achieve efficiency. Graphics Process-ing Units (GPU) have emerged as a powerful tool for massively parallel computations in recent years [24].
The authors already have proposed an implementation of the wavelet transform for pavement dis-tress detection on GPUs [9]. Although promising results have been achieved, the adopted method for pavement distress detection needs enhancement due to the variety of different textures roads are characterized with, which makes it impossible to develop universal methods capable of detect-ing distress on various types of roads. Therefore, in state-of-the-art pavement assessment studies, the methods for distress detection have been optimized for a certain type of pavement. However, if fully automated pavement distress detection is pursued, the methods should be able to detect distress on all types of roads independently from the pavement texture.
To address this issue and compensate the limitation of the previous method to distinguish between different types of pavement, this paper presents a method capable of detecting distress on pavement images with various textures by incorporating textural features. The method was implemented for graphics processing units using the Open Computing Language (OpenCL) to make it capable of real-time processing.
2 Related work
2.1 State of research and practice in the pavement distress detection field
Although the assessment of the road pavement is still mostly performed manually, several methods based on computer vision have been proposed. Thereby, images obtained by cameras installed in vehicles are first pre-processed in order to remove noise and shadows. Then, the images are
analyzed with respect to distress using specifically developed algorithms. For example, Cafiso et al. [4] proposed a clustering method which tries to identify patches in the images, while Radopoulou and Brilakis [29] applied morphological operations for the same purpose. Approaches for pothole detection have also been proposed. Yu and Salari [41] used laser imaging to analyze pothole severity. The majority of the pavement assessment methods have been developed for crack detection (Fang et al. [5], Huang and Xu [12], Li et al. [18], Moussa and Hussain [20], Oliveira and Correia [23], Salman et al. [31], Subirats et al. [34], Tanaka and Uematsu [35],Varadharajan et al. [38], Vivekanandreddy et al. [39], Zou et al. [43]). However, all of the methods mentioned above consider only one type of distress. As several types of distress occur, it is necessary to develop methods capable of assessing all of them at once. In addition, the images are analyzed offline, which leads to a large amount of stored data.
2.2 Wavelet transform for pavement distress detection
In our previous work, we proposed an implementation of image pre-processing operations and the wavelet transform for pavement distress detection on graphics processing units [9]. For pre-processing, the top-hat transform and median filtering were implemented on the GPU. The wavelet transform was applied by Zhou et al. [42] on pavement images in order to detect distress such as diverse types of cracks or potholes. The wavelet transform decomposes an image into different-frequency coefficients. Based on the assumption that distress usually is a high-different-frequency component which is transformed into high-amplitude wavelet coefficients, Zhou suggested three statistical criteria for pavement distress detection, namely the high-frequency energy percentage (HFEP), the standard deviation of the wavelet coefficients (STD), and the high-amplitude wavelet coefficient percentage (HAWCP). Our implementation of the pre-processing steps, the wavelet transform and the HAWCP computation on GPU yielded very good results in terms of efficiency. On an NVIDIA Tesla C2070 GPU a speed up of 9000 against a sequential C++ implementation was achieved. However, although promising distress detection results were obtained in a case study, in our opinion, the success rate leaves room for improvement and the methodology needs to be extended, so that different types of pavement are evaluated correctly.
2.3 Graphics processing units
Graphics processing units (GPUs) have originally been designed mainly for rendering images, an-imations and videos. However, they are nowadays utilized not only for graphics processing but also for parallel processing of diverse types of algorithms. General purpose graphics processing units (GPGPU) are increasingly applied for real-time applications. Nevertheless, as far as we are concerned, there exist no implementations of textural feature calculations on graphics processing units, which is one of hte main contributions of this paper.
Several programming frameworks for GPU have been developed. Among them the Compute Unified Device Architecture (CUDA) and Open Computing Language (OpenCL) are the most commonly used ones. CUDA [22] has been developed by NVIDIA and currently supports only NVIDIA de-vices, while OpenCL [15] which has been developed by the Khronos Consortium can be executed on diverse platforms produced by different vendors. As far as we are concerned, CUDA is faster than OpenCL on NVIDIA devices. However, having in mind that our aim is to enable real-time pavement distress detection using common vehicles, OpenCL was used in this study because of the variety of hardware that it supports. Even if it is slower than CUDA, OpenCL offers a good trade-off between wide applicability and performance. For this reason, OpenCL was used in this study for the implementation of a parallel version of the textural feature extraction.
An OpenCL platform includes a single host (usually a CPU), which is connected to one or more devices (CPUs, GPUs or other processors). Functions written in the OpenCL C programming language and compiled with the OpenCL compiler [15] are defined on the host but executed on the device. These functions are called kernels. The host submits the kernels for execution on an OpenCL compliable device. An instance of the kernel is executed concurrently for each point in an index space. These instances are referred to as work-items and are organized into work-groups. The kernels operate on the values of memory objects. There exist different types of memory in Open-CL: host memory, global memory, constant memory, local memory, and private memory. Since host memory is visible only to the host, data has to be first transferred to a global memory buffer on the device. Global memory permits read and write access to all work-items in all work-groups, while local memory can only be accessed by work-items belonging to a specific work-group. However,
local memory access is in general much faster than global memory access.
2.4 Haralick features
Texture is an important characteristic in image analysis and contains information about the spa-tial distribution of tonal variations within an image. An exact definition of texture does not exist. Several scientists define texture depending on the purpose they need texture for, or on their ap-plications. Jain [14], for example, defines texture as repeating patterns of local variations in image intensity which are too fine to be distinguished as separable objects at the observed resolution. Texture analysis comprises texture classification, texture segmentation, and shape recovery from texture. We are particularly interested in texture classification, whereby the problem is identifying the given textured region from a given set of texture classes such as, for example, agricultural land, forest region or urban area [14].
Jain [14] distinguishes between three different types of texture analysis algorithms, namely model-based methods, structural methods, and statistical methods. While model-model-based and structural methods are useful when macrotextures need to be identified (i.e., when the texture primitives are large and it is first necessary to determine the shape and properties of the basic primitive), statistical methods facilitate the classification of microtexture. When microtexture is considered, the primitives are small. As this is the case with pavement images, statistical textural features were considered in our work.
Haralick features are the most commonly applied statistical textural features. With the aim of enabling texture classification, Haralick [10] has proposed a set of meaningful textural features for classification of pictorial data. By conducting several experiments, he has concluded that textural features have applicability for a wide variety of image-classification applications. The set consists of 14 textural features which can be extracted from a so-called gray-tone spatial-dependence matrix (or gray-level co-occurrence matrix).
Haralick assumes that an image is a set of resolution cells (i.e. pixels) and the classification of pictorial data can be performed either on a resolution cell basis or on a block of resolution cells. If a large block of resolution cells is observed, a procedure for extracting textural properties of
Fig. 1: Neighborhood of a resolution cell after [10].
these blocks is required. The procedure proposed by Haralick first computes a set of gray-level co-occurrence matrices (GLCMs) and then calculates textural features based on these matrices. The GLCM expresses the relationship between adjacent or nearest-neighbor pixels in an image. According to Haralicks notion, a pixel has eight nearest neighbors, as shown in Figure 1, where 1 and 5 are 0 degrees (horizontal) nearest neighbors to the pixel in the middle (*). Pixels 2 and 6 are 135 degrees (diagonal) nearest neighbors. Pixels 4 and 8 are 45 degrees nearest (diagonal) neighbors, and pixels 3 and 7 are 90 degrees (vertical) nearest neighbors to *. To calculate the GLCM, the numbers of all possible nearest-neighbor gray-tone pairs in an image are counted. In the gray level co-occurrence matrix each cell represents the number of occurrences of pixels with intensity a, which are 0 degree nearest neighbors to pixels with intensity b.
After calculating the GLCMs along all four directions for a certain image, textural features are extracted from these matrices. In total, 14 features have been suggested by Haralick. For each of these 14 features the range and the mean values for the four directions can be calculated, resulting in a total number of 28 features. However, in order to simplify the classification model and to enhance generalization by reducing overfitting, feature selection was conducted. Since [10] states that although we may have an intuitive expectation of what the textural features represent, this is a problem of a thorough experiment, the features that most appropriately characterize the pave-ment texture were chosen by evaluation. The feature selection was carried out using a third-party software tool [40]. For this purpose, pavement images which do not contain any distress were man-ually divided into several classes based on the visual evaluation of experts. After that, all Haralick
features were computed for all of the images. Since the publication [10] proposes the ranges and the mean values as features, in total 28 features were calculated for each image. The features were evaluated by measuring the information gain with respect to the class, which is calculated according to Equation 1:
Inf oGain(Class, Attribute) =H(Class)−H(Class|Attribute), (1)
where H is the information entropy.
Then, the features were ranked according to the information gain and we have found out that angular second moment, contrast, inverse difference moment, and entropy are the most significant features for pavement condition assessment. These features are defined by Equations 2, 3, 4, and 5respectively, where p(i, j) denotes the frequency with which two neighboring resolution cells sepa-rated by a certain distance occur on the image, one with gray tone i and the other with gray tone j.
Angular second moment (ASM):
f1=
X
i X
j
{p(i, j)}2 (2)
Contrast:
f2= Ng−1
X
n=0 n2
Ng
X
i=1
Ng
X
j=1 p(i, j)
with|i−j|=n (3)
Inverse difference moment (IDM):
f3=
X
i X
j
1
1 + (i−j)2p(i, j) (4)
Entropy:
f4=−
X
i X
j
p(i, j)log(p(i, j)) (5)
3 Research problem and objectives
Although diverse methods for pavement distress detection and evaluation have been presented in recent years, the majority of these research methods are not capable of detecting the deteriorating condition of various types of roads. Therefore, it is essential to develop methods for pavement dis-tress detection which are capable of distinguishing between different pavement types and adapting the pavement distress detection models appropriately.
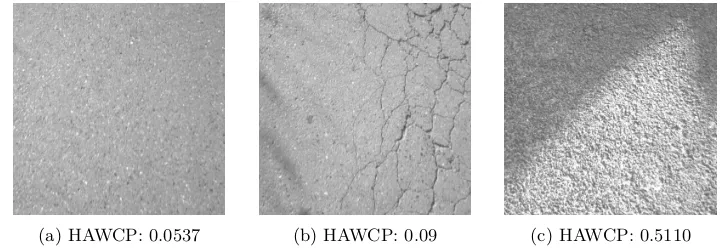
Figure 2presents some examples of images of healthy pavement with different texture. The wavelet-based descriptors for these images were calculated as described in [9] after pre-processing the images to correct the non-uniform background illumination. In Figure 2, the values of the wavelet de-scriptors for images containing cracks are presented. As can be seen, the high-amplitude wavelet coefficient percentage (HAWCP) value of the image in the middle which contains cracks is low-er than the HAWCP value of the good pavement image on the right, although it was expected that images containing distress should have higher HAWCP values than images of good pavement. Moreover, the HAWCP values for images (a) and (b) are very close to each other, despite of the fact that one of them contains distress and the other one does not. This indicates that the HAWCP value itself is not able to identify the presence of distress on images with different texture.
In addition, state-of-the-art methods for distress detection are, in general, applied to the
[image:9.595.102.463.445.569.2]pave-(a) HAWCP: 0.0537 (b) HAWCP: 0.09 (c) HAWCP: 0.5110
Fig. 2: Pavement images with different texture and corresponding wavelet descriptor values.
ment data (i.e. pavement images or sensor data) offline. The data is first stored persistently until it is actually processed, because the time required to execute the methods on the images usually
exceeds the time available for processing between two subsequent data acquisitions. As a result, a huge amount of data which may not indicate the presence of distress is stored. Thereupon, ap-proaches to detect the distress in real time and save only data which represents distress need to be investigated or developed.
To address the aforementioned issues and improve the already existing method, the following re-search questions need to be answered:
– How can we detect key indicators of deteriorating pavement condition on images of various types of pavement?
– How can we execute distress detection methods fast enough, so that real-time processing of the images is possible?
4 Methodology
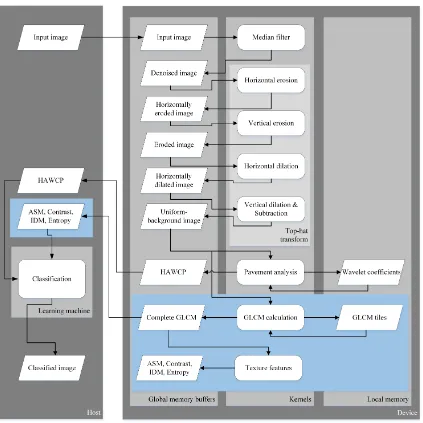
With the aim of improving the current pavement evaluation framework, textural features are incor-porated into an existing pavement distress detection methodology. An overview on the methodology is presented in Figure 3. First, the pavement images are pre-processed by applying a median fil-ter in order to remove noise. Then, another pre-processing step is performed, namely the top-hat transform is applied, to correct the non-uniform illumination in the images. As a result of the top-hat transform, shadow regions such as the one present on the right image in Figure 2 are corrected and misleading results are avoided. Afterwards, the wavelet transform of the images is computed and the high-amplitude wavelet coefficient percentage (HAWCP) is calculated.
The contribution of this paper is the blue part in Figure 3. In addition to the HAWCP value, textural features are calculated to enhance the classification performance. The textural features are used together with the HAWCP descriptor in order to generate a classification model. The clas-sification model is created based on training images which are manually labeled by experts. Then, the classification model is used to evaluate the presence of distress on new images in real-time.
Fig. 3: Overview on the pavement distress detection methodology.
5 Implementation
The GPU implementation of the proposed methodology is presented in Figure 4. Like in Figure 3, the parts of the implementation which are described in this paper in detail are presented with
Fig. 4: GPU implementation of the proposed methodology.
a blue background. The top-hat transform was implemented as a combination of separable erosion and dilation operations.
5.1 Gray Level Co-occurrence Matrix
The calculation of the GLMC matrix could be considered as an example of a histogram. In gener-al, a histogram is a representation of the distribution of numerical data [25]. The first step when calculating a histogram is to define the range of values and divide it into a set of intervals called bins. In the next step, the values which fall into each bin are counted. In the case of the GLCM, the values of the GLCM are the bins and the pairs of pixels with intensity a and b are the values which fall into these bins. Several implementations of histogram calculations on GPU have been proposed [27] [3] [37]. However, these implementations use local memory to store a histogram for each work-item. Then, a reduction operation is performed on the local histograms in order to combine them into a final histogram. Unfortunately, the size of the GLCM usually exceeds the available amount of local memory. For example, if we want to compute the GLCM for 256 pixel intensity values, the required local array would be of size 256x256 = 65,536 elements. If unsigned integers are used, the amount of memory is 65,536*32 bit = 2,097,152 bit = 256 KB. However, the size of the available local memory, for example on NVIDIA Kepler GPUs, is either 16KB or 48KB [21].
Therefore, we present another approach to compute the GLCM in parallel. The approach can also be adopted for computing other types of histograms. The idea of the implementation of the GLCM computation is to use multiple work-groups to compute different parts of the GLCM.
The approach is shown in Figure 5for a simple example with 2 work-groups (a blue work-group and a red one) and 4 work-items per work-group. The implementation is also based on local mem-ory. Since local memory access is much faster than global memory access, local memory is used to store partial GLCMs computed by different work-groups. Depending on the amount of available memory, the GLCM is split into tiles. The values belonging to the different tiles are calculated by the different work-groups. Each work-group processes the whole image by reading corresponding intensity values, but uses only one part of the GLCM. This means that different work-groups up-date different parts of the GLCM, so there are no race conditions between the work-groups. Yet, different work-items belonging to the same work-group may need write access to the same element of the GLCM tile, although they are reading different image elements. This is the case when, for example, two work-items process image pairs with the same intensity values. If these
work-items would try to increment the corresponding value of the GLCM tile at the same time, the result would be wrong due to race conditions. There exist two possible solutions to this problem. By using synchronization barriers we could account for correct results. However, this would lead to poor efficiency. The other opportunity is to use built-in atomic functions. The built-in atomic functions are uninterruptable and force the work-items to read and modify the value in sequence [32].
Fig. 5: Schematic of the GLCM implementation.
In order to better understand the implementation, consider the following simplified example, where the pixel values can be 0, 1, 2, or 3. We want to process an image of size 3x5 as presented in Figure 5. Two work-groups are used. Work-group 1 is responsible for the blue tile of the GLCM in Figure 5, while group 2 updates the values of the red GLCM tile. Each group contains 4 work-items. For simplicity, we assume that we want to calculate the horizontal (0 degree) GLCM of the image with distance 1, i.e. we are looking at the pairs of pixels which are direct horizontal neighbors to each other.
The kernel comprises several steps. First, a local memory array is created for each work-group. This local array stores the values of the corresponding part of the GLCM. For example, if the pixel values are between 0 and 255, the complete GLCM would have 65536 elements. If we use four work-groups, the local GLCM arrays would have a size of 65536/4 = 16384 elements. To initialize the local array, the values of the array elements are set to zero in parallel. For this purpose, each
work-item in the work-group iterates over work-group-sized pieces of the local GLCM array and sets the corresponding value to zero.
In the second step, the work-items iterate over their parts of the whole image and compute the GLCM. Here it is necessary to check if the current work-group is responsible for the GLCM cell. For this purpose, we check whether the position of the GLCM cell which we want to increment is within a certain range. For instance, in our example with the four work-groups the range of the first work-group would be 0 16383, the range of the second one would be 16384 32767, etc. After that, to increment the GLCM values, the OpenCL built-in functionatomic incis used. Then, following a synchronization barrier, the GLCM parts are copied to global memory.
5.2 Textural features
As can be seen from Equations 2, 3, 4, and 5, the calculation of the textural features is based on summation of the GLCM values. As a result, one and the same approach can be applied for the OpenCL implementation of the four features. Then, the implementation is modified according to the corresponding feature (e.g. we take the square of the values for the angular second moment). Summations are examples of the so-called reduction operations. They are called reduction opera-tions because a vector of data is reduced to a single element (e.g. the sum of the elements). Another example of a reduction operation is finding the maximum element of a vector.
AMD and NVIDIA have proposed several approaches to implement reductions on GPUs [2] [11]. The most intuitive approach is the tree-based approach, where the sums of pairs of elements are calculated. In this case, the vector which initially contained N elements is reduced to N/2 elements in the first step. The process continues recursively until the vector is reduced to a single element. However, the number of active work-items gets smaller with each reduction step, which results in poor SIMD efficiency (Single Instruction, Multiple Data). AMD and NVIDIA have observed better performance by applying two-stage reduction. The idea behind the two-stage reduction is that instead of parallelizing the reduction as much as possible, we combine sequential and parallel reduction.
The input array (which in our case contains all the GLCM values) is split into multiple chunks. Each work-item loops over its parts of the chunks and performs sequential reductions. In Figure 6,
the dark blue work-item computes sequentially the sum of all dark blue elements. Assuming that we have two work-groups (a blue work-group and a red work-group), all the work-items within a group perform the same operation as the dark blue work-item and they write their temporary re-sults into an array located in local memory. In the case with two work-groups, there exist two local arrays. Then, the local arrays are reduced to a single element with parallel tree-based reductions. At the end of these parallel reductions, each work-group writes its partial result into a global mem-ory array. When more than one work-group is required (i.e. when we have so many elements that they dont fit in a single work-group), it is necessary to perform one more reduction on the result to merge the partial results. For this purpose, a summation reduction kernel is invoked with the result array as input. The latter array is reduced by the kernel to a single element which contains the sum of all elements.
[image:16.595.124.450.345.488.2]At this point, we should note that programmers usually tend to implement algorithms in such
Fig. 6: Schematic of the textural features implementation.
a way that logically independent pieces of code are defined in different code fragments (e.g. in functions). If this programming paradigm is applied, each texture feature should be implemented in its own kernel. However, since more than one feature is required to accurately classify a texture, it is sensible to combine the computations of a set of features in one kernel. Thus, the performance of the implementation is further enhanced, because some instructions are performed once instead of four times.
6 Performance evaluation
To evaluate the performance of the proposed implementation, performance tests were carried out. The tests were performed on an Intel(R) Core(TM) i7-4600U CPU @2.10GHz and an NVIDIA Tesla C2070 GPU. To guarantee accurate measurements, the computational routine for the calculation of the gray level co-occurrence matrices and the four features is invoked 10,000 times. Then, the average execution time is used to deduct a conclusion on the performance enhancement.
A sequential C++ implementation and a GPU implementation are compared for performance evaluation. Costly operations which do not belong to the set of mandatory operations required to calculate the features were omitted when measuring the execution time in order to make sure that exactly the same set of operations is wrapped in all cases. For the performance evaluation the sequential C++ implementation was not runtime optimized and no processor-specific intrinsics were used. The OpenCL code was also a general one (i.e., it was not specifically optimized for the NVIDIA GPU) in order to provide a general intuition on the improvement which could be achieved by utilizing GPU. However, in practice better results could be obtained by optimizing the implementations for the specific hardware. For precise measurements of the OpenCL execution time, the OpenCL profiling functionality is utilized. When evaluating the performance of OpenCL it is recommended [13] to not only measure the kernel execution time, but to also take into account the time required to transfer data between the host and the device, i.e. the time to write the input values into the buffer and the time to read the result. The data transfer time and kernel execution time were tracked separately, because the GLCM stays in the device memory buffer and is used directly to compute the Haralick features. In this way, two data transfers are spared, because we also do not need to transfer GLCM data to the device for the Haralick features kernel. Hence, the OpenCL execution time is equal to the kernel execution time in the following subsections.
6.1 Performance evaluation GLCM
Figure7presents the results for the GLCM computation along all four directions (0, 45, 90 and 135 degrees) with the distance equal to 1 for images with a resolution of 256x256, 512x512, 1024x1024, and 2048x2048 pixels. To evaluate the performance results, the speed-up achieved by executing the
computations on GPU was calculated as defined in Equation 6.
Speed-up = Sequential execution time
OpenCL execution time (6)
[image:18.595.125.447.229.395.2]The speed-up is above 55 for all resolutions. In case of images of size 2048x2048, the speed-up is approximately 81. In all cases the OpenCL implementation is much faster than the sequential one.
Fig. 7: Comparison of the execution times of the different implementations of the GLCM compu-tation.
6.2 Performance evaluation textural features
The textural features were computed for a GLCM with 256x256 elements. The results of the test are presented in Table 1. The GPU execution of the implementation is approximately 1381 times faster than the sequential execution, which in average took 6.85 milliseconds.
Table 1: Time required to calculate the textural features.
Execution type Average time in ms Sequential C++ 6.85200
OpenCL 0.00496
[image:18.595.195.374.601.649.2]Table 2: Classification results
Correctly classified images in % Precision Recall False positive rate
Without textural features 69.4366 0.693 0.694 0.354
With textural features 95.3756 0.954 0.954 0.063
6.3 Overall performance
The total execution time includes the time required to transfer the image data from the CPU to the GPU, the execution time of the median filter, the top-hat transform, GLCM and textural features kernels, as well as the time needed to transfer the HAWCP value and the values of the textural features from the GPU to the CPU. As can be seen on Figure 8, the computation of the gray level co-occurrence matrices is the most costly one, followed by the transfer time of the image data. However, all these measurements depend strongly on the specific hardware. For example, the time required for data transfers is lower on integrated GPUs.
The total execution time using this hardware enables processing more than 240 frames per second.
Fig. 8: Total GPU execution time.
[image:19.595.121.448.446.586.2]7 Case study
To validate the pavement assessment approach, a passenger vehicle equipped with a camera and a GPS receiver was used to collect pavement images. Several road segments in Bochum and Witten, Germany were chosen for the case study. Different types of pavement surface as shown in Figure 1 were present on the roads. In total, 16,601 images were acquired using the camera, examples of which are shown in Figure 9. In contrast to the general idea of the approach to discard im-ages where no distress is detected, here all imim-ages were saved for validation purposes. 66% of the images were manually labeled as images of distress or of intact pavement and were used as train-ing data for a machine learntrain-ing algorithm. In order to test the classification accuracy of different machine learning algorithms, a third-party machine learning workbench was utilized. Using the data obtained for the case study, several classification algorithms were preliminary tested, namely Support vector machines, Multilayer perceptron and Rotation forest. The Waikato Environment for Knowledge Analysis (WEKA) [40] provides implementations of these algorithms. The results implied that Rotation forest is the most appropriate algorithm among the tested ones. However, future research may include validating with variety of machine learning algorithms and fine tuning classification parameters in order to further improve the classification performance of the approach presented in this paper. In addition, the classification of single instances will also be implemented on GPU to reduce the time required to classify a new image.
Rotation forest is an ensemble classifier based on decision trees. In the implementation that we adopted, the C4.5 decision trees [28] are used. Rotation forest splits the feature set (i.e., the set of the HAWCP and mean and range values of ASM, contrast, IDM and entropy) into subsets and principal component analysis is applied to each subset. Then, the algorithm reassembles a new ex-tracted feature set and transforms the training data into the new features. Based on these features, ten decision tree classifiers are trained. At the end, Rotation forest combines the outputs of the classifiers and calculates the probability assigned to an instance by using an average combination method. Rotation Forest [30] was used to generate a classification model based on the training images and classify the remaining 34% of the images.
(a) (b) (c) (d) (e)
Fig. 9: Examples of images obtained for the case study.
In order to evaluate the improvement of the approach, the results of the classification before and after incorporating textural features were compared. The results are presented in Table 2in terms of the percentage of correctly classified images, precision, recall, and false positive rate.
The results show that a significant improvement of the classification is achieved by incorporating textural features. The percentage of the correctly classified images when using textural features is approximately 27% higher than the one without using textural features, while the false positive rate is significantly lower. For example, images, such as the one on Figure2care correctly classifed as not containing distress. Table 3presents additional examples of images, which were classified differently with and without using textural features. WEKA associates probabilities with the predictions. The probabilities assigned to these images are also presented in Table 3. As can be seen, the classificator assigns higher probabilities to the correct category when textural features are used than without them. The first of the images is classified incorrectly when textural features are not employed. However, approximately 5% of the images were still classified incorrectly. These were
Table 3: Images classified differently with and without textural features.
Distress probability without texture 41% 22% 51%
No distress probability without texture 59% 78% 49%
Distress probability with texture 79% 5% 79%
No distress probability with texture 20% 95% 21%
[image:21.595.72.503.522.649.2]mainly images of very small cracks (Figure9b) present on an extremely rough pavement surface. Images that illustrate this issue are shown in Figure 10. To compensate these errors, further methods for pavement distress detection could be implemented and the results could be combined. Nevertheless, combined with the textural features, HAWCP is a reliable pavement distress detection feature in most cases. If it was omitted and only textural features were considered, a detection of distress in the images would still be possible due to the impact of distress on texture in the images. Yet, the detection would not be as accurate as when a combination of the HAWCP and textural features is used. Moreover, although the HAWCP value is a good indicator of the type of the distress as presented by Zhou [42], it does not give any precise information about the type and the extent of the distress. To this end, methods specifically developed to classify the distress could be incorporated. Nevertheless, the methodology and implementation presented here could be applied to roughly define the condition of the pavement surface in order to reduce the amount of data which has to be processed by more complicated and compute-intensive algorithms.
Fig. 10: Incorrectly classified pavement images.
8 Conclusions
Pavement condition assessment is a key component of road maintenance programs. In current prac-tice, pavement images and data are collected by vehicles equipped with cameras and sensors in order to enable autonomous pavement distress detection. However, the collected data and images are usually processed offline. The authors have previously proposed a methodology and implemen-tation of a pavement distress detection system which is capable of processing pavement images in
real time. Yet, although good results have been achieved, the methodology could be improved by incorporating textural features.
In this paper, an implementation of Haralick textural features was presented. As a preliminary step, a new approach towards comuting gray-level co-occurrence matrices was proposed and implement-ed. The implementation is based on the Open Computing Language (OpenCL). To evaluate its performance, the OpenCL implementation was compared against a sequential C++ implementa-tion of the textural features. The results show that a significant improvement in terms of speed-up was achieved. Moreover, by incorporating textural features, better classification results were ob-tained than without using them, as proved by conducting a case study.
The achieved execution time enables real-time processing and analysis of various pavement images. As a result, the amount of data stored for offline processing as well as the costs for pavement con-dition assessment is reduced.
Future research and development may include considering other issues related to pavement con-dition assessment. For example, methods for calculating more accurate distress positions than the ones provided by single GPS receivers will be investigated. In addition, the classification into different types (cracks, potholes, etc.) is currently in the development phase. The results of this subsequent classification, which is performed offline, could be used as a form of feedback for the rough classification. As a result, the already generated rough classification model could be improved by updating the predictor dynamically.
Acknowledgements The authors gratefully acknowledge the support of this ongoing project by the German Research Foundation (DFG) under grant KO4311/2-1.
References
1. Amamra, A. and Aouf, N. [2014], ‘GPU-based real-time rgbd data filtering’, Journal of Real-Time Image Processingpp. 1–18.
2. AMD [2014], ‘OpenclTMoptimization case study: Simple reductions’. accessed on November 09, 2015. URL: http: // developer. amd. com/ resources/ documentation-articles/ articles-whitepapers/
opencl-optimization-case-study-simple-reductions/
3. Banger, R. and Bhattacharyya, K. [2013], OpenCL Programming by Example, Packt Publishing Ltd., Birmingham, UK.
4. Cafiso, S., D. G. A. and Battiato, S. [2006], Evaluation of pavement surface distress using digital image collection and analysis,in‘Seventh International Congress on Advances in Civil Engineering’.
5. Fang, C., Z. L. and Li, Y. [2014], ‘Images crack detection technology based on improved k means algorithm’,9, 822–828.
6. Federal Highway Administration [n.d.], ‘Preventive maintenance: Project selection - right road, right treatment, right time - federal highway administration - video vh-411’.
7. Federation of Canadian Municipalities and National Research Council [2003], ‘Timely preventive main-tenance for municipal roads — a primer, issue no 1.1’.
8. Gaster, B. R., Howes, L., Kaeli, D., Mistry, P. and Schaa, D. [2013], Heterogeneous Computing with OpenCL: Revised OpenCL 1.2 Edition, Morgan Kaufmann Publishers Inc., San Francisco, CA, USA. 9. Georgieva, K., Koch, C. and K¨onig, M. [2015], Wavelet transform on multi-GPU for real-time pavement
distress detection, in ‘Proceedings of the 2015 ASCE International Workshop on Computing in Civil Engineering’, Austin, USA.
10. Haralick, R., Shanmugam, K. and Dinstein, I. [1973], ‘Textural features for image classification’,IEEE Transactions on Systems, Man and Cybernetics3(6), 610–621.
11. Harris, M. [2007], ‘Optimizing parallel reduction in CUDA’. accessed on November 09, 2015.
URL:https: // docs. nvidia. com/ cuda/ samples/ 6_ Advanced/ reduction/ doc/ reduction. pdf
12. Huang, Y. and Xu, B. [2006], ‘Automatic inspection of pavement cracking distress’,15.
13. Intel Corporation [2013], ‘IntelR SDK for OpenCL* Applications 2013 R2 Optimization Guide, Doc-ument Number: 326542-003US’.
14. Jain, R., Kasturi, R. and Schunck, B. [1995],Machine vision, McGraw-Hill.
15. Khronos OpenCL Working Group [2013], ‘The opencl specification, version: 2.0. document revision 19’.
16. Koch, C., Georgieva, K., Kasireddy, V., Akinci, B. and Fieguth, P. [2015], ‘A review on computer vision based defect detection and condition assessment of concrete and asphalt civil infrastructure’, Advanced Engineering Informatics29, 196 210.
17. Kumar, P., Singhal, A., Mehta, S. and Mittal, A. [2013], ‘Real-time moving object detection algorithm on high-resolution videos using GPUs’,Journal of Real-Time Image Processingpp. 1–17.
18. Li, L., S. L. N. G. and Tan, S. [2014], ‘Automatic pavement crack recognition based on bp neural network’,26, 11–22.
19. Melo, R., Falcao, G. and Barreto, J. P. [2012], ‘Real-time HD image distortion correction in heteroge-neous parallel computing systems using efficient memory access patterns’,Journal of Real-Time Image Processingpp. 1–9.
20. Moussa, G. and Hussain, K. [2011], A new technique for automatic detection and parameters estimation of pavement crack,in‘4th International Multi-Conference on Engineering Technology Innovation (IMETI 2011)’.
21. NVIDIA Corporation [2014], ‘NVIDIA’s Next Generation CUDA Compute Architecture: Kepler GK110/210, Whitepaper, V. 1.1.’.
URL:http: // international. download. nvidia. com/ pdf/ kepler/ NVIDIA-Kepler-GK110-GK210-Architecture-Whitepaper.
22. NVIDIA Corporation [2015], ‘CUDA zone’. Accessed 11.06.2015.
URL:https://developer.nvidia.com/cuda-zone
23. Oliveira, H. and Correia, P. [2013], ‘Automatic road crack detection and characterization’,14. 24. Owens, J. D., Luebke, D., Govindaraju, N., Harris, M., Kr¨uger, J., Lefohn, A. E. and Purcell, T. J.
[2005], A survey of general-purpose computation on graphics hardware, Technical report, Eurographics, State of the Art Reports. pp. 21-51.
25. Pearson, K. [1895], ‘Contributions to the mathematical theory of evolution. ii. skew variation in ho-mogeneous material’, Philosophical Transactions of the Royal Society A: Mathematical, Physical and Engineering Sciences186, 343414.
26. Perrot, G., Domas, S., Couturier, R. and Bertaux, N. [2013], ‘Fast GPU-based denoising filter using isoline levels’,Journal of Real-Time Image Processingpp. 1–12.
27. Podlozhnyuk, V. [2007], ‘Histogram calculation in CUDA’. Accessed on 07.12.2015.
URL: http: // developer. download. nvidia. com/ compute/ cuda/ 1. 1-Beta/ x86_ website/
projects/ histogram64/ doc/ histogram. pdf
28. Quinlan, J. R. [1993], ‘C4.5: programs for machine learning’.
29. Radopoulou, S. and Brilakis, I. [2014], Improving patch distress detection using vision tracking on video data,in‘Proceedings of the 21st International Workshop on Intelligent Computing in Engineering’. 30. Rodriguez, J. J. and Kuncheva, L. I. [2006], ‘Rotation forest: A new classifier ensemble method’,IEEE
Transactions on Pattern Analysis and Machine Intelligence28(10), 1619–1630.
31. Salman, M., M. S. K. K. and Rahman, M. [2013], Pavement crack detection using the gabor filter,in ‘16th International IEEE Conference on Intelligence Transportation System (ITSC 2013)’, p. 20392044. 32. Scarpino, M. [2012],OpenCL in Action, Manning Publications, Shelter Island, USA.
33. Smistad, E. and Lindseth, F. [2014], ‘Multigrid gradient vector flow computation on the GPU’,Journal of Real-Time Image Processingpp. 1–9.
34. Subirats, P., D. J. L. V. and Barba, D. [n.d.], Automation of pavement surface crack detection using the continuous wavelet transform,in‘International Conference on Image Processing, Atlanta, USA’. 35. Tanaka, N. and Uematsu, K. [1998], A crack detection method in road surface images using morphology,
in‘IAPR Workshop on Machine Vision Applications, Makuhari, Japan’.
36. Tarabalka, Y., Haavardsholm, T. V., K˚asen, I. and Skauli, T. [2009], ‘Real-time anomaly detection in hyperspectral images using multivariate normal mixture models and GPU processing’, Journal of Real-Time Image Processing4(3), 287–300.
37. Tay, R. [2013],OpenCL Parallel Programming Development Cookbook, Packt Publishing Ltd., Birm-ingham, UK.
38. Varadharajan, S., J. S. S. K. W. L. and Mertz, C. [2014], Vision for road inspection,in‘Proceedings of WACV 2014: IEEE Winter Conference on Applications of Computer Vision’.
39. Vivekanandreddy Navaneetha, D., K. A. . S. [2014], ‘Hough transforms to detect and classify road cracks’,3.
40. Witten, I. H., Frank, E. and Hall, M. A. [2011],Data Mining: Practical Machine Learning Tools and Techniques, third edition edn, Elsevier Inc.
41. Yu, X. and Salari, E. [2001], Pavement pothole detection and severity measurement using laser imaging, in‘IEEE International Conference on Electro/Information Technology (EIT), Mankato, USA’.
42. Zhou, J., Huang, P. and Chiang, F.-P. [2006], ‘Wavelet-based pavement distress detection and evalua-tion’,Optical Engineering45(2).
43. Zou, Q., C. Y. L. Q. M. Q. W. S. [2012], ‘Cracktree: automatic crack detection from pavement images’,
33, 227238.
![Fig. 1: Neighborhood of a resolution cell after [10].](https://thumb-us.123doks.com/thumbv2/123dok_us/8599720.372315/7.595.200.364.98.222/fig-neighborhood-resolution-cell.webp)