Review Copy
Effect of non-uniform reactor cooling on fracture and
constraint of a reactor pressure vessel
Journal: Fatigue & Fracture of Engineering Materials & Structures Manuscript ID FFEMS-7296.R1
Manuscript Type: Original Contribution
Date Submitted by the Author: 22-Jan-2018
Complete List of Authors: Qian, Guian; Paul Scherrer Institute, Nuclear Energy and safety Niffenegger, Markus
Sharabi, M. Lafferty, N.
Keywords:
reactor pressure vessel, Stress intensity factor, constraint effect, pressurized thermal shock, probabilistic fracture mechanics, Crack propagation
Review Copy
3. Non-uniform cooling effects increases fracture frequency by 2 orders of magnitude
4. Probabilistic fracture mechanics method predicts a less conservative result
Review Copy
Effect of non-uniform reactor cooling on fracture and constraint of
a reactor pressure vessel
Guian Qian1,*, Markus Niffenegger1, Medhat Sharabi2, 3, Nathan Lafferty2
1*Correspondent, Paul Scherrer Institute, Nuclear Energy and Safety Department, Laboratory
for Nuclear Materials, Villigen PSI, Switzerland, guian.qian@psi.ch
2Paul Scherrer Institute, Nuclear Energy and Safety Department, Laboratory for Thermal
Hydraulics, Villigen PSI, Switzerland
3
Mansoura University, 35516 Mansoura, Egypt
Review Copy
Effect of non-uniform reactor cooling on fracture and constraint of a reactor pressure vessel
Abstract
In the lifetime prediction and extension of a nuclear power plant, a reactor pressure vessel (RPV) has to demonstrate the exclusion of brittle fracture. This paper aims to apply fracture mechanics to analyze the non-uniform cooling effect in case of a loss-of-coolant accident (LOCA) on the RPV integrity.
A comprehensive framework coupling reactor system, fluid dynamics, fracture mechanics and probabilistic analyses for the RPVs integrity analysis is proposed. The safety margin of the allowed RTNDT is increased by
more than 16 °C if a probabilistic method is applied. Considering the non-uniform plume cooling effect increases KI more than 30%, increases the failure frequency by more than one order of magnitude, and increases
the crack tip constraint due to the resulted resulting higher stress. Thus, in order to be more realistic and not to be non-conservative, 3D CFD may be required to provide input for the fracture mechanics analysis of the RPV.
Keywords: reactor pressure vessel; stress intensity factor; constraint effect; pressurized thermal shock; probabilistic fracture mechanics; crack propagation
Nomenclature
a = crack depth, mm
b0, b1, b2 and b3 = coefficients for the polynomial approximation of stress Fα(x) = crack-tip functions
H(x) = Generalized Heaviside function
h(x,a) = weight function for stress intensity factor
i0, i1, i2 and i3 = influence coefficients for the approximation of stress intensity factor I = set of all nodes in the mesh
KI = Mode I linear elastic stress intensity factor, MPa·m0.5 KIc = material fracture toughness, MPa·m0.5
KIa = crack arrest toughness, MPa·m0.5
Mm = free-surface correction for membrane stress Mb = free-surface correction for bending stress Ni(x) = nodal shape function
P = fracture probability
Review Copy
P(F│E)i = conditional failure probability of vessel due to the ith transient Q = crack shape correction factor for stress intensity factor calculation RTNDT = nil-ductility transition reference temperature, °C
ti = transient time, minute T = temperature, °C
T-stress = second term of William’s solution, MPa
ui = standard DOFs of node i
σ = stress, MPa
σm = membrane stress, MPa σb = bending stress, MPa
ϕ(E)i = occurrence frequency of the transient
CFD = computational fluid dynamics DOF = degree of freedom
ECC = emergency core cooling FEM = finite element method HTC = heat transfer coefficient
LBLOCA = large break loss-of-coolant accident MBLOCA = medium break loss-of-coolant accident MC = Monte Carlo
PTS = pressurized thermal shock RCP = reactor coolant pumps RPV = reactor pressure vessel SIF = stress intensity factor SIP = safety injection pumps
SBLOCA = small break loss-of-coolant accident TWCF = through-wall cracking frequency WPS = warm prestressing
XFEM = extended finite element method
Review Copy
1. Introduction
The reactor pressure vessel (RPV) in a nuclear power plant is not replaceable and thus its integrity determines the lifetime of the nuclear power plant. During the operation of the plant, the integrity of RPV should be assured, and the brittle failure of the RPV should be excluded [1-22]. A critical loading for a RPV is pressurized thermal shock (PTS), i.e. rapid cooling of sections of the hot and still pressurized RPV by injection of cold emergency coolant, which is the resulted by of the loss-of-coolant accidents [1-3]. During a PTS, thermal gradients are leading to high stress in the RPV wall. On the other hand, the RPV material ages with neutron embrittlement and is susceptible to brittle fracture. Brittle fracture initiated by postulated or existing cracks may occur under PTS loading and this is generally considered to be the major threat to RPV integrity. Thus, the PTS analyses has to be performed and updated during operation according to the crack driving force and aged material property. The physical model for the integrity analysis of a RPV is shown in Fig. 1a. The assessment results can be used in the frame of the lifetime prediction and license renewal of a plant.
The integrity analysis of the RPV is generally conducted according to fracture mechanics methods. In a deterministic way, as applied in European countries [3], the analysis is performed for a fixed crack and material property. In the analysis, the stress intensity factors (SIFs) KI of postulated cracks are compared with fracture
toughness KIc. A component is regarded as safe if the calculated SIF is lower than KIc. In contrast, probabilistic
assessment [3, 8, 9] considers distribution functions of crack parameters and material properties and provides a more rational result with consideration of uncertainties. In the probabilistic analysis the concerning relevant parameters are considered as random following a certain distribution function. In a Monte Carlo (MC) calculation the random parameters are varied and thousands of deterministic analyses are performed. The probability for a component failure is simply the ratio between the failure resultscases resulting in failure and the total number of calculations. The flowchart of a probabilistic analysis is shown in Fig. 1b.
A comprehensive integrity analysis includes the reactor system analysis, fluid dynamics analysis, structural mechanics analysis, fracture mechanics and probabilistic analyses, as shown in Fig 1c. Firstly, the accident scenario is simulated with a nuclear system code like RELAP5 [23] in order to obtain the pressure and temperatures distributions in the RPV for the whole transient. However, RELAP5 assumes axisymmetric temperature distribution and neglects non-uniform cooling caused by cooling plumes due to the mixing of hot and cold water. In order to consider this non-uniform cooling effect, 3D computational fluid dynamics (CFD) simulations are performed [24], which provides temperature distribution for the fracture mechanics calculations. Besides the 3D CFD calculations, an analytical method to consider the local effect of cooling plumes is achieved by the code GRS-MIX [26], which uses an empirical model to calculate the local heat transfer
Review Copy
coefficients (HTC) and water temperatures. Both structural and fracture mechanics analyses are performed with the finite element method (FEM). However, if the loading conditions and geometry are simplified as one-dimensional, fracture mechanics analysis can be performed by FAVOR [6], which is based on analytical formulas for the calculation of SIFs of cracks in axi-symmetrically loaded cylinders. This code is also a probabilistic tool that calculates crack initiation and failure probabilities based on the MC simulations. The parameters transfer between the numerical models is shown in Fig. 1c. It should be pointed out that RELAP5 only provides axisymmetric results, whereas CFD and GRS-MIX consider this non-uniform effect.
Due to the significance and nuclear safety, a lot of work has been done concerning the safety assessment of RPVs under accident scenarios [1-22]. Both deterministic and probabilistic integrity analysis of a RPV subjected to PTS transients considering uniform RPV cooling have been performed by linear elastic (LEFM) and elastic-plastic fracture mechanics (EPFM) [1-5, 13, 16-22]. A review of the procedures, methods and computer codes for the RPV integrity assessment is given in [18]. Probabilistic assessment is performed for a RPV subjected to small break loss-of-coolant accident (SBLOCA) and medium break loss-of-coolant accident (MBLOCA) transients [19, 22]. A plastic correction factor has been introduced for the underclad crack in the PTS calculations [14]. Applying the material toughness obtained from small specimen to the large RPV has been an important topic. The constraint effect of a shallow crack tip on the fracture toughness during a transient has been analyzed in [2, 10, 12]. González-Albuixech et al. [21] used extended finite element method (XFEM) for the fracture mechanics calculation of the RPV containing different types of cracks. The advantage of XFEM in modeling a crack in complicated structure is demonstrated. Recently, research work has been given on the effect of PTS-loadings caused by the nonuniform temperature distribution due to cold water plumes. Some engineering codes, e.g. KWU-MIX, REMIX and GRS-MIX, have been developed based on analytical methods to determine the thermal-hydraulic process of the emergency cooling water from the injection location to the position in the downcomer [3, 23-25].
This paper aims to apply fracture mechanics method for a comprehensive assessment of a RPV. A probabilistic analysis is performed and the non-uniform cooling effect in the RPV is analyzed. The PTS transients are analyzed with RELAP5 [23], GRS-MIX [26] and CFD methods [24]. SIF of the postulated cracks and T-stress are calculated to quantify the crack driving force and the constraints of the crack tip. Based on the calculations, the safety margin of the RPV is calculated in terms of RTNDT, the nil-ductility transition temperature. The first
part of this paper is an introduction, followed by the transient calculation by RELAP5, GRS-MIX and CFD. The third part is structural mechanics and fracture mechanics analyses. The fourth part is deterministic and
9
Review Copy
probabilistic fracture mechanics analyses. The fifth and sixth parts are the safety margin definition of maximum RTNDT according to deterministic and probabilistic methods.
2. PTS loading transient calculations
2.1 Transients calculations by RELAP 5
A RELAP5 [23] model, developed at Paul Scherrer Institute to simulate loss of coolant accidents for a reference two-loop pressurized water reactor (PWR), was used assuming a break in the hot leg piping. The emergency core cooling system (ECCS) includes high pressure injection pumps capable of injecting cold water into both cold legs and, in addition, two accumulators, one per cold leg which are actuated when the pressure decreases to intermediate values.
Break sizes of 3, 70 and 450cm2 in the hot leg are simulated. The three transients correspond to SBLOCA, MBLOCA and large break loss-of-coolant accident (LBLOCA) transients. The output from the RELAP5 calculations, i.e. the fluid temperatures at the RPV core, fluid pressures and the HTC between the coolant and the RPV wall, are used as initial and boundary conditions input for the GRS-MIX, CFD calculations, and for the structural and fracture mechanics calculations. The transients calculated by RELAP 5 are shown in Figs. 2a, 2b and 2c.
2.2 Transients calculations by GRS-MIX
RELAP5 and other similar system codes can predict integral behavior of the reactor during transients and give predictions of relevant variables fairly well without the need of high computational resources. Nevertheless, these methods fail to predict local effects and three-dimensional phenomena such as those taking place during PTS. It is therefore needed to adopt other methods that are more accurate and also computationally efficient. Within this framework, GRS-MIX is used which is a software developed by GRS (Gesellschaft für Anlagen- und Reaktorsiherheit). The code has a number of implemented engineering correlations and the relevant correlations can be used based on the estimated flow regime. The output of the code gives the temperatures and heat transfer coefficients at the prescribed positions downstream in the downcomer.
The dedicated engineering code GRS-MIX [26] is used in order to study the break sizes that rangeranging from small to large break LOCAs which is not feasible with CFD due the large computational resources needed to conduct these simulations. The engineering correlations implemented in this GRS-MIX were developed based on the experimental data obtained from the UPTF test facility [26]. The Froude number is used to specify the flow conditions in the cold leg which can be either stratified or counter-current flow. A modified Dittus-Boelter equation based on the UPTF data is adopted to calculate the heat transfer coefficient using the plume parameters. The velocity inside the plume is calculated from the Chen and Chen correlation [27]. The input data
Review Copy
needed for GRS-MIX such as cold water injection mass flow rate, the temperature of the back flow in the cold and the temperature outside the plume are all obtained using approximation of RELAP5 results. For the heat transfer coefficient outside the plume, the experimental data showed that, it can be approximated with a constant value of 1500 W/m2.K independent of the injection flow rate.
The results of the coolant temperature and the heat transfer coefficient for different break sizes using GRS-MIX are shown in Figs. 2d and e. By comparing with the results from RELAP5 in Figs. 2a and b, it can be observed that the water temperature is significantly colder and the HTC changes substantially inside the plume. It should be considered that data obtained for the PTS analyses using GRS-MIX are subjected to several sources of uncertainties due to difference in the geometry between the UPTF test facility and the RPV adopted in the current study. In addition, the input data for GRS-MIX is based on temperatures from RELAP5 which is one-dimensional and averaging approximations were adopted. This proves that CFD calculations, though time-consuming, but they areare necessary to fairly represent the details of the mixing phenomena and cooling in the downcomer. Also, different thermal-hydraulic conditions like asymmetric cold water injections and injection of cold water at two different locations in the same cold leg contribute to uncertainties regarding validity of GRS-MIX correlations when applied to different problem configurations than those developed for.
2.3 Transients calculations by CFD
ANSYS FLUENT 16.0 is used in the analyses made using CFD methods in order to predict the three-dimensional behavior of the flow in the cold leg and plume oscillation in the downcomer. The best practice guidelines for application of CFD in nuclear safety [24] are followed in the present analyses. All relevant geometrical details of the RPV are considered in the CFD model including: injection pipes, inlet nozzles and curvatures and the neutron shield located in the downcomer which have strong impact on the flow development in the downcomer. In order to study mesh sensitivity of the results, two meshes were constructed using fully structured mesh topology with 3.3 and 5.1 million nodes. Special attention was taken to have more refinement in locations of the plumes and cold legs where injection of cold water is expected. No significant differences of the plume behavior or temperature distributions were noticed for the case of higher mass flow rate injection of cold water. All the simulations in the current study were conducted making use of the finer mesh shown in Figs. 3a and b. Further details about mesh strategy adopted in the present study can be found in [28].A fully structured mesh of 5.1 million nodes is created as shown in Figs. 3a and b and the mesh sensitivity study showed insignificant change in the results when the simulations were repeated with different meshes. The SST k-ω model is used to model the turbulence and the y+ for the first node beside the wall is around 100. Second order discretization schemes are adopted for the convection and transient terms in the governing equation.
Review Copy
The initial and boundary conditions are obtained from the accident analyses made using RELAP5 for two break scenarios in the hot leg; an SBLOCA of 3 cm2 and a MBLOCA of 70 cm2. For the SBLOCA, the high pressure
Safety Injection Pumps (SIP) inject emergency cooling water of 12 kg/s and temperature of 30 °
c
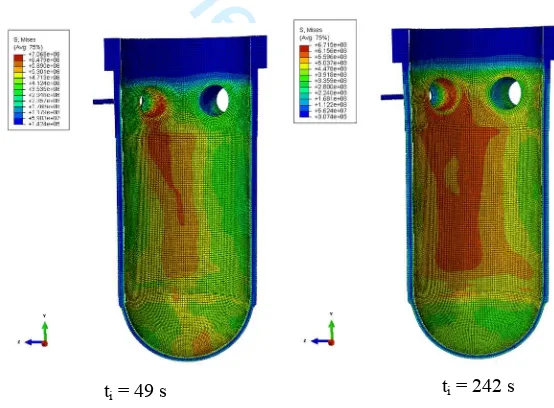
in each of the cold leg, while the pressure remains at a high value of 9.8 MPa after an initial decrease following the break. On the other hand, for the MBLOCA, following the initiation of SIP injection, the accumulators inject cold water of 200 kg/s and 10oC. A sSimulation times of 2500 s and 800 s were performed used for the SBLOCA andMBLOCA scenarios, respectively. Figs. 3c and d show contours of temperature on the RPV walls at two different instants for the two scenarios. The results show the temperature stratification at the inlet nozzles, . This is especially evident for the SBLOCA case the thermal stratification prevails in cold leg due to the lower injection mass flow rate,rate; however, the temperature gradients for the MBLOCA case are larger. The figures also confirm the highly three-dimensional behavior of the plume cooling in the downcomer and the importance of the detailed CFD simulation to precisely capture these phenomena.
3. Structural mechanics and fracture mechanics analyses validation
Based on the output of RELAP5 and GRS-MIX, the thermal mechanical and fracture mechanics analysis is performed by FAVOR, whereas the thermal mechanical analysis based on CFD results is performed using the FEM by ABAQUS v 6.14 [2829]. RELAP5 and GRS-MIX outputs are one-dimensional, meaning that the calculated coolant temperature, pressure and heat transfer coefficient are uniform in the inner vessel wall and they only vary with the transient time. However, the output with 3D CFD models is non-uniform in the vessel wall. In the FAVOR code, it is assumed that the coolant is uniform in the inner vessel wall and FAVOR is thus not able to capture the non-uniform cooling effect. 3D XFEM is resorted to analyze the non-uniform cooling effect on KI.
The beltline region, which is the most irradiated part of the RPV, is modeled by the 3D FEM. The inner side of the RPV is assumed to be subjected to a thermal shock caused by the falling plume of emergency cooling water. The time dependent 3D temperature distribution in the RPV calculated in the preceding CFD simulation, which defines the cooling effect and the thermal loads, is interpolated onto the finite element mesh. The finite element mesh is built using quadratic hexahedron elements to facilitate the interpolation of temperatures taken from the CFD mesh. Figs. 3c-3f show the temperature and stress distributions of the vessel during the SBLOCA and MBLOCA. Material mechanical properties are described in [1, 2, 18-22]. About 800 seconds of the MBLOCA and 2500 seconds of SBLOCA transients are calculated, which correspond to the most relevant time for PTS analysis. The results of the mechanical model are used as input for the fracture mechanics analysis in the next
Review Copy
part; furthermore a probabilistic assessment will be performed based on the structural and fracture mechanics analyses.
In LEFM analysis, KI is calculated. Two methods are used in this paper for KI computation:,i.e. the weight
function method (influence function method) implemented in the FAVOR code and the interaction integral (domain integral) implemented in the FEM (or XFEM) frameworks. The weight function procedure developed by Bückner [2930] is an analytical method for the determination of SIFs based on FEM. If the weight function is known for a crack in a component, the SIF can be obtained by multiplying this function by the stress distribution and integrating it along the crack length.
In the FAVOR code [6], SIF is calculated by the influence function method, as listed in Eqs. (1) and (2). The SIF of surface cracks is written as
2 3
0 0 1 1 2 2 3 3
π
= + + +
I
a
K b i b i a b i a b i a
Q . (1)
The coefficients i0, i1, i2, i3, are calibrated by the FEM. b0, b1, b2 and b3 are coefficients for the polynomial
approximation of stress, a is the crack depth, Q is the crack shape correction factor.
For an embedded crack, stress distribution is based on the resolution of nonlinear applied stresses through the RPV wall thickness into the linear superposition of approximate membrane and bending stress components. KI
is expressed as
(
)
π σ σ
= +
I m m b b
a
K M M
Q . (2) Mm is free-surface correction for membrane stress, Mb is free-surface correction for bending stress, σm is
membrane stress, and σb is bending stress.
In FEM, the SIF is normally calculated by interaction integral or domain integral which is implemented in the commercial software Abaqus. The modeling of a 3D crack in FEM, as shown in Fig. 4a, takes many efforts. The XFEM, which enriches the finite element approach approximation space with special functions that are able to describe the discontinuity and introduce the singular behavior of the crack front, makes the modeling of the crack easier and the results somehow more independent of the mesh [3031]. In XFEM, the displacement field is approximated by:
4
1 ( ) ( ) ( ) ( ) ( ) α( ) α
α
∈ ∈ ∈ =
= + +
∑
∑
∑
∑
uXFEM x i x ui ix x ai ix x bi
i I i J i K
N N H N F , (3)
where I is the set of all nodes in the mesh, Ni(x) are the classical shape function and ui are the standard DOFs of
node i (ui represents the physical nodal displacement for non-enriched nodes only). The subsets J and K contain
Formatted: Swedish (Sweden)
Review Copy
the nodes enriched with the Generalized Heaviside function H(x) or the crack-tip functions Fα(x), respectively, and ai, biα are the corresponding DOFs. Mesh details of an axial surface crack in the ring and nozzle regions
with represented using XFEM are shown in Figs. 4b and 4c.
Material fracture toughness is based on different databases for the RPV steels, e.g. ASME method [3132], FAVOR model, Master Curve method [3233], etc. According to ASME [3132], the fracture toughness is calculated by
(
)
36.5 22.78exp 0.036
= + −
IC NDT
K T RT ,
(
)
36.5 22.78exp 0.036
= + −
IC NDT
K T RT . (4)
The neutron irradiation effect is considered in RTNDT.
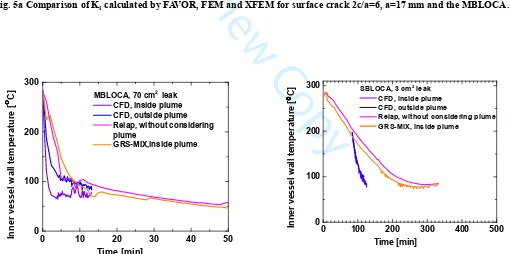
As part of the quality assurance, the SIF calculated by FAVOR, FEM, XFEM are compared for a surface crack subjected to MBLOCA, as shown in Fig. 5a. An axial semi-elliptical crack, which has the depth of 17 mm and aspect ratio (length/depth) of 6 is postulated in the deterministic analysis. The crack geometry is according to German KTA rule, which is consistent with the two times nondestructive examination limit. The variation of SIF with temperature is due to the thermal gradient formed in the vessel wall and the variation of pressure history with transient time. A general agreement is achieved among the used methods. The meshes and modeling for FEM and XFEM are shown in Figs. 4a, 4b and 4c. The results calculated from FAVOR, FEM and XFEM are in reasonable agreement.
4. Deterministic and probabilistic fracture mechanics analyses
4.1Deterministic fracture mechanics analysis
4.1.1 KI calculations
The temperature of MBLOCA and SBLOCA transient with and without considering non-uniform cooling calculated by CFD, GRS-MIX and RELAP5 are compared in Fig. 5b and 5c. Obviously the vessel wall temperature within the plume region is lower than that outside, especially for MBLOCA. The CFD calculation (Fig. 5c) shows that in case of a SBLOCA, almost no difference between temperatures in and outside the cooling plume region exists, which is a consequence of the better mixing of cold and hot water in the downcomer. This is because the much lower injection mass flow rate in this case results in flow dispersion at the blockage formed by the neutron shield and does not allow for the development of a prominent cold plume as in the MBLOCA case. The temperature profile in the cooling plume is used to calculate SIF of the assumed cracks. The original FAVOR code is modified to allow reading of the RPV temperature distribution calculated by CFD. This change of FAVOR is applicable for both deterministic and probabilistic analyses. FAVOR was
Field Code Changed
9
Review Copy
modified to compute the mechanical response with a given prescribed through-wall temperature distribution from the 3D CFD calculation. The given through-wall temperature is taken from either within or outside of the plume in the 3D RPV model. Since FAVOR is a probabilistic code, the modified FAVOR is also used to perform probabilistic fracture mechanics analysis with the 3D CFD output.
In the deterministic assessment, an axial surface crack with depth of 17 mm and aspect ratio (length/depth) of 6 is considered. It is worth mentioning that 17 mm equals to 1/10 of the vessel wall thickness and corresponds to 2 times the nondestructive detection limit. The integrity analysis of the RPV, subjected to SBLOCA, MBLOCA and LBLOCA (Figs. 2 and 3), are studied with deterministic method. The comparison of KI with KIc (RTNDT=93
°C, limiting value given by RG 1.99 Rev. 2) is shown in Figs. 6a and 6b. It is seen that for most of the transients KIc is higher than KI, meaning that no crack initiation will occur. However, during the MBLOCA transient, KI is
higher than KIc for a large part of the time. Compared to the case without considering plume cooling, KI based
on the transients calculated by GRS-MIX is increased significantly by considering plume cooling effects. This is due to the much colder water temperature and higher HTC inside the plume. If temperatures are based on CFD calculations, the peak of KI of the cracks inside the plume increases more than 40% compared with that
averaged (outside). The peak KI of the crack in the plume is increased more than 30% compared to that outside
the plume.
Thus, neglecting the non-uniform cooling effect in the safety assessment is a non-conservative simplification. In addition, it should be noted that RELAP5, GRS-MIX and CFD are three codes that adopt completely different approaches to simulate the heating and mixing process of the injected cold water. RELAP5 is a best estimate one-dimensional coarse-grid simulation code that is not capable to take into consideration the plume cooling or thermal stratification, though it can provide the boundary conditions for other methods based on the integral analyses of the transient. On the other hand, GRS-MIX is based on a number of engineering correlations developed from UPTF-TRAM experiments for pressurized water reactors. Different flow regimes can be distinguished and heating of the injected water can be determined at different downstream positions in the downcomer. Though, due to geometrics differences of the adopted design in the present study and differences in conditions (e.g., asymmetric injections), there is uncertainty in its predictions. CFD instead consider the exact details of geometry and boundary conditions. Best practice guidelines were followed for meshing and model selections.
From the above, the authors believe that the differences are greatly attributed to the different approaches (and the validity of each method, especially for GRS-MIX when it is applied to different geometry and different injection configurations) adopted in each code and CFD results are the most realistic ones and there is no error
9
Review Copy
transfer in steps of calculations. Though, CFD can be used only for selected cases due to computational expenses, and a full analyses of PTS still need to rely on other less detailed methods (such as engineering models or system codes ) but also take into consideration the uncertainly in the prediction as demonstrated in this paper.
4.1.2 T-stress calculations
The elastic T-stress, or the second term of the Williams series expansion for linear elastic crack-tip fields, calculated by the interaction integral implemented in Abaqus 6.14, is used to analyze the crack tip constraint [3334-3637]. As shown in Figs. 6c and 6d, T-stress generally decreases with the transient time and then increases. This trend is opposite to that of SIF shown in Figs. 6a and 6b. At the initial state, the stress is mainly caused by the high internal pressure and is relatively high. With increasing thermal stress and decreasing of internal pressure, the level of stress triaxiality of the RPV is significantly decreased. And The T-stress decreases until achieving its minimum value. With the repressurization and increase of SIF, T-stress increases as the pressure increases the stress triaxiality. It is also seen in Figs. 6c and 6d that the non-uniform cooling effect increases the T-stress value due to the increasing of the stress in both axial and circumferential directions. During the SBLOCA, T-stress displays a similar trend as that during MBLOCA transient. The difference is that T-stress variate varies more significantly for the MBLOCA due to the higher thermal gradient.The negative T-stress means constraint loss occurs, which implies that the application of KIc based on plane strain specimens to
the RPV leads to a conservative result. In order to get a more precise result, the fracture toughness from the test standards should be adjusted to the real component by considering the constraint.
4.2Probabilistic fracture mechanics analysis
In the probabilistic analysis, the randomness of KIC is based on a Weibull distribution and the probability for
crack initiation at a certain KI is
(
)
K
K
0 a P
1-exp a
≤
≤ = −
− >
K
I C
Ic I I K
I K
K
K K K a
K b
, (5) where
21.27 9.18exp[0.041( )]
K NDT
a = + T−RT , (6)
17.16 55.10 exp[0.014( )]
K NDT
b = + T−RT , (7)
4
K
c = . (8)
Review Copy
KIa model is developed based on a lognormal distribution of fitted to data from an ORNL database [6]. The
median of KIa model is written as
(
)
30.00 77.70exp 0.016
Ia NDT
K = + T−RT
. (9) The probabilistic analysis is performed for the beltline region of the vessel, which includes two rings and a welding region which are exposed to high neutron irradiation. In the probabilistic analysis, the crack density, depth, location, orientation, aspect ratio, ∆RTNDT, KIc and KIa are assumed to be random variables [11]. The
mean depths of surface and embedded cracks are 5 mm and 1.85, 6.29 or 4.03, 8.92 mm (depending on ring or welding, small or large cracks), respectively. The crack distributions of the surface and embedded cracks in this study are shown in Fig. 7a. It should be noted that for the deterministic analyses, only a fixed crack is considered. A large population of cracks is considered for the probabilistic analysis. The distributions of cracks, density, depth, aspect ratio are described in the manuscript. FAVOR is used for probabilistic fracture mechanics analysis based on the output of RELAP5, GRS-MIX and 3D CFD calculations. The FAVOR code is modified to compute the mechanical response and perform probabilistic analysis with a given prescribed through-wall temperature distribution taken from 3D CFD analysis. The results from XFEM models are used only in deterministic analysis to compare and validate the stress intensities.
The calculated crack initiation and failure probabilities for the three transients are shown in Fig. 7b. The conditional failure probabilities are used to calculate the cumulative failure frequency, which will be discussed later.It is seen that the probabilities based on GRS-MIX output is are higher than those based on the RELAP 5 output. This means the probabilities increase if plume cooling effects are considered. For MBLOCA it is shown that the probabilities inside the plume are more than 9 orders of magnitude higher than that outside the plume which is in agreement with the KI analysis. This is because the much lower temperature in the non-uniform
cooling region occurs and thus increases the KI and failure probabilities.
5. Determination of maximum RTNDT according to deterministic method
In the deterministic analysis, the limiting KIc-temperature curve and the maximum allowed RTNDT should be
calculated to guarantee the safety of the irradiated RPV during the operation and used in the framework of lifetime extension. The maximum allowed RTNDT are determined by maximum or tangent criteria for the
postulated transient and crack geometry. This is computed by shifting the indicates that the KIc-temperature
curve is shifted until it is intercepted intersected to their peak value if warm prestressing (WPS)-effects are considered or tangent to the calculated KI-temperature curve of the transient under investigation. If the KIc
-temperature curve is tangent to the KI-temperature curve, KIc is always higher than KI during the whole transient
and thus no crack initiation occurs. WPS effect means that no crack initiation will occur if the material has been
Formatted: Font: Italic
Formatted: Subscript
Review Copy
prestressed at a higher temperature before reloaded above the KIc curve at a lower temperature. In the safety
margin analysis, the maximum criteria can be used if the WPS effect is considered. For the same KI
-temperature curve, the maximum criteria predicts a larger safety margin and thus decreases the conservatism of the results. According to both tangent and maximum criterion, the maximum allowed RTNDT of the irradiated
RPV is determined. This determines the maximum allowed RTNDT of the irradiated RPV. In this part, the maximum allowed RTNDT valuesaccording to maximum and tangent criteria for the axial surface crack with a
depth of 17 mm and aspect ratio of 6 are evaluated, as shown in Fig. 8. The most critical transient, i.e. MBLOCA transients calculated from RELAP5, GRS-MIX and 3D CFD are used and the axial surface cracks are postulated in the cylinder ring and nozzle regions. According to the maximum criteria, the maximum allowed RTNDT is 56.9 °C for the crack in the nozzle region based on CFD output, and 90.2 °C, 115.7 °C and
136.2 °C for the cracks in the ring region based on the CFD, GRS-MIX and RELAP5 output. According to the tangent criteria which do not consider WPS-effects, the maximum allowed RTNDT is 36 °C for the crack in the
nozzle region based on CFD transient, and 68.5 °C, 81 °C and 104 °C for the cracks in the ring region based on the CFD, GRS-MIX and RELAP5 output. The CFD output leads to the lowest allowed RTNDT values. This
means that these results may not be conservative without considering the non-uniform cooling effects with CFD calculations. Maximum allowed RTNDT values are used to limit the lifetime of the RPV.
6. Safety margin according to probabilistic fracture mechanics method
6.1 Cumulative failure frequency
The conditional failure probabilities are calculated based on the RELAP5, GRS-MIX and CFD calculated temperatures. In the following, the conditional probabilities due to the SBLOCA, MBLOCA and LBLOCA are used to calculate the cumulative failure frequency, which can be directly used as safety assessment of the RPV. The total cumulative failure frequency ϕ(F) under several transients is determined from the summation of the products of the individual transient occurrence frequency and the conditional failure probability, as
( )
( )
ii i
(F) E P F E
φ
=∑
φ
, (10)where ϕ(E)i is the occurrence frequency of the ith transient, P(F│E)i is the conditional failure probability of
vessel due to the ith transient. F denotes the failure caused by event E. The occurrence frequencies for the SBLOCA (3 cm2), MBLOCA (70 cm2) and LBLOCA (450 cm2) are 4.62×10⁻³ /year, 4.52×10⁻⁴ /year and
3.30×10⁻⁶ /year, respectively [18, 19].
The cumulative failure frequencies are calculated and listed in Table 1. The cumulative failure frequency based on the RELAP5 input is 2.54×10⁻⁹ /year. Based on GRS-MIX, the frequency is 2.98×10⁻⁸, which is one order
Formatted: Font: Italic
Formatted: Subscript
Review Copy
higher than that based on RELAP5. This is because the GRS-MIX data considered the non-uniform cooling effect whereas the RELAP5 data is from outside the plume. The cumulative failure frequency considering the non-uniform cooling based on CFD transients is 2.07×10⁻⁷ /year, which is higher than those based on RELAP5
and GRS-MIX data. This is in agreement with the deterministic analysis shown in Fig. 6. It is also shown in Table 1 that considering plume cooling effects increases the total failure frequency by 1-2 orders of magnitude. Nevertheless, all the failure frequencies fulfill the acceptance criterion (less than 1×10⁻⁶ through-wall cracks per
year) for RPVs [9]. Therefore, the RPV is regarded as safe from probabilistic study, whereas the deterministic analyses predict crack initiation.
6.2 Maximum RTNDT according to probabilistic fracture mechanics
In the USA, probabilistic methods are applied by US NRC to define the screening criteria [8, 9]. The NRC regulation [8] specifies limits of 132°C (270°F) and 149°C (300°F) on RTNDT for the axially-oriented welds (as
well as plates and forging) and circumferentially-oriented welds in the beltline region of the vessel. These limits on RTNDT are limits according to an annual through-wall cracking frequency (TWCF) limit of 5×10⁻⁶
events/year. Since the early 1980s, several conservatisms have been quantified and a re-examination of the technical basis for these screening limit has been undertaken and risk-informed revision of the PTS rule and the screening limit have been developed. Recommendations on toughness-based screening criteria for PTS are provided in [8] based on RELAP and FAVOR calculation, the method is shown in Fig. 9a. According to the new screening criteria, the probabilistic screening criterion is defined as 1×10⁻⁶ events/year [9].
With the probabilistic results correlation between the maximum RTNDT of the irradiated material and a failure
frequency can be defined. According to the probabilistic results calculated for weld and forgings (ring material) shown in Fig. 9b, both failure frequency according to circumferential weld and forgings depending on the maximum RTNDT show a similar trend. The tendencies for the circumferential weld and the forgings are
determined by the Least-Square method, as shown in the following equations.
With the transients from RELAP5, TWCF for the ring and welding materials are calculated:
(
)
10.0328.5
9.91 10 NDT
ring
RT
TWCF year
−
× ×
= , (11)
(
)
11.0933.08
3.72 10 NDT
weld
RT
TWCF year
−
× ×
= , (12)
With the transients from GRS-MIX, TWCF for the ring and welding materials are:
(
)
9.3226.31
9.48 10 NDT
ring
RT
TWCF year
−
× ×
= , (13)
Review Copy
(
)
11.1032.08
2.49 10 NDT
weld
RT
TWCF year
−
× ×
= , (14)
With the transients from 3D CFD, TWCF for the ring and welding materials are:
(
)
9.9125.90
2.47 10 NDT
ring
RT
TWCF year
−
× ×
= , (15)
(
)
11.8431.82
1.90 10 NDT
weld
RT
TWCF year
−
× ×
= , (16)
Therefore, based on the PTS Screening Criteria it is also possible to determine the maximum RTNDT. For a
given allowable failure frequency of 1×10⁻⁶ an allowable RT
NDT for the circumferential weld and the forgings
according to the above equations are calculated and shown in Figs. 9c and 9d.
The maximum allowed RTNDT of the ring material, as shown in Figs. 9c and 9d, are 93 °C for the case based on
CFD transient, and 106 °C, 118.7 °C and 139.3 °C for GRS-MIX and RELAP5 calculated transient. The corresponding maximum allowed RTNDT of the welding material are 143.6 °C, 194.3 °C, 206 °C and 245.7 °C.
Compared to the maximum allowed RTNDT determined from the deterministic method in Section 5, the
maximum allowed RTNDT from the probabilistic method is increased by more than 16 °C, since random
variables are considered in the probabilistic analysis. This is because that in the deterministic analysis the most bounding value is used, while in the probabilistic analysis the scatter of random variables is considered and thus reduces the conservatism in the deterministic analysis. The use of most bounding variables excludes crack initiation whereas in the probabilistic analyses, probabilities for crack initiation are calculated.
7. Conclusions
Based on this study, the following conclusions are drawn:
1. A comprehensive framework coupling reactor system, fluid dynamics, fracture mechanics and probabilistic analyses for the integrity analysis of RPVs subjected to PTS loadings is proposed. Probabilistic study of the RPV considering the non-uniform cooling effect is performed. A series of transients, initiated by a break in the hot leg, is simulated with RELAP5, GRS-MIX and CFD with and without considering non-uniform cooling effect. Stress intensity factors are evaluated by FEM, XFEM and FAVOR codes.
2. The comparison of stress intensities calculated based on the different thermal-hydraulic tools (RELAP5, GRS-MIX and CFD) showed large differences due to the differences in thermal hydraulic results. Peak KI of the cracks inside the plume increases about 30% compared with that outside. KI based on CFD
input is the highest, followed by that based on GRS-MIX and RELAP5. Considering the non-uniform
Review Copy
plume cooling effects increases the total failure frequency by more than one order of magnitude. In order to be more realistic and not to be non-conservative, 3D CFD may be required for the safety analysis of the RPV.
3. Considering non-uniform cooling effect increased the crack tip constraint due to the increase of the stress in both axial and circumferential directions. The T-stress is influenced by loading, geometry and crack size. The cooling plume also has a significant influence on T-stress distributions.
4. In the deterministic analysis, according to the maximum criteria, the maximum allowed RTNDT is 56.9 °C,
for the crack in the nozzle region based on CFD transient, and 90.2 °C, 115.7 °C and 136.2 °C for the cracks in the ring region based on the CFD, GRS-MIX and RELAP5 calculated transient. These values are 36 °C, 68.5 °C, 81 °C and 104 °C according to the tangent criteria. Maximum allowed RTNDT values
are used to limit the lifetime of the reactor pressure vessel.
5. The safety margin is increased by more than 16 °C if a probabilistic method is applied. The ring made from base material is more critical than the welding material of the vessel. According to the probabilistic method, the maximum allowed RTNDT values of the ring material are 93 °C, 118.7 °C and 139.3 °C for
the case based on CFD transient, GRS-MIX and RELAP5 calculated transient, respectively. The corresponding maximum allowed RTNDT values of the welding material are 143.6 °C, 206 °C and 245.7
°C.
Acknowledgements
The authors acknowledge the financial support of the PISA Project provided by the Swiss Federal Nuclear Safety Inspectorate (ENSI) (DIS-Vertrag Nr. H-100668).We are also thankful for providing the code GRS-MIX by the Gesellschaft für Anlagen- und Reaktorsicherheit GmbH (GRS).
References
1. Qian, G. (2014) Gonzalez-Albuixech VF, Niffenegger M. In-plane and out-of-plane constraint effects under pressurized thermal shocks. Int. J. Solids. Struc.,6, 1311-1321.
2. Qian, G., and Niffenegger, M. (2013) Integrity analysis of a reactor pressure vessel subjected to pressurized thermal shocks by considering constraint effect. Eng. Fract. Mech.,112-113, 14-25.
3. International Atomic Energy Agency. (2010) Pressurized Thermal Shock in Nuclear Power Plants: Good Practices for Assessment.IAEA‐TECDOC‐1627. Austria: IAEA.
4. Qian, X.D., Jr., R.H., Yin, S.J., and Bass. R. (2008) Cleavage fracture modeling of pressure vessels under transient thermo-mechanical loading. Eng. Fract. Mech.;75, 4167-89.
5. Sun, X., Chai, G., and Bao, Y. (2017) Elastic and elastoplastic fracture analysis of a reactor pressure vessel
Review Copy
under pressurized thermal shock loading. Eur. J. Mech. A-Solid., 66, 69-78.
6. Dickson, T.L., Williams, P.T., and Yin, S. (2007) Fracture analysis of vessels-Oak Ridge FAVOR, v 06.1: computer code: user’s guide. NUREG-ORNL/TM-2007/031.
7. Bass, B.R., Pugh, C.E., Sievers, J., and Schulz, H. (1999) International comparative assessment study of pressurized thermal shock in reactor pressure vessel.NUREG/CR-6651.
8. U.S. Nuclear Regulatory Commission (2010) Section 50.61a of the Code of Federal Regulations, “Alternate Fracture Toughness Requirements for Protection Against Pressurized Thermal Shock Events,” 10 CFR 50.61a. US NRC, Washington.
9. U.S. Nuclear Regulatory Commission (2007) Technical Basis for Revision of the Pressurized Thermal Shock (PTS) Screening Limit in the PTS Rule (10 CFR 50.61). NUREG-1806, Vol. 1, US NRC, Washington.
10.Moinereau, D., and Bezdikian, G. (2008) Structural Margin Improvements in Age-embrittled RPVs with Load History Effects (SMILE). Contract FIKS-CT2001-00131.
11.Simonen, F..A., Doctor, S.R., Schuster, G.J., and Heasler, P.G. (2004) A generalized procedure for generating flaw-related inputs for the FAVOR code. NUREG/CR-6817.
12.Taylor, N., Nilsson, K., Minnebo, P., Bass, B., McAfee, W., Williams, P., Swan, D., and Siegele, D. (2005) An Investigation of the Transferability of Master Curve Technology to Shallow Flaws in Reactor Pressure Vessel Applications. NESC IV (EUR 21846 EN).
13.Keim, E., Schmidt, C., Schöpper, A., and Hertlein, R. (2001) Life management of reactor pressure vessels under pressurized thermal shock loading: deterministic procedure and application to Western and Eastern type of reactors. Int. J. Pres. Vess. Piping, 78, 85-98.
14.Marie, S., Menager, Y., and Chapuliot, S. (2005) Stress intensity factors for underclad and through clad defects in a reactor pressure vessel submitted to a pressurized thermal shock. Int. J. Pres. Vess. Piping, 82, 746-760.
15.Yu, M., Luo, Z., and Chao,Y. J. (2015) Correlations between Charpy V-notch impact energy and fracture toughness of nuclear reactor pressure vessel (RPV) steels. Eng. Fract. Mech., 147, 187–202
16.Chou, H.W., and Huang, C.C. (2014) Effects of fracture toughness curves of ASME Section XI - Appendix G on a reactor pressure vessel under pressure-temperature limit operation. Nucl. Eng. Des.;280, 404-412. 17.Chou, H.W., and Huang, C.C. (2014) Structural reliability evaluation on the pressurized water reactor
pressure vessel under pressurized thermal shock events. Proceedings of the ASME 2014 Pressure Vessels & Piping Division Conference, PVP2014-28350, Anaheim, California, USA, 2014.
Review Copy
18.Qian, G., Niffenegger, M. (2013) Procedures, methods and computer codes for probabilistic assessment of reactor pressure vessels subjected to pressurized thermal shocks. Nucl. Eng. Des.; 258, 35-50.
19.Qian, G., and Niffenegger, M. (2014) Deterministic and probabilistic analysis of a reactor pressure vessel subjected to pressurized thermal shocks. Nucl. Eng. Des.; 273, 381-95.
20.Sun, X., Chai, G., and Bao, Y. (2017) Nonlinear numerical study of crack initiation and propagation in a reactor pressure vessel under pressurized thermal shock using XFEM. Fatigue Fract. Eng. Mater. Struct., 1–
13. https://doi.org/10.1111/ffe.12689
21.González-Albuixech, V..F., Qian, G., Sharabi, M., Niffenegger, M., Niceno, B., and Lafferty, N. (2015) Comparison of PTS Analyses of RPVs based on 3D-CFD and RELAP5. Nucl. Eng. Des.;291, 168-78. 22.Qian, G., González-Albuixech, V.F., Niffenegger, M., and Sharabi, M. (2016) Probabilistic PTS analysis for
a reactor pressure vessel considering plume cooling effect. ASME J. Press. Vess. Tech., 138, 041204-1-041204-8.
23.SCIENTECH Inc. (1999) RELAP5/Mod3 Code Manual, vol. I: Code Structure, System Models and Solution Methods. The Thermal Hydraulics Group, Idaho.
24.Mahaffys, J.,Chung, B., Dubois, F., et al. (2007) Best Practice Guidelines for the Use of CFD in Nuclear Reactors Safety Applications. NEA/CSNI/R.
25.Damerell, P.S., Simonis, J.W. (1992) 2D/3D Program Work Summary Report. NUREG/IA-0126.
26.Sonnenburg, H.G. (1997) Phänomenologische Versuchsauswertung des Versuchs UPTF-TRAM C1 Thermisches Mischen im Kaltstrang. GRS-A-2434.
27.Chen, .C.J., and Chen, C.H. (1979) On Prediction and Unified Correlation for Decay of Vertical Bouyant Jets. Trans. ASME, Vol. 101, 532-537.
27.28. Sharabi, M., Gonzalez-Albuixech, V.F., Lafferty, N., Niceno, B. and Niffenegger, M. (2016) Computational Fluid Dynamics Study of Pressurized Thermal Shock in the Reactor Pressure Vessel. Nucl. Eng. Des.;297, 111-122.
28.29. Hibbitt, Karlsson, Sorensen (2017). Abaqus 6.14.3 Manual.
29.30. Bückner, H. (1970) A novel principle for the computation of stress intensity factors. ZAMM50, 529-546. 30.31. Moës, N., Dolbow, J., and Belytschko, T. (1999) A finite element method for crack growth without
remeshing. Int. J. Num. Methods Eng.,46,131–150.
31.32. ASME code (1995). ASME boiler and pressure vessel code, section III, nuclear power plant components. New York.
32.33. ASME code (1997). ASTM-E1921-02. Test method for determination of reference temperature, T0, for
Review Copy
ferritic steels in the transition range. New York.
33.34. Wang, X. (2003) Elastic T-stress solutions for semi-elliptical surface cracks in finite thickness plates.
Eng. Fract. Mech.;70, 731-756.
34.35. Zhu, X.K., and Joyce, J.A. (2012) Review of fracture toughness (G, K, J, CTOD, CTOA) testing and standardization. Eng. Fract. Mech.;85, 1-46.
35.36. Hohe, J., Brand, M., and Siegele, D. (2010) Behaviour of sub-clad and through-clad cracks under consideration of the residual stress field. Eng. Fract. Mech.;77, 217-228.
36.37. Chao, Y.J., Yang, S., and Sutton, M.A. (1994) On the fracture of solids characterized by one or two parameters: Theory and practice. J. Mech. Phys. Solids, 42, 629-647.
Review Copy
List of Table/Figure Captions:
Table 1 Conditional failure probabilities and total failure frequency, calculated with FAVOR and based on RELAP5, GRS-MIX and CFD calculated transients.
Fig. 1a Physical model for the integrity analysis of a reactor pressure vessel. Fig. 1b Flowchart in the probabilistic fracture mechanics analysis. Fig. 1c Demonstration of applied numerical methods in the safety assessment of a RPV.
Fig. 2a Coolant temperature in the downcomer at core height for various hot leg break sizes (cm2) calculated
with RELAP5.Fig. 4b Reactor coolant system pressure for various hot leg break sizes (cm2) calculated with
RELAP5. Fig. 4c HTC in the downcomer for various hot leg break sizes (cm2) calculated with RELAP5. Fig. 4d
Coolant temperature in the downcomer at the core height for various hot leg break sizes (cm2) calculated with
GRS-MIX. Fig. 2e Heat transfer coefficient history of the studied transients calculated with GRS-MIX. Fig. 3a Structured mesh of the RPV for CFD. Fig. 3b Partial view of the mesh. Fig. 3c Temperature distribution at the inner RPV wall for the SBLOCA calculated with CFD.Fig. 3d Temperature distribution at the inner RPV wall for the MBLOCA calculated with CFD. Fig. 3e von-Mises stress distribution (unit: Pa) at the inner RPV wall for the SBLOCA calculated with CFD. Fig. 3f von-Mises stress distribution (unit: Pa) at the inner RPV wall for the MBLOCA calculated with CFD.
Fig. 4a Overview of the mesh and crack details for axial crack using FEM. Fig. 4b Overview of the mesh and crack details for axial crack using XFEM. The overlap of the elliptical surface and the cylinder defines the crack. Fig. 4c Overview of the mesh and crack details for cracks in inlet nozzle using XFEM. The overlap of the elliptical surface and the cylinder defines the crack.
Fig. 5a Comparison of KI calculated by FAVOR, FEM and XFEM for surface crack 2c/a=6, a=17 mm and the MBLOCA. Fig. 5b Inner vessel wall temperature for MBLOCA, with and without considering non-uniform cooling. Fig. 5c Inner vessel wall temperature for SBLOCA, with and without considering non-uniform cooling. Fig. 6a Comparison of KI values by considering non-uniform cooling, MBLOCA. Fig. 6b Comparison of KI
values of the RPV by considering non-uniform cooling, SBLOCA. Fig. 6c Comparison of T-stress by considering non-uniform cooling, MBLOCA. Fig. 6d Comparison of T-stress by considering non-uniform cooling, SBLOCA.
Fig. 7a Crack distributions of the surface and embedded cracks assumed in the probabilistic study. Fig. 7b
Review Copy
Probability for different transients based on RELAP5, GRS-MIX and CFD calculated transients.
Fig. 8 Maximum and tangent criteria to determine allowed RTNDT for the surface crack postulated in the nozzle
and ring.
Fig. 9a Proposal of PTS screening limit based on probabilistic estimate of through-wall cracking frequency (TWCF) acceptance criterion [8, 9]. Fig. 9b Fittings between through-wall cracking frequency and the maximum RTNDT for welding and ring materials. Fig. 9c Comparison of maximum RTNDT from probabilistic
method with that from the maximum criteria of the deterministic method for ring and welding materials Fig. 9d Comparison of maximum RTNDT from probabilistic method with that from the tangent criteria of the
deterministic method for ring and welding materials.
Review Copy
Transient occurrence frequency 4.62×10⁻³
4.52×10⁻⁴ 3.30×10⁻⁶
Conditional failure probability or total
failure frequency (RELAP5) 5.49×10
-7
1.00×10⁻¹³ 1.00×10⁻¹³ 2.54×10⁻⁹
Conditional failure probability or total
failure frequency (GRS-MIX) 6.36×10
-6
9.51×10⁻⁷ 1.00×10⁻¹³ 2.98×10⁻⁸
Conditional failure probability or total
failure frequency (CFD) 1.00x10
-13
4.57x10⁻⁴ 2.07×10⁻⁷
Table 1 Conditional failure probabilities and total failure frequency, calculated with FAVOR and based on RELAP5, GRS-MIX and CFD calculated transients.
Review Copy
Fig. 1a Physical model for the integrity analysis of a reactor pressure vessel.
Fig. 1b Flowchart in the probabilistic fracture mechanics analysis.
[image:26.612.51.564.86.661.2]Review Copy
0.1 1 10 100
0 5 10 H e a t tr a n s fe r c o e ff w a te r-R P V
[
k W /m Time [min]1 10 100
[image:27.612.62.247.84.233.2]0 100 200 Time [min] W a te r te m p e
Fig. 2c HTC in the downcomer for various hot leg break sizes
(cm2) calculated with RELAP5.
Fig. 2d Coolant temperature in the downcomer at the core height for various hot leg break sizes (cm2) calculated with GRS-MIX.
0.1 1 10 100
0 100 200 300 400
Time [min]
W
a
te
r
te
m
p
e
ra
tu
re
[
°°°°
C
]
3 cm2 70 cm2 450 cm2 Transients by Relap, without considering plume
1 10 100
0 10 20
Transients by Relap, without considering plume
P
re
s
s
u
re
[
M
P
a
]
Time [min]
[image:27.612.318.490.86.226.2]3 cm2 70 cm2 450 cm2
Fig. 2a Coolant temperature in the downcomer at core height
for various hot leg break sizes (cm2) calculated with RELAP5.
Fig. 2b Reactor coolant system pressure for various hot leg
break sizes (cm2) calculated with RELAP5.
0.1 1 10 100
0 5 10 15 20 H e a t tr a n s fe r c o e ff ic ie n t o f w a te r-R P V [ k W /m
2 ⋅⋅⋅⋅K
]
Time [min]
Transients by GRS-MIX, within plume
3 cm2 70 cm2 450 cm2
Fig. 2e Heat transfer coefficient history of the studied transients calculated with GRS-MIX.
[image:27.612.44.499.286.443.2]Review Copy
[image:28.612.137.454.280.464.2]Fig. 3a Structured mesh of the RPV for CFD. Fig. 3b Partial view of the mesh.
Fig. 3c Temperature distribution at the inner RPV wall for the SBLOCA calculated with CFD.
ti = 383 s ti = 942 s
[image:28.612.138.469.506.682.2]Review Copy
[image:29.612.166.443.349.553.2]Fig. 3e von-Mises stress distribution (unit: Pa) at the inner RPV wall for the SBLOCA calculated with CFD.
Fig. 3f von-Mises stress distribution (unit: Pa) at the inner RPV wall for the MBLOCA calculated with CFD.
ti = 383 s ti = 942 s
ti = 49 s ti = 242 s
Review Copy
Fig. 4a Overview of the mesh and crack details for axial crack using FEM.
Fig. 4b Overview of the mesh and crack details for axial crack using XFEM. The overlap of the elliptical surface and the cylinder defines the crack.
[image:30.612.136.543.263.446.2] [image:30.612.160.443.486.676.2]Review Copy
100 200 300 0 50 100 MBLOCA KI, 2c/a=6, a=17 mm Axial surface cracks
FEM XFEM FAVOR
Circumferential surface cracks FEM
FAVOR
t i
Crack tip temperature [°°°°C]
KI a n d KIc [M P a
⋅⋅⋅⋅
m 0 .5 ]Fig. 5a Comparison of KI calculated by FAVOR, FEM and XFEM for surface crack 2c/a=6, a=17 mm and the MBLOCA.
0 10 20 30 40 50
0 100 200 300
MBLOCA, 70 cm2 leak
CFD, inside plume CFD, outside plume Relap, without considering plume GRS-MIX,inside plume In n e r v e s s e l w a ll t e m p e ra tu re [
°°°°
C ] Time [min]0 100 200 300 400 500
0 100 200
300 SBLOCA, 3 cm2
leak CFD, inside plume CFD, outside plume
Relap, without considering plume GRS-MIX, inside plume
Inn er v ess el w all t emp era ture [
°°°°
C] Time [min]Fig. 5b Inner vessel wall temperature for MBLOCA, with and without considering non-uniform cooling.
Fig. 5c Inner vessel wall temperature for SBLOCA, with and without considering non-uniform cooling.
[image:31.612.152.432.97.324.2] [image:31.612.42.553.336.590.2]Review Copy
50 100 150 200 250 300
-20 0 20 40 60 80 100 KI a n d KIc [M P a
⋅⋅⋅⋅
m 0 .5 ]Crack tip temperature [°°°°C]
CFD, inside plume CFD, border plume CFD, outside plume
Relap, without consideing plume GRS-MIX, inside plume
MBLOCA, 70 cm2, K
I, 2c/a=6, a=17 mm,
axial surface cracks, by FAVOR:
t
i
50 100 150 200 250
20 40 KI a n d KIc [M P a
⋅⋅⋅⋅
m 0 .5 ]Crack tip temperature [°°°°C]
CFD, inside plume CFD, border plume CFD, outside plume
Relap, without considering plume GRS-MIX, inside plume
SBLOCA, 3 cm2
, KI, 2c/a=6, a=17 mm,
axial surface cracks, by FAVOR:
[image:32.612.39.530.81.547.2]ti
Fig. 6a Comparison of KI values by considering non-uniform
cooling, MBLOCA.
Fig. 6b Comparison of KI values of the RPV by considering
non-uniform cooling, SBLOCA
50 100 150 200 250 300
-300 -200 -100 0 100
Crack tip temperature [°°°°C]
CFD, inside plume CFD, outside plume Relap, without consideing plume GRS-MIX, inside plume
MBLOCA, 70 cm2
, axial surface cracks,
2c/a=6, a=17 mm,
T -s tr e s s [M P a ] ti
50 100 150 200 250 300
-200 -100 0 T -s tr e s s [M P a ]
Crack tip temperature [°°°°C]
SBLOCA, 3 cm2
, axial surface cracks,
2c/a=6, a=17 mm,
CFD, inside plume CFD, outside plume Relap, without consideing plume GRS-MIX, inside plume
t
i
Fig. 6c Comparison of T-stress by considering non-uniform cooling, MBLOCA.
[image:32.612.322.524.100.265.2]Review Copy
0 4 8 12 16 20 24 28 10-6 10-4 10-2 100 C ra c k n u m b e rs i n t h e b e lt [image:33.612.179.411.88.298.2]Crack depth [mm]
Fig. 7a Crack distributions of the surface and embedded cracks assumed in the probabilistic study.
10 100 1000
1E-14 1E-12 1E-10 1E-8 1E-6 1E-4 0.01
1 outside plume, initiation
outside plume, failure CFD,
within plume, initiation within plume, failure
GRS-MIX, initiaion GRS-MIX, failure Relap5, initiaion Relap5, failure C o n d it io n a l p ro b a b il it y f o r in it ia ti o n a n d f a il u re
Transient leakage size [cm2]
Fig. 7b Probability for different transients based on RELAP5, GRS-MIX and CFD calculated transients.
[image:33.612.165.415.339.530.2]