Optimization of the bioconversion of glycerol to ethanol
using Escherichia coli by implementing a bi-level
programming framework for proposing gene transcription
control strategies based on genetic algorithms
Carol Milena Barreto-Rodriguez1, Jessica Paola Ramirez-Angulo1, Jorge Mario Gomez-Ramirez1, Luke Achenie2, Andres Fernando Gonzalez-Barrios1
1Grupo de Diseño de Productos y Procesos (GDPP), Department of Chemical Engineering, Universidad de los Andes, Bogotá, Colombia 2Multiscale and Multiphysics Modeling Lab, Department of Chemical Engineering, Virginia Polytechnic Institute and State
Univer-sity, Blacksburg, Virginia Email: [email protected]
Received 25 May 2012; revised 28 June 2012; accepted 7 July 2012
ABSTRACT
In silico approaches for metabolites optimization
have been derived from the flood of sequenced and annotated genomes. However, there exist still nu- merous degrees of freedom in terms of optimization algorithm approaches that can be exploited in order to enhance yield of processes which are based on bio- logical reactions. Here, we propose an evolutionary approach aiming to suggest different mutant for aug- menting ethanol yield using glycerol as substrate in
Escherichia coli. We found that this algorithm, even
though is far from providing the global optimum, is able to uncover genes that a global optimizer would be incapable of. By over-expressing accB, eno, dapE, and accA mutants in ethanol production was aug- mented up to 2 fold compared to its counterpart E.
coli BW25113.
Keywords:Bi-Level Optimization; Escherichia coli;
Metabolic Flux Analysis; Genetic Algorithm
1. INTRODUCTION
It is a fact that systems biology is allowing the brain- storming for systematic approaches regarding the imple- mentation of methods to optimize the synthesis of meta- bolites [1]. Cells have been employed as miniaturized chemical plants that produce various chemicals towards our benefits. Nevertheless, bio-based processes are gene- rally inefficient due to the limited metabolic capacity of the cell towards the production of a desired product be- cause the objective of microbial metabolism is different from ours [2].
Molecular biology and metabolic engineering have emerged to provide the tools to reorient the objective of
the cell. On one hand, metabolic engineering looks for gene candidates susceptible of cloning. On the other hand, genomics, metabolomics, and proteomics are cur- rently easing the implementation of mathematical models aiming to predict reaction rates. These predictions allow to rationally choosing genes candidates for cloning or deleting. Metabolic fluxes represent the metabolic path- ways and help to integrate these factors through a mathe- matical framework [2].
Flux balance analysis (FBA) is a technique based on mass balances around intracellular metabolites under the pseudo-steady state assumption. Constraints-based flux analysis is a general term for optimization-based simu- lation techniques [2], all mostly based on linear pro- gramming due to the lineal nature of the problem. Basi- cally, the optimization problem is based on the reactions stoichiometric, inequality restrictions regarding particular metabolic flux, and a cellular objective. In general the optimization problem can be formulated as follows:
cellularobjective
Maximize (1)
1
0 m
ij j j
i
S
Subject to :(2)
FBA models typically invoke the optimization of a particular cellular objective such as ATP production, bio- mass formation, and minimization of metabolic adjust- ment; subject to network stoichiometry aiming a flux distribution [3]. Specifically, Eq.2 represents the mass
balance constraints in a metabolic network where is the
S m n stoichimetric matrix ( corresponds to the number of metabolites and stands for the number of fluxes); and the constraints imposed on the magnitude of individual metabolic fluxes in order to take into account
its reversibility or irreversibility [4]. Many efforts have been published related to quantifying each flux in the model as it hypothesizes what is the purpose of the cell when growing in a specific environment. In that matter, Knorr et al. [5] proposed a bayesian-based selection model to select metabolic objective functions departing from several hypotheses. Finally, their fitness was tested by comparing the flux obtained with previously published microarrays results [6].
In order to identify multiple gene deletions Burgard et al. [7] based on the duality theory, transformed the bi- level formulation into a single level MILP. These ap- proaches felt in limitations because they are only capable of proposing deletions based on binary variables. Mole- cular biology makes available means to control the ex- pression of specific genes through cloning so genes over- expression is now possible. Pharkya and Maranas [8] transcribed this possibility into an algorithm that propose which gene’s transcription should be controlled (up or down-regulation) to maximize productivity [8].
We believe that all these methods are mainly concerned about finding the global minimum. However, model pre- dictions and experimental fluxes disagree. Algorithms based on evolutionary programming present several ad- vantages that could be boosted when maximizing meta- bolites using FBA. For example, genetic algorithms offer a considerable amount of individuals which are not ne- cessarily related to the global but the first level predicts an augment in metabolite synthesis. In that regard, gen- etic algorithm was utilized to find gene deletions in Sa- charomyces cerevisae [9] which was found to be robust and low intensive compared to the dual problem approx- imation. In order to complement the former study, we evaluated the performance of an optimization framework that proposes gene modulation instead of deletions in Escherichia coli (E. coli) glycerol fermentations to ob- tain ethanol. Finally, several non-global optimum indivi- duals were experimentally evaluated to demonstrate the misleading fact of finding the global.
2. MATERIALS AND METHODS
2.1. First Level Platform Implementation
First level platform utilized is based on the stoichiometry model reported by Reed et al. [6]. In order to solve the LP problem (Eq.1) optimization tool COBRA developed
in Matlab® [10] was utilized implementing a simplex
algorithm with cellular growth of the microorganism as cellular objective function (Eq.3) as follows:
cellular-growth
Maximize (3)
1 0 m ij j j S
Subject to : (4)
where and are upper and lower bounds reported by Reed et al. [6].
2.2. Second Level Implementation
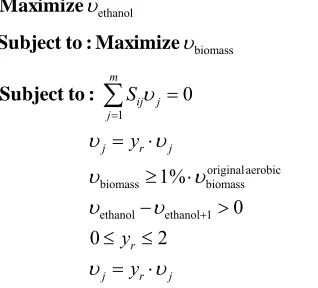
The optimization of the production of a specific bio- chemical mostly disagrees with the intention of the cell as its main interest constitutes to develop mechanisms to maximize the amount of biomass. This fact requires the use of a bi-level platform that consider both biomass syn- thesis and in our case ethanol production. The formula- tion of the optimization problem can be posed as:
ethanol
Maximize (5)
biomass
Subject to : Maximize (6)
1
originalaerobic biomass biomass ethanol ethanol 1
0 1% 0 0 2 m ij j j
j r j
r
j r j
S y y y
Subject to :where ij is the stoichiometric coefficient of metabolite in reaction ,
S
i j j represents the flux of reaction , r represents the over-expression, knockout or regula- tion of a flux. The last two restrictions in the inner cycle of the optimization platform refer to the minimum growth of biomass which corresponds to the 1% of the microor- ganism’s growth under aerobic conditions and the ac- ceptance or rejection of the mutation for the next genera- tion.
j y
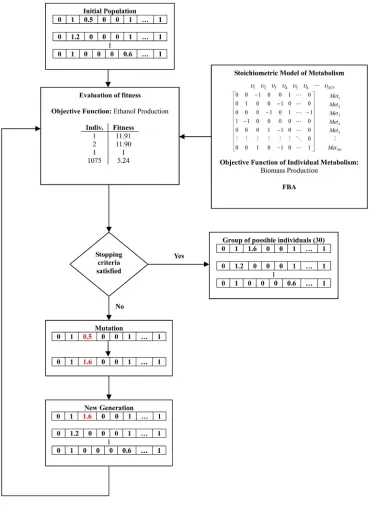
For the solution of the former problem a genetic algo- rithm (GA) was developed. This method is a specific case of evolutionary algorithms. First, GA randomly gen- erates an initial population. Then, a serial of selections of new generations are made based on the first population established by employing two types of children: elite and mutated and crossovered. Individuals are chosen based on comparing the ethanol flux value for the actual indi-vidual with the value obtained in a previous iteration. If the value of the actual individual is greater, then the mu-tation is accepted. Hence, the optimization platform ca-pable of giving a gamma of mutated strains with an op-timal cellular growth and chemical production proceeds as follows (Figure 1):
1) Selection of the initial point: wild type metabolic model is solved and these fluxes are initially selected to propose the next generation.
[image:2.595.358.517.231.375.2]Figure 1. Flow diagram of the genetic algorithm to determine gene candidates and regulation for maxi- mizing the production of ethanol from glycerol based on in silico modeling in Escherichia coli.
number in the [0, 2] interval chosen with a uniform ran- dom generator number. A product between this vector and the vector flux is calculated to finally generate the indi- vidual. Cero accounts for deletion, [0, 1) accounts for repression and [1, 2] for over-expression.
5) New generation is generated based on mutations and crossover operations and go to step 3.
6) Stop when the number of iterations previously is reached.
This algorithm was implemented in Matlab in a Dell OptiPlex 780 Desktop with a Intel® Core™ 2 Duo E7600
@ 3.06 GHz 3.07 GHz processor. The time running total time was approximately 3 hours after 115 overall itera- tions.
3) Each flux vector is treated as a single MFA op- timization problem.
2.3. Experimental Validation with Glycerol E. coli Fermentations
Taking into account the increasing interest from the bio- fuel industry towards ethanol production, the manufac- ture of this chemical using E. coli’s metabolic pathway growing in a glycerol medium was the selected as a case
of study (see formulation optimization problem Eqs.5 and 6). After running 115 overall iterations with a neglected
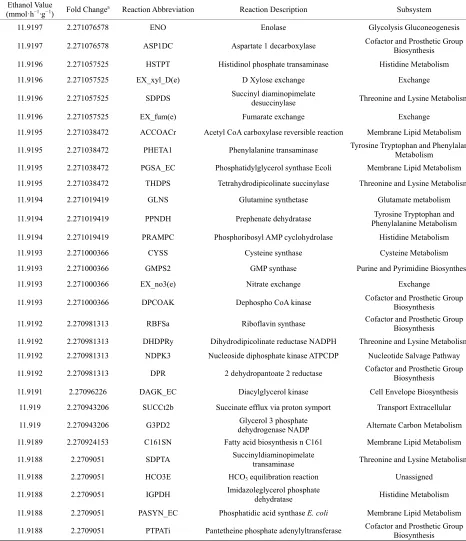
[image:4.595.57.523.184.725.2]crossover rate and variable mutation rate as it depended on the population size taking in to account what Jennison and Sheehan found (1995) we obtained 30 individuals (Table 1).
Table 1. Results from the bi-level optimization platform.
Ethanol Value
(mmol·h−1·g−1) Fold Changea Reaction Abbreviation Reaction Description Subsystem
11.9197 2.271076578 ENO Enolase Glycolysis Gluconeogenesis
11.9197 2.271076578 ASP1DC Aspartate 1 decarboxylase Cofactor and Prosthetic Group Biosynthesis
11.9196 2.271057525 HSTPT Histidinol phosphate transaminase Histidine Metabolism
11.9196 2.271057525 EX_xyl_D(e) D Xylose exchange Exchange
11.9196 2.271057525 SDPDS Succinyl diaminopimelate desuccinylase Threonine and Lysine Metabolism
11.9196 2.271057525 EX_fum(e) Fumarate exchange Exchange
11.9195 2.271038472 ACCOACr Acetyl CoA carboxylase reversible reaction Membrane Lipid Metabolism
11.9195 2.271038472 PHETA1 Phenylalanine transaminase Tyrosine Tryptophan and Phenylalanine Metabolism
11.9195 2.271038472 PGSA_EC Phosphatidylglycerol synthase Ecoli Membrane Lipid Metabolism
11.9195 2.271038472 THDPS Tetrahydrodipicolinate succinylase Threonine and Lysine Metabolism
11.9194 2.271019419 GLNS Glutamine synthetase Glutamate metabolism
11.9194 2.271019419 PPNDH Prephenate dehydratase Phenylalanine Metabolism Tyrosine Tryptophan and
11.9194 2.271019419 PRAMPC Phosphoribosyl AMP cyclohydrolase Histidine Metabolism
11.9193 2.271000366 CYSS Cysteine synthase Cysteine Metabolism
11.9193 2.271000366 GMPS2 GMP synthase Purine and Pyrimidine Biosynthesis
11.9193 2.271000366 EX_no3(e) Nitrate exchange Exchange
11.9193 2.271000366 DPCOAK Dephospho CoA kinase Cofactor and Prosthetic Group Biosynthesis
11.9192 2.270981313 RBFSa Riboflavin synthase Cofactor and Prosthetic Group Biosynthesis
11.9192 2.270981313 DHDPRy Dihydrodipicolinate reductase NADPH Threonine and Lysine Metabolism
11.9192 2.270981313 NDPK3 Nucleoside diphosphate kinase ATPCDP Nucleotide Salvage Pathway
11.9192 2.270981313 DPR 2 dehydropantoate 2 reductase Cofactor and Prosthetic Group Biosynthesis
11.9191 2.27096226 DAGK_EC Diacylglycerol kinase Cell Envelope Biosynthesis
11.919 2.270943206 SUCCt2b Succinate efflux via proton symport Transport Extracellular
11.919 2.270943206 G3PD2 dehydrogenase NADP Glycerol 3 phosphate Alternate Carbon Metabolism
11.9189 2.270924153 C161SN Fatty acid biosynthesis n C161 Membrane Lipid Metabolism
11.9188 2.2709051 SDPTA Succinyldiaminopimelate transaminase Threonine and Lysine Metabolism
11.9188 2.2709051 HCO3E HCO3 equilibration reaction Unassigned
11.9188 2.2709051 IGPDH Imidazoleglycerol phosphate dehydratase Histidine Metabolism
11.9188 2.2709051 PASYN_EC Phosphatidic acid synthase E. coli Membrane Lipid Metabolism
11.9188 2.2709051 PTPATi Pantetheine phosphate adenylyltransferase Cofactor and Prosthetic Group Biosynthesis
2.4. E. coli Fermentations Setup
2.4.1. Microorganism and Media
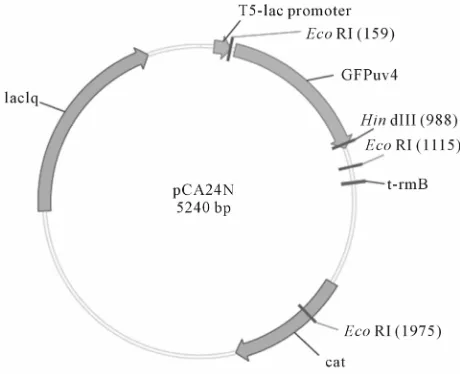
E. coli strains were obtained from ASKA clones library [11] which encompasses all E. coli W3110 OFR in the plasmid pCA24N (Table 2 and Figure 2) to evaluate the
effect of the over-expression of specific genes. The strains were kept in 32.5% glycerol stocks at −80˚C. E. coli cells were initially streaked on Luria-Bertani (LB) agar plates [12] containing 50 μg/mL chloramphenicol (for those containing pCA24N-based plasmids), and incubated at 37˚C. Wild-type E. coli K-12 BW25113 was obtained from the Yale University CGSC Stock Center.
2.4.2. Fermentations
Strains (stored as glycerol stocks at −80˚C) were streaked onto LIU medium [13] (8 g/L Yeast Extract, 3 g/L KH2PO4, 3 g/L K2HPO4, 1 g/L (NH4)2SO4, 0.41 g/L
CaCl2, 0.3 g/L MnSO4, 4 g/L Glucose, 8 g/L MgSO4, and
50 μg/mL chloramphenicol, where appropriate) plates and incubated overnight at 37˚C. A single colony was used to inoculate 250 mL Erlenmeyer flask filled with 25 mL LIU medium. The flasks were incubated at 37˚C, 250 rpm overnight. Then, in order to obtain ethanol, fermen- tations were performed in a 250 mL Erlenmeyer flask containing 10 mL of modified LIU medium (8 g/L Yeast Extract, 1 g/L (NH4)2SO4, 0.41 g/L CaCl2, 0.3 g/L
MnSO4, 8 g/L MgSO4, 20 g/L Glycerol, 2 g/L Lactose,
and 50 μg/mL Chloramphenicol, where appropriate) at 37˚C, 200 rpm for 2 days in an Orbital MRC® Shaker.
[image:5.595.56.286.533.720.2]Anaerobic conditions were maintained by flushing the headspace with ultrahigh purity nitrogen at 0.01 LPM. Four repetitions were made for each gene. Lactose was utilized as an inducer for scaling-up matters considering the cost of the typical inducer (Isopropyl β-D-1-thioga- lactopyranosid).
Figure 2. Cloning vector map of pCA24N.
2.5. Biomass
A genesis 10 UV Tremoelectron Corporation® spectro-
photometer was used to determine Optical Density in cultures at 550 nm and used as an estimate of cell con- centration (1 OD = 0.34 gDW/L). Growth rate was cal- culated assuming a cero or first order kinetics based on experimental results.
2.6. Ethanol
Near infrared spectroscopy (NIR) was utilized to quan- tify the ethanol during the fermentation (FOSS® NIR Sys-
tem 6500). To perform the calibration, E. coli fermenta-tions were performed in 250 ml Erlenmeyer flasks during four days, the samples were centrifuged for 4 hours at 4000 rpm at 4˚C. The supernatant was heated for 60 minutes at 45˚C to remove ethanol in the samples and ethanol was added at different concentrations. One inde- pendent calibration was plotted. The calibration curve showed a linear correlation with the following character- ristics: slope of –1209.4952, intercept 0.2419 and a r2 value of 0.8464.
2.7. Glycerol
An Analogue Zhifong® Refractometer was utilized to
quantify the glycerol during the fermentation. To per- form the calibration, fermentations were developed in 250 mL Erlenmeyer flasks during four days, the samples were centrifuged for 4 hours at 4000 rpm at 4˚C. Glyc- erol was added to the supernatant at different concentra- tions. One independent calibration was plotted. The cali- bration curve showed a polynomial correlation with the following characteristics: a0 of 175746, a1 of –264298, a2 of 99366 and an r2 value of 0.8464
3. RESULTS AND DISCUSSION
3.1. Genetic Algorithm Results
500,000 individuals were generated to finally obtain 30 individuals (Table 1). Interestingly, these mutants are not
directly related to ethanol synthesis, so GA reaches to uncover non-obvius genes to optimize ethanol synthesis. First, we solved the wild LP problem to establish an initial point. The original value for ethanol production in E. coli at anaerobic conditions corresponds to 524 mmol·h−1·g−1.
Then, after running the GA over 115 overall iterations, we found genes whose regulation falls in [0.0557, 0.0591] flux ethanol interval. Interestingly, GA predicts overex- pression for all genes found, possibly due to restrictions imposed on the optimization problem regarding growth velocity.
3.2. Equations
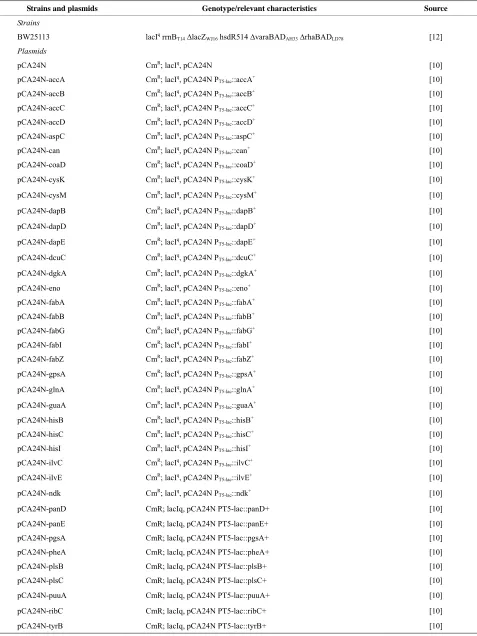
Table 2. Escherichia coli bacterial strains and plasmids used in this study. CmR is chloramphenicol resistance.
Strains and plasmids Genotype/relevant characteristics Source
Strains
BW25113 lacIq rrnB
T14∆lacZWJ16 hsdR514 ∆varaBADAH33∆rhaBADLD78 [12]
Plasmids
pCA24N CmR; lacIq, pCA24N [10]
pCA24N-accA CmR; lacIq, pCA24N P
T5-lac::accA+ [10]
pCA24N-accB CmR; lacIq, pCA24N P
T5-lac::accB+ [10]
pCA24N-accC CmR; lacIq, pCA24N P
T5-lac::accC+ [10]
pCA24N-accD CmR; lacIq, pCA24N P
T5-lac::accD+ [10]
pCA24N-aspC CmR; lacIq, pCA24N P
T5-lac::aspC+ [10]
pCA24N-can CmR; lacIq, pCA24N P
T5-lac::can+ [10]
pCA24N-coaD CmR; lacIq, pCA24N P
T5-lac::coaD+ [10]
pCA24N-cysK CmR; lacIq, pCA24N P
T5-lac::cysK+ [10]
pCA24N-cysM CmR; lacIq, pCA24N P
T5-lac::cysM+ [10]
pCA24N-dapB CmR; lacIq, pCA24N P
T5-lac::dapB+ [10]
pCA24N-dapD CmR; lacIq, pCA24N P
T5-lac::dapD+ [10]
pCA24N-dapE CmR; lacIq, pCA24N P
T5-lac::dapE+ [10]
pCA24N-dcuC CmR; lacIq, pCA24N P
T5-lac::dcuC+ [10]
pCA24N-dgkA CmR; lacIq, pCA24N P
T5-lac::dgkA+ [10]
pCA24N-eno CmR; lacIq, pCA24N P
T5-lac::eno+ [10]
pCA24N-fabA CmR; lacIq, pCA24N P
T5-lac::fabA+ [10]
pCA24N-fabB CmR; lacIq, pCA24N P
T5-lac::fabB+ [10]
pCA24N-fabG CmR; lacIq, pCA24N P
T5-lac::fabG+ [10]
pCA24N-fabI CmR; lacIq, pCA24N P
T5-lac::fabI+ [10]
pCA24N-fabZ CmR; lacIq, pCA24N P
T5-lac::fabZ+ [10]
pCA24N-gpsA CmR; lacIq, pCA24N P
T5-lac::gpsA+ [10]
pCA24N-glnA CmR; lacIq, pCA24N P
T5-lac::glnA+ [10]
pCA24N-guaA CmR; lacIq, pCA24N P
T5-lac::guaA+ [10]
pCA24N-hisB CmR; lacIq, pCA24N P
T5-lac::hisB+ [10]
pCA24N-hisC CmR; lacIq, pCA24N P
T5-lac::hisC+ [10]
pCA24N-hisI CmR; lacIq, pCA24N P
T5-lac::hisI+ [10]
pCA24N-ilvC CmR; lacIq, pCA24N P
T5-lac::ilvC+ [10]
pCA24N-ilvE CmR; lacIq, pCA24N P
T5-lac::ilvE+ [10]
pCA24N-ndk CmR; lacIq, pCA24N P
T5-lac::ndk+ [10]
pCA24N-panD CmR; lacIq, pCA24N PT5-lac::panD+ [10]
pCA24N-panE CmR; lacIq, pCA24N PT5-lac::panE+ [10]
pCA24N-pgsA CmR; lacIq, pCA24N PT5-lac::pgsA+ [10]
pCA24N-pheA CmR; lacIq, pCA24N PT5-lac::pheA+ [10]
pCA24N-plsB CmR; lacIq, pCA24N PT5-lac::plsB+ [10]
pCA24N-plsC CmR; lacIq, pCA24N PT5-lac::plsC+ [10]
pCA24N-puuA CmR; lacIq, pCA24N PT5-lac::puuA+ [10]
pCA24N-ribC CmR; lacIq, pCA24N PT5-lac::ribC+ [10]
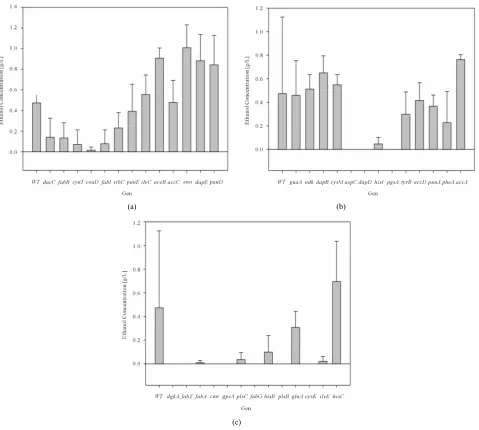
[image:6.595.59.536.102.738.2]inducing the expression of the genes finding (Figure 3(a)-(c)). Bacterial growth rate showed general zero
or-der kinetics for all cases (results not shown) falling within [0.05 0.07 h−1] range. Specifically, over-expressed
dcuC, aspC, gpsA, glnA, ilvE and hisB mutants displayed
a higher growth rate, this effect is deepened to lactose concentration.
The results obtained for ethanol production presented a positive effect when inducing expression on ethanol yield. For example accB, eno, dapE, and accA induction
(a) (b)
[image:7.595.61.540.157.587.2](c)
Figure 3. (a) Ethanol Concentration for E. coli BW25113 (Wild Type: WT), E. coli W3110/pCA24N-dgkA+, E. coli W3110/ pCA24N-fabZ+, E. coli W3110/pCA24N-fabA+, E. coli W3110/pCA24N-can+, E. coli W3110/pCA24N-gpsA+, E. coli W3110/
pCA24N-plsC+, E. coli W3110/pCA24N-fabG+, E. coli W3110/pCA24N-hisB+, E. coli W3110/pCA24N-plsB+, E. coli W3110/
pCA24N-glnA+, E. coli W3110/pCA24N-cysK+, E. coli W3110/pCA24N-ilvE+and E. coli W3110/pCA24N-hisC+ fermentations at
constant lactose dose (2 g/L) (b) Ethanol Concentration for E. coli BW25113 (Wild Type: WT), E. coli W3110/pCA24N-guaA+, E.
coli W3110/pCA24N-ndk+, E. coli W3110/pCA24N-dapB+, E. coli W3110/pCA24N-cysM+, E. coli W3110/pCA24N-aspC+, E. coli
W3110/pCA24N-dapD+, E. coli W3110/pCA24N-hisI+, E. coli W3110/pCA24N-pgsA+, E. coli W3110/pCA24N-tyrB+, E. coli W3110/pCA24N-accD+, E. coli W3110/pCA24N-puuA+, E. coli W3110/pCA24N-pheA+and E. coli W3110/pCA24N-accA+ fermen-
tations at constant lactose dose (2 g/L) (c) Ethanol Concentration for E. coli BW25113 (Wild Type: WT), E. coli W3110/pCA24N- dcuC+, E. coli W3110/pCA24N-fabB+, E. coli W3110/pCA24N-cynT+, E. coli W3110/pCA24N-coaD+, E. coli W3110/pCA24N-
fabI+, E. coli W3110/pCA24N-ribC+, E. coli W3110/pCA24N-panE+, E. coli W3110/pCA24N-ilvC+, E. coli W3110/pCA24N-accB+,
E. coli W3110/pCA24N-accC+, E. coli W3110/pCA24N-eno+, E. coli W3110/pCA24N-dapE+and E. coli W3110/pCA24N-panD+
fermentations at constant lactose dose (2 g/L). Mean and standard deviation was calculated from four repetitions at each condition. tandard deviation obtained was in the range of 1.6032 and 0.0995.
caused a minimum of 1.5 fold increase compared to its counterpart E. coli BW25113.
We did not find a direct cause that could explain the ethanol yield increment through overexpressing those genes as they are involved in non-direct metabolic path- ways: accB and accA in fatty acid biosynthesis, eno in glycolysis and dapE in lysine biosynthesis. The com- plexity of the connectivity of the metabolic network in a microorganism does not allow to elucidate trough a first view all the candidates susceptible of modifying its ex- pression so we believe that our approach constitute an interesting way elucidate stratagems for increasing etha- nol synthesis by uncovering the underpinnings of the network.
4. CONCLUSION
Mostly all the previous work related to the optimization of the production of ethanol using metabolic engineering are mainly concerned about the global maximum. In spite of this, the model predictions and experimental re- sults disagree. Considering that algorithms based on evo- lutionary programming could offer a considerable amount of individuals which are not necessarily related to the global maximum, we developed a bi-level platform able to maximize both biomass and ethanol production. Al- though in silico approaches are still incapable of pre- dicting the exact experimental results due to the fact that not all variables can be considered, our main objective was to look for an answer different from single solutions. Interestingly, we found out that our platform in fact uncovered genes that were not directly related to ethanol synthesis such as accB, eno, dapE, and accA.
5. ACKNOWLEDGEMENTS
We appreciate the support of the National BioResource Project (NIG, Japan): E.coli Strain for kindly providing us with the Keio Collection using for our experimental section. Also this work is funded by Vicerrectoria de investigaciones at Universidad de los Andes.
We also appreciate the support of Colciencias through the Program Jovenes Investigadores e Innovadores “Virginia Gutiérrez de Pineda”.
REFERENCES
[1] Glick, B.J. and Pasternak, J.J. (2003) The molecular bio- technology revolution. In: Molecular biotechnology: Prin- ciples and applications of recombinant DNA. ASM Press, Washington DC, 3-13.
[2] Kim, H.U., Kim, T.Y. and Lee, S.Y. (2008) Metabolic flux analysis and metabolic engineering of microorgan-isms. Molecular Biosystems, 4, 113-120.
doi:10.1039/b712395g
[3] Burgard, A.P., Pharkya, P. and Maranas, C.D. (2003) Opt- Knock: A bilevel programming framework for identify-ing gene knockout strategies for microbial strain optimi-zation. Biotechnology and Bioengineering, 85, 1-11. [4] Edwards, J.S. and Palsson, B.O. (2000) Metabolic flux
balance analysis and the in silico analysis of Escherichia coli k-12 gene deletions. BMC Bioinformatics, 1, 1-10. doi:10.1186/1471-2105-1-1
[5] Knorr, A.L., Jain, R. and Srivastava, R. (2007) Bayesian based selection of metabolic objective functions. Bioin- formatics, 3, 351-357. doi:10.1093/bioinformatics/btl619 [6] Reed, J.L., Vo, T.D., Schilling, C.H. and Palsson, B.O.
(2003) An expanded genome-scale model of Escherichia coli K-12 (iJR904 GSM/GPR). Genome Biology, 4, 1-12. doi:10.1186/gb-2003-4-9-r54
[7] Pharkya, P. and Maranas, C.D. (2005) An optimization framework for identifying reaction activation/inhibition or elimination candidates for overproduction in microbial systems. Metabolic Engineering, 8, 1-13.
doi:10.1016/j.ymben.2005.08.003
[8] Brooke, A., Kendrick, D., Meeraus, D. and Raman, R. (2001) GAMS: A user’s guide. GAMS Development Cor- poration, Washington DC.
[9] Patil, K.R., Rocha, I., Försoter, J. and Nielsen J. (2005) Evolutionary programming as a platform for in silico metabolic engineering. BMC Bioinformatics, 6, 1-12.
doi:10.1186/1471-2105-6-1
[10] Becker, S.A., Feist, A.M., Mo, M.L., Hannum, G., Pals- son, B.Ø. and Herrgard, M.J. (2007) Quantitative predict- tion of cellular metabolism with constraint-based models: The COBRA toolbox. Nature Protocols, 2, 727-738. doi:10.1038/nprot.2007.99
[11] Kitagawa, M., Ara, T., Arifuzzaman, M., Ioka-Nakamichi, T., Inamoto, E., Toyonaga, H. and Mori, H. (2005) Com- plete set of ORF clones of Escherichia coli ASKA library (a complete set of E. coli K-12 ORF archive): Unique re- sources for biological research. DNA Research, 12, 291- 299. doi:10.1093/dnares/dsi012
[12] Sambrook, J., Fritsch, E.F. and Maniatis, T. (1989) Mo-lecular cloning, a laboratory manual. Cold Spring Harbor Laboratory Press, Cold Spring Harbor.
[13] Vallejo, F., González, A., Posada, A., Restrepo, A. and Orduz, S. (1999) Production of Bacillus thuringiensis subsp. medellin by batch and fed-batch culture. B iotech-nology Techniques, 13, 279-281.