Studying the Interrelationship amongst Various Metrics
to Quantify the Merits of BIM Implementation in
Construction Industry of Developing Countries
Arnav Jain
Techture Structures Pvt. Ltd.Nagpur, India
Lakshay Aggarwal
Sociobuddy Technologies Pvt. Ltd.Delhi, India
Remica Aggarwal
School of Business University of Petroleum & EnergyStudies, Dehradun, India
Veena Aggarwal
Recventures Education Services Pvt. Ltd. Delhi, India
ABSTRACT
In todays’ world where cut throat competition exists in almost every industrial sector, construction industries in both developed as well as developing countries are no exception. Slow economic growth particularly in developing countries like India , tough competition and sometimes restructuring of construction industry puts a great deal of pressure on construction companies for the continuous improvement in the productivity as well as performance . All these factors have created a demand for virtual construction and modeling so as to avoid costs failure and risks associated with them. Building Information Modeling or BIM is getting popular even in developing countries because of the numerous benefits it provides to the architect, contractor or designer associate with architectural, engineering and construction (AEC) industry. However quantification of successful implementation of BIM is not an easy task. Various metrics associated with different aspects of BIM can be recognized. Present study therefore aims to identify a set of metrics that can be used by construction executives particularly in developing countries in assessing the success or failure of BIM implementation. Nine important identified metrics have been used further to study the inter-relationship amongst them using ISM methodology.
Keywords
Building information modeling; Construction Industry; Metrics; Developing countries
1.
INTRODUCTION
Technology is not new to the construction and building industries; however, the specific software, programs, and applications have evolved over the years, becoming manifested as different systems. If we go by the numerous publications in the field of Building Information Modeling/Management, Virtual Construction, Dimensional AutoCAD, Information Systems, Computer Information Construction and Information Technology etc. we will find that all of these systems help to integrate the many functions of the building industries to create a more interactive information sharing space. In 2011, the UK Cabinet Office published the Government Construction Strategy1. Which shows the clear positive intention that by 2016, it would require “collaborative 3D BIM with all project and asset information, documentation and data being electronic on all government projects. The aim was to achieve a 20% reduction in costs in the construction and operation of new buildings. This clearly means how important nowdays digital and virtual visualization of BIM phenomena is in AEC industry.Stake of
BIM in construction industry is increasing gradually in developing countries like India, Sri Lanka and Iran. 3D visualization has grown from 4D to 5D and even 6D in some expanding cities across the world. Complication of the project is connected to the class of construction such as residential, commercial, industrial, hospitality, R&D or public project construction. For government or public projects, state level PMC’s (project management consultancies) and central defence forces requires the BIM. On the whole, class of construction could be a vital and root feature deciding the applicability of BIM.
BIM provides a machine readable digital representation of building data in order to improve design, construction, and operation processes, and enhances building lifecycle functions [1]. Assessing these improvements has been the subject of attention in both industry and academia for decision making and developments. The number of research defining various approaches on different aspects of BIM has been increased recently to investigate how BIM has impacted projects within the industry. For example, some scholars assessed BIM impacts on project outcomes to compare BIM vs. non-BIM projects [2,3,4] whereas some scholars measured BIM to determine the maturity and capacity of BIM adoption [5]. Another quite popular method these days to assess this impact are via developing and measuring metrics. [6] tried to develop proactive metrics for assessing BIM processing). In a report by [7], six different metrics viz. percentage reduction of final construction cost; percentage of accelerated project completion project completion due to schedule compression; percentage of RFI reduction; percentage reduction in the number of reportable safety incidents; percentage of improved labor productivity and percentage reduction of site labor due to increased offsite fabrication were described to measure the impact of BIM on complex projects .
BIM in different aspects which includes tools, users, interactions and models in order to make improvements in early design and decision-making processes and also in facility operations and management. Further, to the best of the knowledge of author, no single study has comprehensively investigated the interrelationships amongst the various metrics that studies the impact of BIM. Therefore, the objectives of this review paper are to investigate various metrics in assessing the impact of BIM in various phases of construction process and to study the interrelationship amongst them using ISM methodology. The paper is organised as follows: Section 2 deals with the literature review. A review of the literature was performed to analyze the current information available with regards to benefits derived from BIM utilization, with the goals of: 1) determining the proper metrics for measurement of BIM benefits and 2) studying the interrelationship amongst them with the help of ISM methodology. Thereafter in section 3, ISM methodology is described along with the case problem, Mic-Mac analysis and finally the Diagraph. Section 4 presents the managerial implications. Section 5 presents the conclusions and directions for future research.
2.
LITERATURE REVIEW
A list of research papers were searched within Google scholar, Mendeley software database. Metrics have been identified using the keywords such as Building Information Modeling metrics, metrics for BIM implementation, BIM implementation in construction industries, user experience metrics, BIM metrics etc. over internet. This paper is largely adapting the metrics or key performance indicators recognized by [2] with respect to construction industry. In another paper by [8], first a general framework for BIM assessment is provided as per three zones viz. What aspect of BIM is being assessed in terms of BIM tools, individual team BIM users, BIM process which includes human, computer, human interaction and collaboration and final product model the purpose of BIM is being assessed in terms of improvement in the industry, improvement in the whole business , improvement in feasibility analysis and owner decision making , improvement in design and engineering practice , improvement in construction and fabrication practice and improvement in facility management , operation and maintenance and type of metric is being assessed which includes lag , lead and real time and thereafter various metrics have been described under different categories as per different references in construction research . Present paper focuses on BIM implementation in construction industry and for this majorly follows the research [2], following metrics have been identified in the sector of building and construction industry and research which are categorised in to four main heads : cost metrics which includes architectural engineering design costs , assembly non-variable costs , allowance for BIM design, laser scanning , 3D background model creation costs, 3D block creation allowance , collaboration software costs, surveying and training costs. Investment metrics which include project cost and pilot costs; return metrics which include request for information and change orders costs. Additional metrics which include architectural and engineering costs as percentage of total awarded A&E costs, avoidance log and associated costs, offsite pre-fabrication man-hours for contractors, reconciliation of savings from designer using BIM and reconciliation of savings from contractors using BIM. The various metrics have been described as follows:
1. Architectural engineering and design costs (AEDC): The AEDC costs were based on the costs incurred as a result of the BIM design of the three specific functional areas viz. design, assembly non-variable costs, and an allowance for the BIM design.
2. 3D background model creation costs (BMCC): represents how much of the total factory design costs are represented by the BIM tools. The 3D background model creator costs consists of laser scanning, background model creation, 3D block creation allowance, hardware/server for storage, collaboration software costs , surveying, and training costs. The 3D background model creation was carried out for the entire factory and not solely the functional areas that would be receiving BIM design. Thus, the 3D background model creator costs are higher as they are applicable to the entire factory.
3. Project cost (PC): The total project cost which includes all major and minor costs associated with different phases and workflow of the project .
4. Pilot costs (PiC): costs incurred while taking a pilot project. These projects are usually taken when the founder knows the type of project which can best implement the standards which can help him in the long run. Further he/ she can always revert back to the usual workflow to complete the project if anything goes wrong but do suffers the limitation of not exploring the full capabilities of BIM.
5. Request for information (RFI): The return metrics are in accordance with the objective of this paper to create a value-based quantification of BIM benefits. This includes request for information. Values were reported with respect to Non-BIM projects, BIM projects, and percent change or differential in units of quantity per assembly, cost of change per cost of total project , and actual versus standard duration in order to promote a valid comparison with other projects.
6. Change order costs (COC): These costs are calculated as cost of change divided by total cost of the project. 7. Architectural and engineering costs as percentage of total
awarded A&E costs (AEC): How much of the AEDC costs is due to the costs incurred as a result of completing both Non-BIM and BIM design packages.
8. Reconciliation of savings from designer using BIM (RSD): This metric represents the addition of the costs of design and savings of construction in these areas utilizing BIM.
9. Reconciliation of savings from contractors using BIM (RSC): This metric represents the addition of costs of contractors but savings of costs as well and therefore also reveals that contractors would provide savings if these areas utilized BIM.
3.
INTERPRETIVE STRUCTURAL
MODELING METHODOLOGY
elements and establish a contextual relationship amongst them . Thereafter, develop a structural self -interaction matrix (SSIM) using V, A, X & O where the symbols have the following meanings i.e. V for the relation from i to j but not in both directions; A for the relation from j to i but not in both directions; X for both direction relations from i to j and j to i; and O if the relation between the variables does not appear valid. Using SSIM, initial reachability matrix can be formed which has all values in binary form. A final reachability matrix is formed after removing transitivity from initial reachability matrix. From the final reachability matrix, the reachability set and antecedent set for each criterion and for each element is found [9]. The element for which the reachability and intersection sets are the same is the top-level element. At every iteration a top level element is identified which is removed in the next iteration. After all the elements have been identified at different level of hierarchy, a Mic-mac analysis (based on the driving power and dependence power) and a diagraph can be formed Researchers are using ISM technique in various fields such as green value chains [10], reverse logistics adoption [11], total productive maintenance implementation [12], total quality management implementation [13] and total productive maintenance implementation [14].
4.
DEVELOPMENT OF ISM MODEL
This section develops the ISM model for studying the interrelationships amongst the metrics in building and construction industry. Ten important metrics are considered viz. AEDC, BMCC, PC , PiC , RFI , COC, TS, AEC , RSD and RSC.
4.1
Construction of Structural Self
-Interaction Matrix (SSIM)
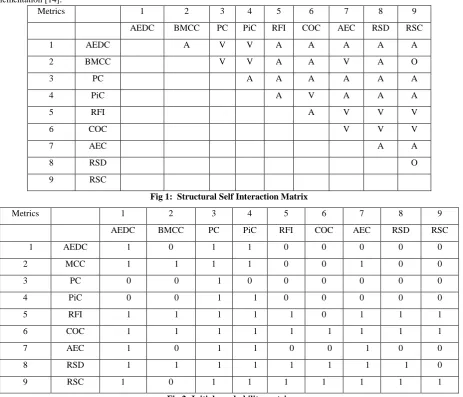
This matrix gives the pair-wise relationship between two variables i.e. i and j based on VAXO. SSIM has been presented below in Fig 1.
4.2
Construction of Initial Reachability
Matrix and final reachability matrix
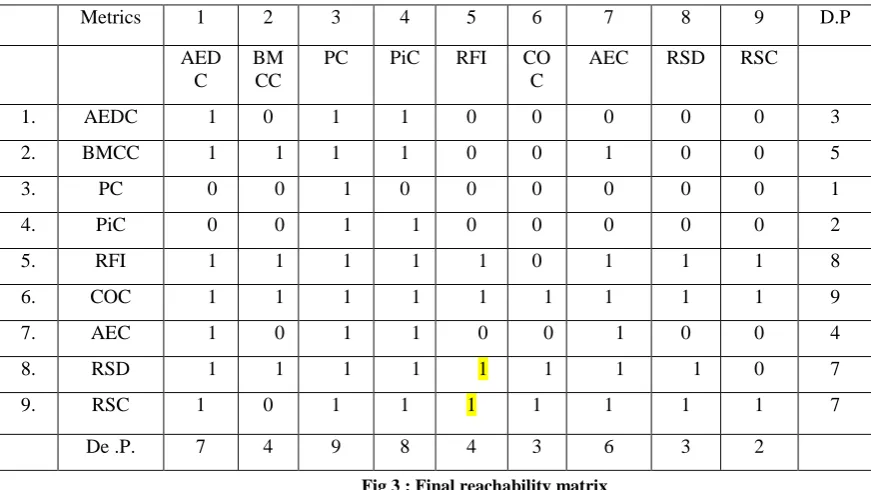
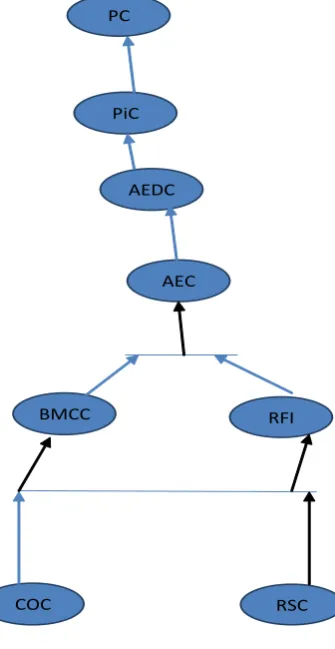
The SSIM has been converted in to a binary matrix called the initial reachability matrix shown in fig. 2 by substituting V, A, X, O by 1 or 0 as per the case. After incorporating the transitivity, the final reachability matrix is shown below in the Fig 3.
Metrics 1 2 3 4 5 6 7 8 9
AEDC BMCC PC PiC RFI COC AEC RSD RSC
1 AEDC A V V A A A A A
2 BMCC V V A A V A O
3 PC A A A A A A
4 PiC A V A A A
5 RFI A V V V
6 COC V V V
7 AEC A A
8 RSD O
9 RSC
Fig 1: Structural Self Interaction Matrix
Metrics 1 2 3 4 5 6 7 8 9
AEDC BMCC PC PiC RFI COC AEC RSD RSC
1 AEDC 1 0 1 1 0 0 0 0 0
2 MCC 1 1 1 1 0 0 1 0 0
3 PC 0 0 1 0 0 0 0 0 0
4 PiC 0 0 1 1 0 0 0 0 0
5 RFI 1 1 1 1 1 0 1 1 1
6 COC 1 1 1 1 1 1 1 1 1
7 AEC 1 0 1 1 0 0 1 0 0
8 RSD 1 1 1 1 1 1 1 1 0
[image:3.595.68.532.316.713.2]9 RSC 1 0 1 1 1 1 1 1 1
Fig 3 : Final reachability matrix
D.P : Driving power ; De.P : dependence power
4.3
Level Partition
[image:4.595.55.557.351.685.2]From the final reachability matrix, reachability and final antecedent set for each factor are found. The element for which the reachability and intersection sets are same are the top-level element in the ISM hierarchy. After the identification of top level element, it is separated out from the other elements and the process continues for next level of elements. Iterations have been shown from table 2 – table 8 below.
Table 2 : Iteration I
Sr. No
Reachability set
Antecedent set
Intersection set
Iteration
1 3 1,2,3,4,5,6,7,8
,9
3
I
2 3,4 1,2,4,5,6,7,8,9 4
3 1,3,4 1,2,5,6,7,8,9 1
4 1,3,4,7 2,5,6,7,8,9 7
5 1,2,3,4,5,7 2,5,6,8 2,5
6 1,3,4,5,6,7,8 6,8,9 6,8
7 1,2,3,4,5,6,7,8 ,9
6 6
8 1,3,4,6,7,8,9 6,9 6,9
Table 3 : Iteration II
Sr. No
Reachability set
Antecedent set
Intersection set
Iteration
2 4 1,2,4,5,6,7,8,
9
4
II
3 1,4 1,2,5,6,7,8,9 1
4 1,4,7 2,5,6,7,8,9 7
5 1,2,4,5,7 2,5,6,8 2,5
6 1,4,5,6,7,8 6,8,9 6,8
7 1,2,4,5,6,7,8,9 6 6
8 1,4,6,7,8,9 6,9 6,9
Table 4 : Iteration III
Sr. No.
Reachability set
Antecedent set
Intersection set
Itera tion
3 1 1,2,5,6,7,8,9 1
III
4 1,7 2,5,6,7,8,9 7
5 1,2,5,7 2,5,6,8 2,5
6 1,5,6,7,8 6,8,9 6,8
7 1,2,5,6,7,8,9 6 6
8 1,6,7,8,9 6,9 6,9
Metrics 1 2 3 4 5 6 7 8 9 D.P
AED C
BM CC
PC PiC RFI CO
C
AEC RSD RSC
1. AEDC 1 0 1 1 0 0 0 0 0 3
2. BMCC 1 1 1 1 0 0 1 0 0 5
3. PC 0 0 1 0 0 0 0 0 0 1
4. PiC 0 0 1 1 0 0 0 0 0 2
5. RFI 1 1 1 1 1 0 1 1 1 8
6. COC 1 1 1 1 1 1 1 1 1 9
7. AEC 1 0 1 1 0 0 1 0 0 4
8. RSD 1 1 1 1 1 1 1 1 0 7
9. RSC 1 0 1 1 1 1 1 1 1 7
Table 5 : Iteration IV
Sr. No.
Reachability set
Antecedent set
Intersection set
Itera tion
4 7 2,5,6,7,8,9 7
IV
5 2,5,7 2,5,6,8 2,5
6 5,6,7,8 6,8,9 6,8
7 2,5,6,7,8,9 6 6
[image:5.595.37.298.77.532.2]8 6,7,8,9 6,9 6,9
Table 6: Iteration V
Sr. No.
Reachability set
Antecedent set
Intersection set
Itera tion
5 2,5 2,5,6,8 2,5
V
6 5,6,8 6,8,9 6,8
7 2,5,6,8,9 6 6
[image:5.595.346.514.337.662.2]8 6,8,9 6,9 6,9
Table 7 : Iteration VI
Sr. No.
Reachability set
Antecedent set
Intersection set
Itera tion
6 6,8 6,8,9 6,8
VI
7 6,8,9 6 6
8 6,8,9 6,9 6,9
Table 8 : Iteration VII
Sr. No.
Reachability set
Antecedent set
Intersection set
Itera tion
8 9 9 9 VII
4.4
Classification of factors
Fig. 4 below shows the driving power and dominance diagram. The critical success factors described earlier are classified in to four clusters viz. autonomous factor, dependent factors, linkage factors and independent factors (mentioned in Fig 4 below). As it can be seen that BMCC could be an autonomous criteria. Criteria COC, RFI RSC, RSD are drivers . Criteria such as AEC , AEDC, PC and PiC are dependent criteria.
Fig . 4: Driving power and dependence diagram
4.5
SM model
An ISM model is developed ( as shown in fig. 5 below ) after arranging the elements as per their interaction or dependence relationships.
Fig . 5. ISM model
D R I V I N G P O W E R
9 COC Linkage
8 Drivers RFI
7 RSC RSD
6
5 BM
CC
4 Autonomous AEC Dependent
3 AED
C
2 PiC
1 PC
1 2 3 4 5 6 7 8 9
Figure 4.4 : Diagraph for Metrics for successful implementation of BIM in developing countries
PiC
AEC
RFI
RSC COC
BMCC
5.
MANAGERIAL IMPLICATIONS AND
CONCLUSIONS
This article has significant managerial and practical implications. Through this study we get an insight regarding the key enablers of successful implementation of BIM in developing countries. This article further helps in understanding the role of BIM in context of AEC industry particularly building and construction. The results of this article help the BIM practitioner in segregation of important metrics to implement BIM initiatives in AEC industry. Through this article managers can easily understand how a metric is affecting any other metric, thus they can make their long term and short term strategic decision that fulfill the requirement of stakeholder, regulatory bodies and customers. A metric is of more tactical orientation if it has weak dependence power and high driving power. At the same time a metric having low driving power and high dependence power will be more performance oriented. This practice will help managers to focus on metrics accordingly. Along with the above listed implications, this study has certain specific implication as given below:
Role for policymakers
Government has a major role in implementing BIM successfully in AEC industry of any country by providing proper support and regulations. Government’s rules and regulations is capable enough to change the attitude of the consumers, changes in market policies, incentives for organizations to choose BIM practices in building and construction.
Allocation of proper funds and resources
Adequate resources and funds are very important for any organization in implementing BIM initiatives. So, top management should ensure adequate funds and better resources to initiate new technologies and modern machines for successful implementation of BIM. Management should also try to locate it’s funds in research and development activities so that new BIM practices can be induced from time to time.
Delivering better quality models
On one hand, poor-quality model negatively impacts design integration, procurement process, and construction realization and management [14] on the other hand, it impacts building functions and performance during its operation. As per [15], human issues are most important challenges to widespread adoption and well implementation of BIM and developing better quality models. The reason being BIM is often implemented by error prone people with weak communication, collaboration and training. The stronger an easier the human computer interaction the more successful will be the BIM implementation.
Avoidance of waste
According to [16], construction industry suffers from several challenges, including very low productivity, high energy and operation cost impact and huge waste in construction. [1] describe how successful implementation of BIM can mitigate such challenges and how different parties can benefit from BIM from different perspectives. For example, BIM is owners favorite with view to increasing building performance, reducing financial risks, shortening a project schedule, obtaining reliable and accurate cost estimates and optimizing facility management and maintenance. An architect will use
estimation, construction planning and controlling, offsite fabrication, and facilitated handover are the BIM applications [1].
Formal certification system
As [17] postulates, “Also, a valid set of BIM metrics will lay the foundations for a formal certification system which can be employed by industry leaders, governmental authorities and large facility owners/procurers to pre-select BIM service providers and attest to the quality of their deliverables.” Furthermore, [18] suggests “social and organizational contexts need to be taken into consideration to understand the adoption of this BIM technology.”
Future directions
Although the research is exploratory in nature, a further validation of the metrics can be performed by circulating a questionnaire amongst the experts and performing structural equation modeling. Further, ISM based approach explains only hierarchical model and not disclose the relative weightage of each enabler and hence as an extension , analytic network process can be done to know about relative weightage [19]. Also an advanced ISM approach could be help to study the context of the relationships of the proposed model in future research.
6.
ACKNOWLEDGEMENT
Authors are thankful to Prof. S.P Singh, DMS IIT Delhi for the valuable inputs regarding ISM methodology which helped the authors substantially while writing this piece of work.
7.
REFERENCES
[1] Eastman, C., Teicholz, P., and Sacks, R., Liston, K. 2011. BIM Handbook: A Guide to Building Information Modeling for Owners, Managers, Designers, Engineers and Contractors (2nd Edition). Hoboken, NJ, USA: Wiley.
[2] Barlish, K., and Sullivan, K. 2012. How to measure the benefits of BIM - A case study approach. Automation in Construction, 24(0), 149-159.
[3] Chelson, D. E. 2010. The Effects of Building Information Modeling on Construction Site Productivity. University of Maryland, College Park, USA.
[4] Coates, P., Arayici, Y., Koskela, L., Kagioglou, M., Usher, C. and O’Reilly, K.. 2010. The key performance indicators of the BIM implementation process. Paper presented at the The International Conference on Computing in Civil and Building Engineering, Nothingham, UK.
[5] Sebastian, R. and Van Berlo, L. 2010. Tool for Benchmarking BIM Performance of Design, Engineering and Construction Firms in The Netherlands. Architectural Engineering and Design Management, 6(4), 254-263.
[6] Senescu, R., Haymaker, J., Meza, S. and Fischer, M. 2013. Design Process Communication Methodology: Improving the Effectiveness and Efficiency of Collaboration, Sharing, and Understanding. Journal of Architectural Engineering.
Research, Computing in Civil and building engineering, 496-503.
[9] Warfield, J.N. 1974. Developing interconnection matrices in structural modeling. IEEE Transactions on Systems, Man, and Cybernetics, (1), 81-87.
[10] Mathiyazhagan, K., Govindan, K., NoorulHaq, A. and Geng, Y. 2013. An ISM approach for the barrier analysis in implementing green supply chain management. Journal of Cleaner Production, 47, 283-297.
[11] Ravi, V. and Shankar, R. 2005. Analysis of interactions among the barriers of reverse logistics. Technological Forecasting and Social Change, 72(8), 1011-1029. [12] Singh, M., Sachdeva, A. and Bhardwaj, A. 2014. An
interpretive structural modelling approach for analysing barriers in total productive maintenance implementation. International Journal of Industrial and Systems Engineering, 16(4), 433-450.
[13] Talib, F., Rahman, Z. and Qureshi, M.N. 2011. Analysis of interaction among the barriers to total quality management implementation using interpretive structural modeling approach. Benchmarking: An International Journal, 18(4), 563-587.
[14] Crotty, R. 2012. The Impact of Building Information Modelling: Transforming Construction: SPON Press. [15] Deutsch, R. 2011. BIM and Integrated Design: Strategies
for Architectural Practice:John Wiley & Sons.
[16] Smith, D. K., and Tardif, M. 2009. Building Information Modeling: A StrategicImplementation Guide for Architects, Engineers, Constructors, and Real Estate Asset Managers: John Wiley & Sons.
[17] Succar, B. 2010. Building information modeling framework: a research and delivery foundation for industry stakeholders, Automation in Construction 18, 357–374
[18] Taylor, J.E. 2007. Antecedents of successful three-dimensional computer-aided design implementation in design and construction networks, Journal of Construction Engineering and Management, 933–1002. [19] Saaty, T.L. 2005. Theory and Applications of the