Performance Evaluation of e-Learning Applications in
UMTS Network
Fatuma Simba
University of Dar es Salaam
Dar es Salaam, Tanzania
Lena Trojer
Blekinge Institute of
Technology
Karlshamn, Sweden
Bakari Mwinyiwiwa
University of Dar es Salaam
Dar es Salaam, Tanzania
ABSTRACT
The aim of this paper is to study the effect of traffic differentiation and priority scheduling in providing Quality of Service (QoS) for e-learning applications in Universal Mobile Telecommunication System (UMTS) networks. A simulation model of the UMTS network has been developed and used to study performance of e-learning applications as perceived by users. Priority scheduling is used to prioritize traffic between e-learning and other conventional users according to their QoS requirements. Simulation results show that a UMTS network configured with traffic differentiation and priority scheduling can deliver e-learning services with page response time of less than 4 seconds. This performance is within the acceptable values of web-based applications quality of service.
Keywords
e-learning, UMTS, Quality of Service (QoS), Traffic Differentiation, Priority Scheduling.
1.
INTRODUCTION
The Universal Mobile Telecommunications System (UMTS) has the potential to offer different types of services ranging from voice, data, multimedia streaming and video conferencing in a mobile environment. The UMTS networks are widely deployed in many countries. The networks improve performance of data application by offering high data rate and a reduced delay. Due to their improved performance and a wide deployment, UMTS networks are envisioned as a potential solution to deliver e-Learning services in education, especially in developing countries. e-Learning refers to teaching and learning that is facilitated and supported by Information and Communication Technology (ICT). It is simply a medium for delivering learning and it covers a wide range of activities from supported learning, to blended or hybrid learning (the combination of traditional and e-learning practices), to learning that occurs 100% online. There is a wide variety of applications, that are used to facilitate delivery of e-learning services. They span static or dynamic web pages with text, diagrams or pictures, auto-corrected quizzes for self assessment, distance lecturing, video clips, narrated slide shows, instant messaging and video conferencing.
Therefore, e-learning traffic is expected to co-exist with conventional traffic from other non-e-Learning users. It is expected that conventional services (non e-Learning traffic) will have an impact on the e-learning service performance. It is also challenging to simultaneous support multi-services with different quality of service requirements in the UMTS networks. This challenge is more critical in access network where air interface resources are usually scarce. However, Radio Resource Management (RRM) in UMTS network is responsible for efficient utilization of the air interface. One of the responsibilities of RRM is to guarantee Quality of Service (QoS) negotiated during Packet Data Protocol (PDP) context
setup to establish a radio access bearer. During establishment of radio access bearer, user equipment requests quality of service profile required for that access bearer. The core network provides the requested QoS profile over the Iu interface to the radio access network. When radio resources are scarce, the QoS profile parameters help the packet scheduler to decide how to allocate the radio resources to different users.
Public communication networks such as UMTS, are basically configured as best effort, where all services share network resources equally; they get the same bit rate and experience the same delay. Network dimensioning is done in such a way that, bit rate or delay fulfils the most stringent requirements of the services provided in that network. Consequently, other services such as the background type of service, enjoys same quality, which is unnecessarily good and wastage of network resources [1]. Moreover, traffic profiles across these networks are widely heterogeneous with respect to volumes of data per customer and QoS requirements. There is definitely unbalance between light users on voice only service or reading e-mail and heavy users on video streaming or multimedia-based video conferencing. When the network is loaded, this unbalanced usage of network resources can result into heavy users dominating the network. In such a situation, deploying e-learning services in a network configured on best effort basis, can compromise their performance due to presence of traffic from other users. Therefore, it is useful to take necessary measures to guarantee QoS for the mission-critic applications such as e-learning.
The rest of the paper is organized as follows: Section 2 presents an overview of QoS architecture of the UMTS network and radio resource management. Section 3 is about modeling UMTS network and applications´ traffic for performance evaluation. Section 4 describes simulation scenarios. Section 5 presents simulation results and their respective discussions. Section 6 presents the conclusion and outlook for further research.
2.
UMTS QUALITY OF SERVICE
ARCHITECTURE AND RADIO
RESOURCE MANAGEMENT (RRM)
[image:2.595.56.278.323.506.2]UMTS network can provide triple-play services comprising of data, video and voice. The services traffic pass through different network nodes on their way from a source terminal equipment (TE) to the destination TE. Therefore, the end-to-end QoS provisioning in UMTS network depend-to-ends on the performance of three distinct parts: the terminal equipment/mobile termination (TE/MT) bearer service, the UMTS bearer service, and the external bearer service as illustrated in Figure 1. A bearer service in UMTS network incorporates all aspects needed to provide a pre-defined quality to a particular service [1], [11], [12].
Fig 1: UMTS QoS architecture [1]
In UMTS network, when a terminal equipment gets connected to the network, a tunnel is established between the terminal and the Gateway GPRS Support Node (GGSN). This tunnel is known as Packet Data Protocol (PDP) context. It provides the UMTS bearer services. QoS is one of the most important attributes of a PDP context and is negotiated during PDP context setup. It indicates the type of traffic class (conversational, streaming, interactive or background), for which the context is negotiated.
Radio Resource Management (RRM) is used to guarantee the QoS negotiated during PDP context setup in order to maintain the planned coverage area and to offer the planned capacity. In general, RRM is responsible for efficient utilization of the air interface resources. RRM algorithms are divided into five groups: handover control, power control, admission control, load control, and packet scheduling functionalities. Handovers are responsible in cellular systems to handle mobility of the User Equipments (UEs) across cell boundaries. Power control is needed to keep the interference levels at minimum in the air interface. Admission control, load control and packet scheduling are responsible to guarantee quality of service and to maximize the system throughput of different traffic mix with different QoS requirements [1]. Admission control and
load control specifications are set during radio network planning while a packet scheduling scheme is a configurable parameter.
WCDMA packet scheduling functionalities are located in the Radio Network Controller (RNC). There are user-specific packet scheduling and cell-specific packet scheduling. The user-specific packet scheduling controls utilization of transport channels and their bit rates according to traffic volume. Cell-specific packet scheduling controls sharing of the radio resources, it divides the non-real time capacity between simultaneous users. The target of the cell-specific scheduling is to use efficiently all the remaining cell capacity for non-real time connections while maintaining interference level within the planned values so that real time connections are not affected. The cell-specific scheduling operates periodically. This period is a configurable parameter and its value typically ranges from 100ms to 1s. If the load exceeds the target, the packet scheduler can decrease the load by decreasing bit rate of the packet bearer. If the load is less than the target, it can increase the load by allocating higher bit rates.
During establishment of radio access bearer, user equipment requests quality of service profile required for that access bearer. The core network provides the requested QoS profile (parameters and values) over the Iu interface to the WCDMA radio access network. The aim of the QoS profile is to specify QoS requirements of different users. When radio resources are scarce, the QoS profile parameters help the packet scheduler to decide on how to allocate capacity to different users based on their priority parameters specified in their QoS profile.
3.
MODELLING UMTS NETWORK
AND APPLICATIONS TRAFFIC
The UMTS network model was developed by using OPNET modeler 16.0. The modeler is a discrete event simulator, which provide environment to support modeling of communication systems. The simulated UMTS model is as shown in Figure 2. It represents multiple users (UEs) accessing web based e-learning applications from an application server, abbreviated as App-server via the UMTS network.
Fig 2: The simulated model of UMTS network
[image:2.595.319.541.516.650.2]streaming, video conferencing and distance lecturing which consists of audio and multimedia contents. The e-learning applications were represented by source traffic models during simulations. Source traffic models are the representation of an application behavior in a network. They are designed to generate an input load for evaluation, either analytically or by simulation [13], [14]. The light-media and rich-media e-learning applications are both web based applications. The term web traffic comprises of all Hyper Text Transfer Protocol (HTTP) traffic generated during a session with a typical web browser in a particular web based application. Therefore, it is necessary to define source traffic models which represents characteristics of web based e-learning applications.
The OPNET modeler has built-in standard source traffic models representing different applications. Therefore, in this work, the standard built-in OPNET´s HTTP model was used to generate HTTP-based e-learning traffic into the network model for simulation. Two types of e-learning applications called Online-Learning and Quiz & Tests were configured to represent rich-media and light-media applications respectively. Their respective parameters and values are shown in table 1.
Table 1. Parameter and values specified for http traffic model
Attribute Value
Online-Learning (Heavy Browsing)
HTTP Specification
HTTP 1.1
Page Inter-arrival Time
Exponential (60)
Page Properties Objects Size Objects per
Page
Constant (1000) Constant (1) Medium image Constant (5)
Server Selection Initial Repeat
Probability
Page per
Server
Browse Exponential
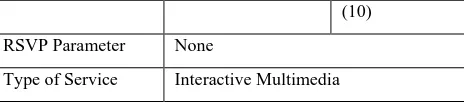
(10) RSVP Parameter None
Type of Service Interactive multimedia
Quiz & Tests (Light Browsing)
HTTP Specification HTTP 1.1 Page Inter-arrival
Time
Exponential (720)
Page Properties Objects Size Objects per
Page
Constant (500) Constant (1) Small image Constant (5)
Server Selection Initial Repeat
Probability
Page per
Server
Browse Exponential
(10) RSVP Parameter None
Type of Service Interactive Multimedia
4.
SIMULATION SCENARIOS
Simulations for performance evaluation of e-learning applications in UMTS networks were performed in different scenarios. Scenario 1 was meant to verify if the developed model operated as it was intended to. Model verification is the process of determining, if the simulated model is correctly implemented as well as if it functions correctly. This was accomplished by running the scenario 1 simulation in the OPNET´s debugger mode. Statistics were collected to check, if there were no errors, which means that the model was correctly implemented and functioning properly.
Scenario 2 was for model validation. This is to investigate, if the simulated model behaves as the real system it represents. Model validation is the process of determining if a simulation model correctly represents the real system. A simulation model can be validated by being examined by experts (expert intuition), by comparing simulation results with measurements results from a real system, or by comparing simulation results with theoretical results. Among the three methods, comparing simulation results and measurements from a real system is the most reliable way of validating a simulation model and it was the primary validation method used in this paper. Real network measurement results were taken from the work of Hari and Holma [1], who conducted capacity measurement from a single cell UMTS network configured to offer 384kbps packet data rate in the downlink direction. In this paper, the network model was as well simulated to represent a single cell configured to offer 64/384kbps data rate at uplink/downlink respectively. Scenario 3 aimed at establishing baseline (best case) data of e-learning application performance. This is a simulation of only e-learning applications in the network without any other traffic. The two e-learning applications were defined and their respective source traffic models were configured. The configured parameter values for the e-learning source traffic models are as shown in table 1 in section 3.
[image:3.595.314.546.72.123.2]Fig 3: Best effort network configuration [1]
Table 2. Parameter and values for interactive and background traffic specified for http traffic model
Traffic Differentiation
Configuration
Best Effort Configuration
QoS Parameters e-Learning
Traffic
Contending (Background) Traffic
e-Learning Traffic
Contending (Background) Traffic
UMTS Logical Channel configuration
Higher layer data to logical channel mapping
DiffServ-Based DiffServ-Based ToS-Based ToS-Based
Logical channel definition
ToS =
Interactive (QoS2) --> Interactive multimedia
ToS=Background (QoS3) --> Background
ToS=Interactive (QoS2) --> Interactive multimedia
ToS=Background (QoS3) --> Background
DiffServ=AF23 DiffServ =AF22 DiffServ =AF23
DiffServ =AF22
Priority =3 Priority=0 Priority=0 Priority=0
Weight = 0 Weight = 0 Weight = 0 Weight = 0
UMTS logical signaling channel configuration
Queuing Scheme Strictly Priority Strictly Priority Weighted Round Robin
Weighted Round Robin
UMTS QoS profile configuration
Delivery of erroneous SDU
No No No No
Max. Bit rate Uplink (kbps)
64 64 64 64
Max. bit rate Downlink (kbps)
384 384 384 384
Delivery order No No No No
Max. SDU size (octet)
1,500 1,500 1,500 1,500
Transfer delay (ms) _ _ _ _
Allocation/Retention Priority
Priority 3 Lowest priority Priority 3 Lowest priority
Mapped logical channel queuing scheme
Strictly priority Strictly priority Weighted Round Robin
[image:4.595.92.505.295.768.2]The final scenario 5 aimed at studying the effect of configuring traffic differentiation in a network in order to guarantee the required QoS for e-learning applications. Traffic differentiation is illustared in Figure 4. Priority scheduling was used to differentiate traffic where e-learning traffic was assigned higher priority than contending background traffic as shown in Table 2. From users´ perspective, page response time is the relevant performance metric for web-based applications QoS. Therefore, it was used as a key performance parameter.
Fig 4: Traffic differentiation network configuration [1]
5.
SIMULATION RESULTS AND
DISCUSSIONS
5.1
Results for model verification and
validation (scenario 1 and 2)
Results from the discrete event simulation log table showed that the implemented UMTS model runs successful without errors. This verified that the UMTS model was correctly implemented.
Results of measurements conducted by Hari & Holma [1] from the real world operational networks showed that a single cell configured to offer 384kbps data rate in the downlink direction can only serve seven (7) simultaneous users. The maximum number of simultaneous users is determined by the pole capacity which is always limited by the maximum downlink power of the cell. Therefore more than seven users shall experience much longer delays as the cell is already at its maximum power.
The simulated network model was developed to represent a single cell of the UMTS network offering web based e-learning services. Users were added to the model one at a time up to the optimal number where value of the page response time was at maximum (4seconds) according to the threshold set for acceptable performance of a web browsing applications [15], [16]. Interactive application performance parameters and their acceptable range of metrics (values) are shown in Table 3.
Table 3: Performance Targets for Interactive Services [15],[17]
Medium Application Degree of
Symmetry
Typical Data
rates /Amount of data
Key performance parameters and target values
One way delay (Response Time)
Delay variation within a cell
Information loss
Audio Voice messaging
Primarily one-way
4 - 32kbps <1 sec for playbacks <2 sec for records
<1 msec < 3% packet loss
Data Web
Browsing
Primarily one-way
~ 10 KB < 4 sec/page NA Zero
Data Transaction services - high priority (e.g e-commerce. ATM)
Two-way < 10 KB < 4 sec NA Zero
Data E-mail (server access)
Primarily one-way
< 10 KB < 4 sec NA Zero
[image:5.595.88.513.402.685.2]Fig 5: e-learning application´s page response time for seven users.
[image:6.595.53.280.70.228.2]When the eighth user was added, users were experiencing a page response time of 4seconds or more than 4seconds, as shown in Figure 6, which is a violation of the web based application´s performance target. This is because the cell was already at its maximum pole capacity, hence additional user caused the delay that resulted into performance target violations. Results are inline with field measurement done by Hari & Holma [1]. Since simulation results tally properly with measurement results, hence the model is a valid representation of the UMTS single cell network configured to offer 64/384kbps data rates in uplink/downlink respectively.
Fig 6: e-learning application´s page response time for eight users.
5.2
Baseline (best case) e-learning
application performance results (scenario
3).
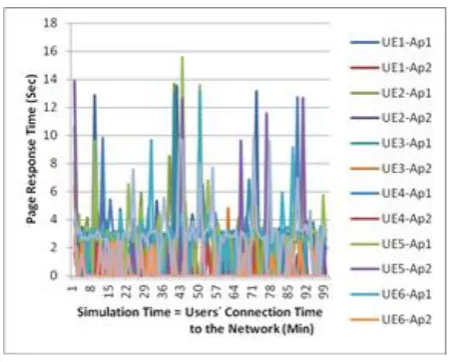
[image:6.595.55.279.376.551.2]The simulated model was configured to serve two e-learning applications in a best effort basis and there was no contending traffic introduced in the model. Statistics were collected for applications page response time as shown in Figure 7. The obtained results show that most of the time users were experiencing a page response time of less than 4seconds, which is within the acceptable performance values.
Fig 7: Average page response times in the best case scenario
5.3
Results of best effort configuration
(scenario 4).
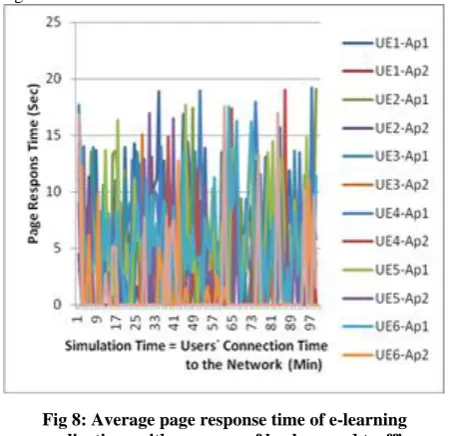
Within the network cell vicinity in the real world situation, e-learning applications share network resources with other applications such as the conventional telephone (voice) services, short messaging services (sms) and other web based data services. In this scenario, the simulated network model was configured to serve both e-learning and contending traffic in a best effort basis. Page response time results of the e-learning applications with the presence of contending traffic, configured as background updates of database are shown in Figure 8.
Fig 8: Average page response time of e-learning applications with presence of background traffic
Page response times are more than four seconds (4Sec), which is out of the acceptable performance values. The increase in the page response time is caused by increase in delay due to presence of background traffic.
5.4
Results of traffic differentiation
configuration (Scenario 5)
[image:6.595.316.541.438.656.2]differentiation and priority scheduling are presented in Figure 9. The results showed an improvement in the page response time, most of the time, users were experiencing page response of less than 4seconds.
Fig 9: Average page response time of e-learning applications with traffic differentiation and priority
scheduling
6.
CONCLUSION
This paper presented a simulation modeling of UMTS network. The simulated model was used to evaluate performance of web based e-learning applications. Interactive and background UMTS application traffic classes were used to represent the simulated web based e-learning applications. Results showed that performance of e-learning applications delivered in a network, which is configured in best effort basis, achieved a page response time of more than 4seconds, which was out of the acceptable performance values. Configuration of traffic differentiation and priority scheduling showed improvement in the applications performance, where users experienced a page response time of less than 4seconds. These results suggest that in order to deliver e-learning applications with the required QoS, mechanisms to guaranteed QoS, such as traffic differentiation and priority scheduling, are to be configured in a network. The simulated model can be used as a laboratory tool for testing performance of applications in UMTS network prior to their deployment in real world network. The future outlook of this research is to perform evaluation of e-learning applications in UMTS network taking into account all the four (conversational, streaming, interactive and background) applications traffic classes.
7.
ACKNOWLEDGMENTS
Authors appreciate the Swedish International Development Cooperation Agency (Sida) for financial generosity in this study.
8.
REFERENCES
[1] H. Holma and A. Toskala, WCDMA for UMTS: Radio Access for Third Generation Mobile Communications, John Wiley & Sons, Ltd, 2004. [2] Jarno Niemelä, “Impact of base Station Site and Antenna
Configuration on Capacity in WCDMA Cellular Networks,” 2003.
[3] J. Niemela and J. Lempiainen, “Impact of the base station antenna beamwidth on capacity in WCDMA cellular networks,” The 57th IEEE
Semiannual Vehicular Technology Conference, 2003., vol. 1, 2003, pp. 80-84.
[4] A.B. García, E. García, J. Berrocal, and E. Vázquez, “A Simulation Tool for Dimensioning and Performance Evaluation of the UMTS Terrestrial Radio Access Network,” In Proceedings of Interactive Distributed Multimedia Systems and Telecommunication Services - IDMS ., 2002, pp. 49-60.
[5] M. Stasiak, P. Zwierzykowski, and J. Wiewióra, “Analytical Model of the WCDMA Radio Interface in UMTS Network with User Differentiation,” In Proceedings of the 2009 Fifth Advanced International Conference on Telecommunications, 2009, pp. 83-88.
[6] A. Samhat, T. Chahed, and G. H, “Priority Queuing for IP-Based Service Differentiation in the UMTS Radio Access Network,” In Proceedings of NETWORKING 2004, LNCS 3042., 2004, pp. 490- 501.
[7] S. Chevul, “On Application-Perceived Quality of Service in Wireless Networks,” 2006.
[8] L. Isaksson, S. Chevul, M. Fiedler, J. Karlsson, P. Lindberg, and A. Ab, “Application-Perceived Throughput Process in Wireless Systems Department of Communications,” In Proceedings of Systems Communications, 2005. ISBN: 0-7695-2422-2, pp. 172 - 177.
[9] B. Garriga, F. Dominguez, C. Serrano, S. Tenorio, and E. Asensio, “QoS Load Differentiation Application in a UTRAN Live Network,” In Proceedings of the IEEE 69th Vehicular Technology Conference, 2009. VTC Spring 2009. Barcelona, Spain. ISBN: 978-1-4244-2517-4, pp. 1-8.
[10]P.T. R Cadman, C Dineen, “Trends in Economics and Finance. Volume II: Use of economic Modelling in Telecommunications.,” International
Telecommunication Union (ITU) Report, 2006.
[11]V.K. Garg and O.T.W. Yu, “Integrated QoS support in 3G UMTS networks,” IEEE Wireless Communications and Networking Conference.
Conference Record (Cat. No.00TH8540), IEEE, 2000, pp. 1187-1192.
[12]F. Agharebparast and V.C.M. Leung, “A Framework for QoS Support in the UMTS / GPRS Backbone Network Using DiffServ,” Computing and Informatics, vol. 21, 2002, p. 97–118.
[13]D.P. Svoboda, “Measurement and Modelling of Internet Traffic over 2 . 5 and 3G Cellular Core Networks,” Doctoral Dissertation, Faculty of Electronics and Information Technology, Vienna University of Technology, Austria., 2008.
[14]D. Staehle, K. Leibnitz, and P. Trangia, “Source Traffic Modeling of Wireless Applications,” International Journal of Electronics and Communications, vol. 55, 2001, pp. 27-36.
[15]3GPP-TS-23.107, “3GPP TS 23.107: Quality of Service (QoS) Concept and Architecture,” 3GPP:Technical Specification Group Services and System Aspects., vol. 0, 2002.
[16]ITU-T-Rec-G.1000, “Communications Quality of Service: A Framework and Definitions,” ITU-T Recommendation G.1000., Jun. 2001.
![Fig 1: UMTS QoS architecture [1]](https://thumb-us.123doks.com/thumbv2/123dok_us/9299384.428327/2.595.319.541.516.650/fig-umts-qos-architecture.webp)
![Fig 3: Best effort network configuration [1]](https://thumb-us.123doks.com/thumbv2/123dok_us/9299384.428327/4.595.92.505.295.768/fig-best-effort-network-configuration.webp)
![Fig 4: Traffic differentiation network configuration [1]](https://thumb-us.123doks.com/thumbv2/123dok_us/9299384.428327/5.595.88.513.402.685/fig-traffic-differentiation-network-configuration.webp)