ROLE OF METABOLISM OF HDL AND ITS SUBTYPES IN OCCURRENCE OF DIABETES IN
OFFSPRINGS OF PATIENT
1,*
Sumayya Wani,
2Ishrat H. Dar,
1
Department of Endocrinology and Metabolism, All India Institute of Medical Sciences (AIIMS), New Delhi, India
and Mewar
2
Department of Medicine, Government Medical College,
3
Registered medical practitioner, Jammu and Kashmir, India
4
Department of Endocrinology and Metabolism, All India Institute of Medical Sciences (AIIMS), New Delhi, India
ARTICLE INFO ABSTRACT
Background:
(HDL) during the initial progression of disease. There is growing appreciation that Insulin resistance is associated with lowering of HDL. The exact prevalence of the Insulin resistance syndrome among those with low HDL i
Methods:
(0.06 ml) containing 1071 U/ml Heparin, 500 mmol/l Magnesium Chloride Sulfate was added to a Serum (0.3 ml). Sample was incubated and centrifuged at
minutes. HDL3 was measured by a homogenous HDL assay in the supernatant and HDL2 estimated by subtracting the HDL3 from direct HDL.
Results: was 23.84
respectively. Mean Insulin levels Conclusions:
serve as an initial marker for Type 2 DM
Copyright © 2015 Sumayya Wani et al. This is an open access article distributed under the Creative Commons Att distribution, and reproduction in any medium, provided the original work is properly cited.
INTRODUCTION
This study was aimed to analyze the relation between HDL, HDL2 and HDL3 in off springs of patients with type 2 DM. There have been previous studies suggesting decrease in HDL
concentration in patients with type 2 DM (Howard, 1987
has been observed that there is a decrease in
cholesterol acyltransferase (LCAT) activity in such patients (De Man et al., 1996) as well as increase in the activity of Hepatic Lipase (HL) resulting in increased catabolism of HDL (Syvanne et al., 1995). HDL is a heterogeneous group of particles, their core comprising of Cholesteryl Ester and TG, which is surrounded by amphipathic layer of Phospholipids,
Apo lipoproteins and free cholesterol (Evans
lipoproteins are specialized group of proteins that associated with lipids and mediate many biochemical steps in plasma lipid metabolism. The amount of cholesterol transported in HDL particles is measured as HDL Cholesterol (HDL). particles transport cholesterol from peripheral cells to Live
*Corresponding author: Sumayya Wani,
Department of Endocrinology and Metabolism, All India Institute of Medical Sciences (AIIMS), New Delhi, India and Mewar university, Rajasthan, India.
ISSN: 0975-833X
Vol.
Article History:
Received 09th December, 2014
Received in revised form
04th January, 2015
Accepted 17th January, 2015
Published online 26th February,2015
Key words:
HDL, HDL2. HDL3, Diabetes,
Diabetes Mellitus, Cholesterol.
RESEARCH ARTICLE
ROLE OF METABOLISM OF HDL AND ITS SUBTYPES IN OCCURRENCE OF DIABETES IN
OFFSPRINGS OF PATIENTS WITH TYPE 2 DIABETES MELLITUS
Ishrat H. Dar,
3Ambreen Bashir,
3Sair B. Mir and
4Department of Endocrinology and Metabolism, All India Institute of Medical Sciences (AIIMS), New Delhi, India
and Mewar University, Rajasthan, India
Department of Medicine, Government Medical College, Srinagar, Jammu and Kashmir, India
Registered medical practitioner, Jammu and Kashmir, India
Department of Endocrinology and Metabolism, All India Institute of Medical Sciences (AIIMS), New Delhi, India
ABSTRACT
Background: Patients with Diabetes mellitus (DM) develop low
(HDL) during the initial progression of disease. There is growing appreciation that Insulin resistance is associated with lowering of HDL. The exact prevalence of the Insulin resistance syndrome among those with low HDL in the general population has not been clearly established.
Methods: One twenty one patients and one twenty one controls were taken. Precipitation reagent (0.06 ml) containing 1071 U/ml Heparin, 500 mmol/l Magnesium Chloride
Sulfate was added to a Serum (0.3 ml). Sample was incubated and centrifuged at
minutes. HDL3 was measured by a homogenous HDL assay in the supernatant and HDL2 estimated by subtracting the HDL3 from direct HDL.
Results: Mean HDL of patients and controls was 35.74 ± 8.18 and 49.27 ± 37.28 respectively. HDL3 was 23.84 ± 5.97 and 31.08 ± 4.60 respectively.HDL2 resulted18.27± 5.55 and 11.84 ± 3.61 respectively. Mean Insulin levels were 11.33 ± 8.46 and 9.14 ± 5.60 respectively.
Conclusions: HDL2 is higher than HDL3in off springs of patients with Type 2 DM.HenceHDL2 may erve as an initial marker for Type 2 DM
is an open access article distributed under the Creative Commons Attribution License, which distribution, and reproduction in any medium, provided the original work is properly cited.
analyze the relation between HDL, HDL2 and HDL3 in off springs of patients with type 2 DM. There have been previous studies suggesting decrease in HDL
Howard, 1987). It has been observed that there is a decrease in Lecithin cholesterol acyltransferase (LCAT) activity in such patients as well as increase in the activity of Hepatic Lipase (HL) resulting in increased catabolism of HDL HDL is a heterogeneous group of particles, their core comprising of Cholesteryl Ester and TG, which is surrounded by amphipathic layer of Phospholipids,
Evans et al., 2009).Apo oteins that associated with lipids and mediate many biochemical steps in plasma The amount of cholesterol transported in HDL particles is measured as HDL Cholesterol (HDL). HDL particles transport cholesterol from peripheral cells to Liver
Department of Endocrinology and Metabolism, All India Institute of Medical Sciences (AIIMS), New Delhi, India and Mewar university,
(Bruce et al., 1998) thus exhibiting anti HDL particles also express anti
of their anti-oxidative properties. Other functions of HDL include improvement of endothelial function and anti
aggregation (Rashid et al., 2009
on the following basis (Shah, 2009
1. On the basis of their major Apolipoprotein components
apoA-I or apoA-II
2. On the basis of their density
3. On the basis of their electrophoretic mobility
HDL is associated with low
epidemiological trials (Gordon, Rifkind, 1989
number of pathologies such as type 2 DM,
resistance and metabolic syndrome are associated with low and
dysfunctional HDL (Ford et al
On the other hand high HDL levels are associated with aerobically trained individuals (
two possible sources of HDL that have been identified, one is the secretion of the nascent HDL and another possible synthetic route is by lipolysis of VLDL and Chylomicrons in
the plasma compartment (Patsch
International Journal of Current Research
Vol. 7, Issue, 02, pp.12454-12460, February, 2015
INTERNATIONAL
ROLE OF METABOLISM OF HDL AND ITS SUBTYPES IN OCCURRENCE OF DIABETES IN
S WITH TYPE 2 DIABETES MELLITUS
4
Madan L. Khurana
Department of Endocrinology and Metabolism, All India Institute of Medical Sciences (AIIMS), New Delhi, India
Srinagar, Jammu and Kashmir, India
Registered medical practitioner, Jammu and Kashmir, India
Department of Endocrinology and Metabolism, All India Institute of Medical Sciences (AIIMS), New Delhi, India
Patients with Diabetes mellitus (DM) develop low levels of High Density Lipoprotein (HDL) during the initial progression of disease. There is growing appreciation that Insulin resistance is associated with lowering of HDL. The exact prevalence of the Insulin resistance syndrome among
n the general population has not been clearly established.
One twenty one patients and one twenty one controls were taken. Precipitation reagent (0.06 ml) containing 1071 U/ml Heparin, 500 mmol/l Magnesium Chloride and 12 mg/ml Dextran Sulfate was added to a Serum (0.3 ml). Sample was incubated and centrifuged at 10,000 rpm for 10 minutes. HDL3 was measured by a homogenous HDL assay in the supernatant and HDL2 estimated
Mean HDL of patients and controls was 35.74 ± 8.18 and 49.27 ± 37.28 respectively. HDL3 ± 5.97 and 31.08 ± 4.60 respectively.HDL2 resulted18.27± 5.55 and 11.84 ± 3.61
were 11.33 ± 8.46 and 9.14 ± 5.60 respectively.
springs of patients with Type 2 DM.HenceHDL2 may
ribution License, which permits unrestricted use,
) thus exhibiting anti-atherogenic property. HDL particles also express anti-inflammatory action because oxidative properties. Other functions of HDL include improvement of endothelial function and anti-platelet
., 2009). HDL species are identified
Shah, 2009).
On the basis of their major Apolipoprotein components-
On the basis of their density- HDL2 and HDL3.
On the basis of their electrophoretic mobility- α and pre β
HDL is associated with low cardiovascular risks in
Gordon, Rifkind, 1989). A large number of pathologies such as type 2 DM, obesity, Insulin syndrome are associated with low and
et al., 2002; Hoang et al., 2007). On the other hand high HDL levels are associated with
aerobically trained individuals (Kraus et al., 2002). There are
two possible sources of HDL that have been identified, one is the secretion of the nascent HDL and another possible synthetic route is by lipolysis of VLDL and Chylomicrons in
Patsch et al., 1978). There is
evidence suggesting that concentration of HDL2 is a better indicator of the protective effect of HDL than the
concentration of total HDL or HDL3 (Miller et al., 1981;
Calabresi et al., 1990; Syvanne et al., 1995). There are several factors involved affecting HDL-C levels in the body:
1) Exercise favorably affects a number of conditions like
obesity, insulin resistance, lipoprotein profile and blood
pressure (Durstine et al., 2001). Regular exercises increase
the HDL concentrations in the blood.
2) Alcohol increases HDL and HDL3 mass, but not HDL2
(Elizabeth et al., 2000).
3) Monounsaturated fatty acids, Omega-3 fatty acids and
fibers increase HDL levels without increasing the total
cholesterol (Schaefer et al., 1981).
4) Although the prevalence of Insulin resistance syndrome
among the general population with low HDL has not yet been clearly established, many studies suggest that
lowering of HDL causes insulin resistance (Haskell et al.,
1984; Despres et al., 2000). In other studies Insulin resistant states have been associated with low plasma concentration of HDL-C, hyper triglyceridemia and
qualitative changes in LDL (Haffner et al., 1990).
Diabetes mellitus is one of the major risk factors for
cardiovascular disease (Ueshima et al., 2008), which in turn is
the most common cause of morbidity and mortality worldwide (Bonow et al., 2002). Type 2 DM along with insulin resistance is generally accompanied by low HDL levels and high plasma
triglycerides (Diabetologia 28,1985; Ganda, 1980);Singleton
et al., 2003; Shaw et al., 1999; Pontiroli et al., 2000; Eckel
et al., 2005) Similar findings mainly attributed to glucose
intolerance, hyper-insulinemia and obesity have been found in
the off springs of individuals with type 2 DM (Shaw et al.,
1999; Haffner et al., 1990; Chathurvedi et al., 2009; Jouret
et al., 2007). The relation between type 2 diabetes mellitus and
lipoproteins has been demonstrated in a number of studies. It has been observed that there is an overproduction of triglycerides- rich VLDL particles and Apo lipoprotein B-100
in patients with type 2 DM (Evans et al., 1999).
There is an increase in activity of Cholesteryl ester transfer protein (CETP) which in turn causes the increased lipid exchange between triglyceride-rich VLDL and both HDL and
LDL (Howard, 1987). This results in decrease in
concentration of HDL due to formation of triglyceride-rich HDL and LDL particles. Small HDL particles have been observed in patients with type 2 DM. Small HDL particle size and low level of HDL2 Is also associated with
hyperinsulinemia and hyper triglyceridemia (Ginsberg, 2000).
Hepatic lipase has also been observed to induce catabolism of HDL due to its over activity which results in smaller, denser,
abnormal lipoproteins (Syvanne et al., 1995). There is now
substantial evidence that progression to T2DM can be delayed
or prevented through lifestyle and pharmacologic
interventions. (Chiasson, 2007). A number of studies have
documented beneficial effects of lifestyle intervention, including weight-reducing diets and moderate-intensity exercise, in preventing the development of T2DM in high-risk
subjects (Buchanan, 2007). Thus the present study was
designed to analyze the relationship if any between HDL, HDL2 and HDL3.
MATERIALS AND METHODS
Sample Collection
Blood samples were collected in a fasting state from healthy subjects in EDTA vials kept in ice, centrifuged immediately
and plasma was stored at -20°C until assayed. All basal
parameters like Insulin, HDL, Cholesterol, LDL, VLDL, TG, Glycosylated Hemoglobin (HbA1c) and Cortisol were estimated in the sample. The subclasses of HDL as HDL2 and HDL3 were also included in the study. Blood samples for plasma glucose were collected in potassium oxalate/ sodium fluoride vials.
Ethical Approval
The study was approved by the institutional ethics committee as per ICMR guidelines. Written informed consent was obtained from all subjects who wished to participate in the study. In case of children less than 18 years, consent was obtained from one of the parents and verbal assessment of the child was also done.
Inclusion and Exclusion Criteria
All non-diabetic children and grandchildren of the index cases were included in the study. Subjects diagnosed with diabetes or other systemic disorders and pregnant women were excluded. Controls comprised normal subjects without a family history of diabetes in two generations. The controls were normal in all aspects except for minor ailments. Details of medical history were collected and physical examination including anthropometry was performed. Height was measured with a Stadiometer to the nearest centimeter and weight was also measured. BMI was calculated as weight (kg) divided by the square of the height in meters. A value of 25 or more was considered as overweight for the adult population for BMI. For children and adolescents up to 18 years cut-offs recommended by the International Obesity Task Force (IOTF) were used (Cole et al., 2000).
Size
One hundred and twenty one subjects with family history of DM volunteered for the study and were enrolled as cases and one hundred twenty one matched subjects without family history of DM were enrolled as controls.
Biochemical Analysis
Fasting glucose was estimated on a fully–automated Cobas Integra 400 plus (Roche) by using standard commercially available kits or a standard methodology was adopted wherever necessary. HbA1c was estimated by D-10 dual HbA1c program. Total cholesterol, HDL, LDL, VLDL and TG were determined directly in the serum using a fully–automated cobas integra 400 plus (Roche). (Cobas integra 400 plus (Roche) employs four different techniques namely Absorption
photometry, Fluorescence Polarization Immune-assay (FPIA), Immuno-turbidimetry and Potentiometry. Its analyzer uses a unique reagent system using unique patented cassettes, which require no preparation. (These cassettes for the estimation of Cholesterol, TG and Glucose were procured from New Golden Enterprises in New Delhi, India) Plasma insulin and Plasma Cortisol were measured by electro-chemiluminescence assay employing ELECSYS 2010 (Roche Diagnostics, Indianapolis, USA). This assay uses monoclonal antibodies against insulin. (The Insulin and Cortisol kit used in ELECSYS 2010 was procured from Vikas Enterprises in New Delhi, India)
Single precipitation method with Heparin/Magnesium Chloride and Dextran Sulphate (Mn/Ds) for estimation of HDL2 and HDL3
A single precipitation method was standardized and results
were obtained in the below explained condition.
A precipitation reagent (0.06 ml) containing 1,071 U/ml heparin, 500 mmol/l MnCl2, and 12-mg/ml-dextran sulfate was added to a serum (0.3 ml). The sample was incubated and centrifuged at 10,000 rpm for 10 min. HDL3 was measured by a homogenous HDL assay in the supernatant and HDL2 was estimated by subtracting the HDL3 from the direct HDL (Tsutomu Hirano et al., 2008).
Statistical Analysis
The statistical analysis was carried out using SPSS version 16 software and the technique applied was student t-test to compare continuous data in two groups. Log transformation was applied to the skewed data.A chi square test was done to evaluate the difference in frequency between the two groups. Pearson correlation was applied to find the relationship between continuous-numeric parameters. A forward stepwise multiple linear regression was performed to determine the effect of possible predictors on serum HDL and LDL cholesterol levels. P<0.05 was considered as significant.
RESULTS
One hundred and twenty one cases and controls completed the study. There were 60 males and 61 females in each group and their age ranged from 10 years to 45 years. The parameters upon which the study was based included Fasting Blood
Glucose (FBG), Glycosylated Hemoglobin (HbA1c),
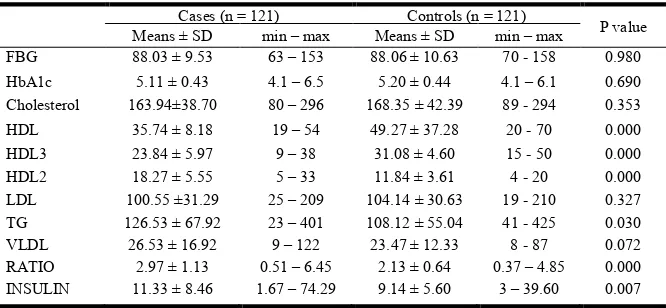
Cholesterol, HDL, HDL3. HDL2, LDL, Triglycerides (TG), VLDL, HDL: LDL Ratio and Insulin FBG was statistically insignificant (p=0.980), mean FBG value of cases and controls were 88.03±9.53 and 88.06± 10.63 respectively.
Similarly HbA1c comparison between cases and controls was insignificant (p=0.690); mean HbA1c value of cases and controls were 5.11 ± 0.43 and 5.20 ± 0.44 respectively. Mean cholesterol comparison between cases and controls was insignificant too (p=0.353), mean cholesterol value of cases and controls were 163.94±38.70 and 168.35 ± 42.39. Mean HDL was significantly lower in cases as compared to controls. (p= 0.000), Mean HDL of patients and controls was 35.74 ± 8.18 and 49.27 ± 37.28 respectively. Similarly, Mean HDL3 was lower in cases in comparison to controls (p=0.000).The comparison between patients and controls showed mean HDL3 values of 23.84 ± 5.97 and 31.08 ± 4.60 respectively. Mean HDL2 on the other hand was significantly higher in cases than controls. (p=0.000) Mean HDL2 values in cases and controls were 18.27± 5.55 and 11.84 ± 3.61 respectively. There was no statistical significance in LDL comparison between patients and controls, which resulted 100.55 ± 31.29and 104.14 ± 30.63 respectively (p= 0.327).
However a significant difference in plasma TG comparison between patients and controls was observed. TG was significantly higher in cases as compared to controls. (p=0.030). Mean TG values obtained were 126.53 ± 67.92 and 108.12 ± 55.04 in cases and controls respectively. VLDL comparison between patients and controls was statistically insignificant (p=0.072), mean VLDL results were 26.53 ± 16.92 and 23.47 ± 12.33 respectively. Plasma Insulin was
significantly higher in patients as compared to
controls(p=0.007), mean insulin results being 11.33 ± 8.46 and 9.14 ± 5.60 in patients and controls respectively.(0.007).A summary of the comparison of above mentioned parameters between cases and controls is given below in Table 1. A detailed analysis on the prevalence of HDL, HDL2 and HDL3 was done apart from mean values and p value,odd ratio and 95% cumulative indexwere calculated as well.
HDL Concentrations in cases
In Table 2 are listed concentrations (mean ± SD) of HDL and HDL Subclasses for normal males and females from different age group categorized as below. HDL subclasses were analyzed at 0.09 g/dl DS. In cases there were no significant differences among different age groups in both males and females.
HDL Concentrations in controls
[image:3.595.133.466.643.797.2]In Table 3 are listed concentrations (mean ± SD) of HDL and HDL subclasses for normal males and females from different
Table 1. Comparison of parameters between Cases and Controls
Cases (n = 121) Controls (n = 121)
P value
Means ± SD min – max Means ± SD min – max
FBG 88.03 ± 9.53 63 – 153 88.06 ± 10.63 70 - 158 0.980
HbA1c 5.11 ± 0.43 4.1 – 6.5 5.20 ± 0.44 4.1 – 6.1 0.690
Cholesterol 163.94±38.70 80 – 296 168.35 ± 42.39 89 - 294 0.353
HDL 35.74 ± 8.18 19 – 54 49.27 ± 37.28 20 - 70 0.000
HDL3 23.84 ± 5.97 9 – 38 31.08 ± 4.60 15 - 50 0.000
HDL2 18.27 ± 5.55 5 – 33 11.84 ± 3.61 4 - 20 0.000
LDL 100.55 ±31.29 25 – 209 104.14 ± 30.63 19 - 210 0.327
TG 126.53 ± 67.92 23 – 401 108.12 ± 55.04 41 - 425 0.030
VLDL 26.53 ± 16.92 9 – 122 23.47 ± 12.33 8 - 87 0.072
RATIO 2.97 ± 1.13 0.51 – 6.45 2.13 ± 0.64 0.37 – 4.85 0.000
age group categorized as below. HDL subclasses were analyzed at 0.09 g/dl DS. In females there were no significant differences among different age groups. Among males in the concentration in the 25-34 year group was greater than that in the ‹ 25 and 35-45.
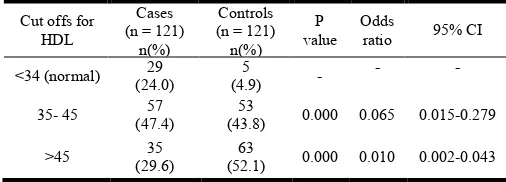
Prevalence of HDL in cases and controls
[image:4.595.43.288.73.228.2]To study the prevalence of HDL, both cases and controls were tested for HDL levels. Only 4.9% of controls had normal HDL levels (<34). Almost half of both cases and controls had HDL levels between 35-45.
Table 4. Prevalence of HDL in cases and controls
Cut offs for HDL
Cases (n = 121)
n(%)
Controls (n = 121)
n(%) P value
Odds
ratio 95% CI
<34 (normal) 29
(24.0)
5
(4.9) -
- -
35- 45 57
(47.4)
53
(43.8) 0.000 0.065 0.015-0.279
>45 35
(29.6)
63
(52.1) 0.000 0.010 0.002-0.043
High HDL levels (>45) were found in 52.1% of controls whereas only 29.6% of cases showed high levels of HDL. A detailed report of this analysis as well as P-value, Odds Ratio and 95% Cumulative Index is given below in Table 4. A graph
comparing the prevalence of HDL in cases and controls is depicted in Figure 1.
Prevalence of HDL2 in cases and controls
Both cases and controls were tested for HDL2 levels to study its prevalence. Only 2.5% of cases showed normal HDL2 levels (<10). On the other hand 63.6% of controls showed normal HDL2 levels whereas a huge percentage of cases, 66.2%, showed >15 HDL2 whereas only a 2.5% controls showed >15 HDL2.A detailed report of this analysis as well as P-value, Odds Ratio and 95% Cumulative Index is given below in Table 5. A graph comparing the prevalence of HDL2 in cases and controls is depicted in Figure 2
Prevalence of HDL3 in cases and controls
[image:4.595.306.560.244.331.2]HDL3 was studied in both cases and controls. In cases, 54.2% cases showed normal HDL3 levels (<19) whereas in Controls a mere 5% showed normal HDL3 levels. On the other hand, 45.8% of cases showed higher HDL3 levels of >19 whereas a huge 95% of controls showed higher HDL3 levels of >19.A detailed report of this analysis as well as P-value, Odds Ratio and 95% Cumulative Index is given below in Table 6. A graph comparing the prevalence of HDL3 in cases and controls is depicted in Figure 3.
Table 6. Prevalence of HDL3 in cases and controls
Cut off for HDL3
Cases (n = 121)
n (%)
Controls (n = 121) n (%)
P value Odds
ratio 95% CI
˂ 19(normal) 65
(54.2) 6
(5.0) 0.000 0.050 0.012-0.211
˃ 19 55
(45.8)
115
(95.0) 0.000 - -
DISCUSSION
The purpose of this study was to estimate and analyze HDL and its subclasses in off springs of patients with Type 2 Diabetes Mellitus. Previous relevant studies have revealed that patients with Diabetes have usually low HDL as well has
higher TG as compared to non-diabetics (Syvanne et al.,
1995). These low HDL levels in Diabetics have been
successfully linked with a high risk of Coronary Heart Disease
CHD (Laakso, 1997). Several studies reveal a diminished
HDL2 levels in patients with Type 2 DM (Bakogianni et al.,
[image:4.595.40.286.332.484.2]2001; Pérez-Méndez et al., 2007). A study done on healthy Japanese individuals suggested higher levels of HDL2 than
Table 2. Concentrations of HDL, HDL2 and HDL3 in cases
Age N HDL HDL2 HDL3
MALES
<25 55 34.56 ± 8.55 16.73 ± 4.97 23.12 ± 6.20
25-34 23 34.65 ± 8.31 19.53 ± 4.50 23.12 ± 6.20
35-45 9 33.56 ± 4.92 18.87 ± 6.01 21.92 ± 2.84
Total 87 34.48 ± 8.12 18.28 ± 5.18 23.00 ± 5.96
FEMALES
<25 35 38.51 ± 8.78 16.90 ± 4.50 26.74 ± 6.20
25-34 43 35.98 ± 8.32 18.74 ± 7.65 23.31 ± 5.77
35-45 14 35.93 ± 4.77 19.29 ± 4.71 23.39 ± 4.15
Total 92 36.93 ± 8.10 18.26 ± 5.93 36.93 ± 8.10
Table 3. Concentrations of HDL, HDL2 and HDL3 in controls
Age N HDL HDL2 HDL3
MALES
<25 23 46.96 ± 5.24 11.42 ± 3.68 30.22 ± 3.11
25-34 21 52.86 ± 5.16 11.46 ± 3.26 33.33 ± 3.92
35-45 16 49.50 ± 7.41 11.52 ± 2.51 30.62 ± 3.36
Total 60 49.70 ± 6.30 11.44 ± 3.44 31.42 ± 6.0
FEMALES
<25 21 48.24 ± 7.04 11.77 ± 4.10 31.81 ± 4.99
25-34 23 49.43 ± 11.08 12.47 ± 3.77 30.70 ± 6.97
35-45 17 48.82 ± 4.31 12.54 ± 2.79 29.47 ± 2.47
[image:4.595.309.556.505.577.2]Total 61 48.85 ± 8.17 12.22 ± 3.75 30.74 ± 5.35
Table 5. Prevalence of HDL2 in cases and controls
Cut offs for FBG
Cases (n = 121)
[image:4.595.35.288.591.682.2]n (%)
Controls| (n = 121) n (%)
P value
Odds
ratio 95% CI
˂ 10 (normal) 3
(2.5)
77
(63.6) 0.000 -
-
10-15 38
(31.3)
41 (33.9)
0.001
0.134 0.039-0.457
˃ 15 80
(66.2) 3
(2.5) 0.000 0.024 0.007-0.082
Figure 1. Graph showing percentage prevalence of HDL in cases and controls
Figure 2. Graph showing percentage prevalence of HDL2 in cases and controls
Figure 3. Graph showing percentage prevalence of HDL3 in cases and controls
HDL3 (Hirano et al., 2008) whereas a study done on Western
population suggested that HDL3 is more than HDL2 (Bakogianni et al., 2001; Pérez-Méndez
[image:5.595.37.292.461.633.2]These varied results in the concentration of HDL and its subclasses press upon the importance of further estimation of this lipid in population prone to development of Type 2 DM, hence our basis of doing this study based on the off springs of
Figure 1. Graph showing percentage prevalence of HDL in cases
Figure 2. Graph showing percentage prevalence of HDL2 in cases
Graph showing percentage prevalence of HDL3 in cases
) whereas a study done on Western population suggested that HDL3 is more than HDL2-C
Méndez et al., 2007).
the concentration of HDL and its subclasses press upon the importance of further estimation of this lipid in population prone to development of Type 2 DM, hence our basis of doing this study based on the off springs of
population having Type 2 DM.
that HDL concentration is low in off springs of patients with type 2 DM as compared to general population. A similar pattern is found in case of HDL3. However in case of HDL2, there is contrasting evidence suggesting higher levels in th springs of Type-2 Diabetics as compared to controls.
To the best of our knowledge, no such study has been done on the off springs of Type 2 Diabetics in which HDL and its subclasses have been studied. A relevant study suggests that there is low HDL cholesterol among normal weight, normoglycaemic off springs of Type 2 Diabetics (
Praveen et al., 2011). Our study, based upon 121 cases and controls, did not show much difference in terms of FBG between cases and controls. HbA1c was slightly lower in cases (5.11 ± 0.43) as compared to controls (5.20 ± 0.4 Cholesterol was slightly higher in off springs of patients with Type 2DM as compared to normal population. Tan
done on the South East Asian population too revealed that total Cholesterol level was not significantly different
2008).However on the other had, TG levels were high in cases
(126.53 ± 67.92) as compared to Controls (108.12 ± 55.04) suggesting that off springs of Type
higher TG levels than the general population. According to a study on Caucasian Greek subjects, total Cholesterol, TG, LDL, LP (ct) were significantly higher in off springs of Diabetic parents as compared to off springs whose parents did
not have Type 2 DM (Psyrogiannis
study suggested lower HDL levels in off
with Type 2 DM as compared to the off springs of non parents, which is similar to our findings.
were observed to be higher in the off springs of patients with Type 2 DM as compared to normal population.
Declaration of Interest
The authors declare that there is no conflict of interest that could be perceived as prejudicing the impartiality of the research reported.
Funding
The study was funded by the Indian council of Medical Research (ICMR).
Acknowledgements
The Authors are thankful to all the subjects who volunteered for the research and also to friends and family who helped and supported in the research efforts.
REFERENCES
Bonow, RO., Smaha, LA., Smith
Lenfant, C. 2002. World Heart Day 2002: The international burden of cardiovascular disease: responding to the
emerging global epidemic. Circulation
Bruce, C., Chouinard, RA. Jr. and review of nutrition. Annu Rev Nutr.
330.Plasma lipid transfer proteins, high
lipoproteins, and reverse cholesterol transport.
population having Type 2 DM. The present study has shown that HDL concentration is low in off springs of patients with type 2 DM as compared to general population. A similar pattern is found in case of HDL3. However in case of HDL2, there is contrasting evidence suggesting higher levels in the off
2 Diabetics as compared to controls.
To the best of our knowledge, no such study has been done on the off springs of Type 2 Diabetics in which HDL and its subclasses have been studied. A relevant study suggests that there is low HDL cholesterol among normal weight,
of Type 2 Diabetics (Edavan P.
Our study, based upon 121 cases and controls, did not show much difference in terms of FBG between cases and controls. HbA1c was slightly lower in cases (5.11 ± 0.43) as compared to controls (5.20 ± 0.44). Cholesterol was slightly higher in off springs of patients with
Type 2DM as compared to normal population. Tan et al study
done on the South East Asian population too revealed that total
Cholesterol level was not significantly different (Tan et al.,
However on the other had, TG levels were high in cases (126.53 ± 67.92) as compared to Controls (108.12 ± 55.04) suggesting that off springs of Type-2 Diabetics may have higher TG levels than the general population. According to a reek subjects, total Cholesterol, TG, LDL, LP (ct) were significantly higher in off springs of Diabetic parents as compared to off springs whose parents did
Psyrogiannis et al., 2003). The same study suggested lower HDL levels in off springs of patients with Type 2 DM as compared to the off springs of non-diabetic parents, which is similar to our findings. VLDL and Insulin were observed to be higher in the off springs of patients with Type 2 DM as compared to normal population.
The authors declare that there is no conflict of interest that could be perceived as prejudicing the impartiality of the
The study was funded by the Indian council of Medical
The Authors are thankful to all the subjects who volunteered for the research and also to friends and family who helped and supported in the research efforts.
, Smith, SO. Jr., Mensah, GA. and World Heart Day 2002: The international burden of cardiovascular disease: responding to the
Circulation, 106: 1602-1605.
. and Tall, AR. 1998. Annual Annu Rev Nutr.; 330.
18:297-330.Plasma lipid transfer proteins, high-density
Buchanan, TA. 2007. (How) can we prevent type 2 diabetes?
Diabetes, 56, 1502-1507).
Calabresi, L., G. Franceschini, M. Sirtori, G. Gianfranceschi, P. Werba and C. R. Sirtori. 1990. Influence of serum triglycerides on the HDL pattern in normal subjects and
patients with coronary artery disease. Atherosclerosis,
84: 41–48.
Chathurvedi, D., Khadgawat, R., Kulshrestha, B. et al, 2009.
Type 2 diabetes increases the risk for obesity among
subsequent generations. Diabetes Technol. Ther., 11:
393-398.
Chiasson, JL. 2007. Prevention of Type 2 diabetes: fact or
fiction?Expert OpinPharmacother. Dec; 8(18):3147-58.
Cole, TJ., Bellizzi, MC., Flegal, KM. and Dietz, WH. 2000. Establishing a standard definition for child overweight and
obesity worldwide: International survey. BMJ., 320:
1240-1243.
De Man, FH., Cabezas, MC., Van Barlingen, HH., Erkelens, DW. and de Bruin, TW. 1996. Triglyceride-rich lipoproteins in non-insulin-dependent diabetes mellitus: post-prandial metabolism and relation to premature
atherosclerosis. Eur J Clin Invest., 26:89-108.
Despres, JP., Lemieux, I., Dagenais, GR., Cantin, B. and Lamarche, B. 2000. HDL cholesterol as a marker of coronary heart disease risk: the Quebec cardiovascular
study. Atherosclerosis, 153:263–272.
Diabetes drafting group, 1985. Prevalence of small vessel and large vessel disease in diabetic persons from 14 centers. The World Health Organization multinational study of
vascular disease in diabetics. Diabetologia 28: Suppl., 1:
615-640.
Durstine, JL., Grandjean, PW., Davis, PG., Ferguson, MA., Alderson, NL. and DuBose, KD. 2001. Blood lipid and lipoprotein adaptations to exercise: a quantitative analysis.
Sports Med., 31:1033–1062.
Eckel, RH., Grundy, SM. and Zimmet, PZ. 2005. The
Metabolic syndrome. Lancet, 365:
Edavan P. Praveen, Bindu Kulshreshtha, Madan L. Khurana, Jayaprakash Sahoo, Nandita Gupta, Guresh Kumar, Ariachery C. Ammini and Rajech Khadgawat. 2011. Low HDL- cholesterol among normal weight, normoglycemic offspring of individuals with type 2 diabetes mellitus.
Hormones, 10(1): 57-66.
Elizabeth, R., De Oliveira e Silva, David Foster, Monnie McGee Harper, Cynthia E. Seidman, Jonathan D. Smith, Jan L. Breslow and Eliot A. Brinton, 2000. Alcohol Consumption Raises HDL Cholesterol Levels by Increasing the Transport Rate of Apolipoproteins A-I and A-II. Circulation; 102; 2347-2352.
Eva Boes, Stefan Coassin, Barbara Kollerits, Iris M.
Heid and Florian Kronenberg, 2009.
Genetic-epidemiological evidence on genes associated with HDL
cholesterol levels: A systematic in-depth review. Exp.
Gerontol., 44(3): 136–160.
Evans, M., Khan, N. and Rees, A. 1999. Diabetic
dyslipidaemia and coronary heart disease: new
perspectives. Curr. Opin. Lipidol., 10:387-391.
Ford, ES., Giles, WH. and Dietz, WH. 2002. Prevalence of the metabolic syndrome among US adults: findings from the third National Health and Nutrition Examination
Survey. JAMA, 287: 356–359.
Ganda, OP, 1980. Pathogenesis of macrovascular disease in
the human diabetic. Diabetes, 29: 931-942.
Ginsberg, HN. 2000. Insulin resistance and cardiovascular
disease. J Clin Invest., 106:453-458.
Gordon, DJ. and Rifkind, BM. 1989. High-density lipoprotein:
the clinical implications of recent studies. N. Engl. J.
Med., 321: 1311–1316.
Haffner, SM., Stern, MP., Hazuda, HP., Mitchell, BD. and Patterson, JK. 1990. Cardiovascular risk factors in confirmed prediabetic individuals. Does the clock for coronary heart disease start ticking before the onset of
clinical diabetes? JAMA, 263:2893-2898.
Haskell, WL., Camargo, C. Jr, Williams, PT. et al. 1984. The
effect of cessation and resumption of moderate alcohol intake on serum high-densitylipoproteinsubfractions: a
controlled study. N. Engl. J. Med., 310:805–810.
Hirano, T., Nohtimi, K., Koba,S. et al. 2008. A simple and
precise method for measuring HDL- cholesterol
subfractions b a single precipitation followed by
homogenous HDL- cholesterol assay. J. Lipid Res.,
49:1130-1136.
Hoang, A., Murphy, AJ., Coughlan, MT., Thomas, MC., Forbes, JM., O'Brien, R., Cooper, ME., Chin-Dusting, JP.
and Sviridov, D. 2007. Advanced glycation of
apolipoprotein A-I impairs its anti-atherogenic
properties. Diabetologia, 50: 1770–1779.
Howard, BV. 1987. Lipoprotein metabolism in diabetes
mellitus. J. Lipid Res., 28:613-628.
Jouret, B., Ahluwalia, N., Cristini, C. et al, 2007. Factors
associated with overweight in preschool-age children in
southwestern France. Am. J. Clin. Nutr., 85.
Kraus, WE., Houmard, JA., Duscha, BD., Knetzger, KJ., Wharton, MB., McCartney, JS., Bales, CW., Henes, S., Samsa, GP., Otvos, JD., Kulkarni, KR. and Slentz, CA. 2002. Effects of the amount and intensity of exercise on
plasma lipoproteins. N. Engl. J. Med., 347: 1483–1492.
Laakso, M. 1997. Dyslipidemia, morbidity, and mortality in non-insulin-dependent diabetes mellitus.Lipoproteins and coronary heart disease in non-insulin-dependent diabetes
mellitus. J Diabetes Complications, 11:137-141.
M. Chr. Bakogianni, Chr. A. Kalofoutis, K. I. Skenderi, et al.
2001. Clinical evaluation of plasma high-density
lipoprotein subfractions (HDL2, HDL3) in
non-insulin-dependent diabetics with coronary artery disease. J.
Diabetes Complications, 15: 265-269.
Miller, N. E., F. Hammett, S. Saltissi, S. Rao, H. van Zeller, J. Coltart, and B. Lewis. 1981. Relation of angiographically defined coronary artery disease to plasma lipoprotein
subfractions and apolipoproteins. Br. Med. J., 282:1741–
1744.
Patsch, JR., Gotto, AM. Jr, Olivercrona, T., Eisenberg, S. 1978. Formation of high density lipoprotein2-like particles during lipolysis of very low density lipoproteins in vitro. ProcNatlAcadSci U S A. Sep, 75(9):4519-23.
Pérez-Méndez, O., Torres-Tamayo, M., Posadas-Romero, C. et
al. 2007. Abnormal HDL subclasses distribution in
overweight children with insulin resistance or type 2
diabetes mellitus. Clin. Chim. Acta., 376:17-22.
Pontiroli, AE., Monti, LD., Pizzini, A. and Piatti, P. 2000. Familial clustering of arterial blood pressure, HDL-cholesterol, and proinsulin but not insulin resistance and
microal-buminuria in siblings of patients with type 2
diabetes. Diabetes Care, 23: 1359-1364.
Psyrogiannis, A., Habeos, I. and Kyriazopoulou, V. 2003. Insulin sensitivity and Lp(alpha) concentrations in normoglyce-mic offspring of type 2 diabetic parents.
Lipids Health Dis., 2: 8.
Rashid, S., Marcil, M., Ruel, I. and Genest, J. 2009. Identification of a novel human cellular HDL biosynthesis
defect. Eur. Heart J., 30(18):2204-12.
Schaefer, E. J., R. I. Levy, N. D. Ernst, F. D. Van Sant, and H. B. Brewer. 1981. The effects of low cholesterol, high polyunsaturated fat, and low fat diets on plasma lipid and
lipoprotein cholesterol levels in normal and
hypercholesterolemic subjects. Am. J. Clin. Nutr.,
34:1758-1763.
Shah, PK. 2009. Focus on HDL: A new treatment paradigm for
athero-thrombotic vascular disease. Exp. Opin. Invest
Drugs, 2009: 2139-46).
Shaw, JT., Purdie, DM., Neil, HA., Levy, JC. and Turner, RC. 1999. The relative risks of hyperglycemia, obesity and dyslipidemia in the relatives of patients of type II diabetes
mellitus. Diabetologia, 42: 24-27.
Singleton, JR., Smith, AG., Russell, JW. and Feldman, EL. 2003. Microvascular complications of impaired glucose
tolerance. Diabetes, 52: 2867-2873.
Syvanne, M., Ahola, M., Lahdenpera, S., Kahri, J., Kuusi, T., Virtanen, KS. and Taskinen, M- R. 1995. High density lipoprotein subfractions in non-insulin-dependent diabetes
mellitus and coronary artery disease. J. Lipid Res., 36:573–
582.
Tan, JT., Tan, LS., Chia, KS., Chew, SK. and Tai, ES. 2008. A family history of type 2 diabetes is associated with glucose intolerance and obesity-related traits with evidence of excess maternal transmission for obesity-related traits in a
South East Asian population. Diabetes Res. Clin. Pract.,
82: 268-275.
Tsutomu Hirano, Kyoko Nohtomi, Shinji Koba, A yakoMuroi and YasukiIto, 2008. A Simple and Precise method for measuring HDL- cholesterol sub fractions by a single precipitation followed by homogenous HDL-cholesterol
assay, Journal of Lipid Research, Volume 49.
Ueshima, H., Sekikawa, A., Miura, K. et al. 2008.
Cardiovascular disease and risk factors in Asia: a selected
review. Circulation, 118: 2702-2709.