ABSTRACT
XIAN, LU. Touchpoint Mapping of Local Supply Chain in North Carolina. (Under the direction of Dr. Trevor J. Little.)
The goal of this research is to develop a new way of mapping the product pipeline and analyzing the pipeline velocity from inception until reception by the consumer. The major challenge facing the industry is that the textile pipeline requires the same amount of time as it did in the mid 1980’s. After 25+ years, there is no substantial reduction in the entire textile supply chain velocity. One of the consequences is the inability to respond quickly to changes in consumer purchase behavior. The recent/ongoing recession is a prime example of the inability of the retail end to adjust inventory according to demand. This resulted in significant markdowns, significant inventory mountains in the upstream textile processes, and the resulting obsolete fabric weights and colors for the next selling period. To meet this challenge, an important step is to clearly understand how product, information and cash flow throughout the pipeline. This thesis research sets out to develop a methodology that can be applied successfully throughout all stages of the product pipeline. The “touch points mapping” methodology is an appropriate place to begin and develop into a common analysis methodology throughout the entire product pipeline.
T-shirts made from the Cotton of Carolinas locally grown.
Touchpoint Mapping of Local Supply Chain in North Carolina
by Xian Lu
A thesis submitted to the Graduate Faculty of North Carolina State University
in partial fulfillment of the requirements for the Degree of
Master of Science
Textiles
Raleigh, North Carolina 2011
APPROVED BY:
__________________________ __________________________ Dr. Nancy L. Cassill Dr. Timothy G. Clapp
DEDICATION
BIOGRAPHY
TABLE OF CONTENTS
LIST OF TABLES...vi
LIST OF FIGURES...vii
CHAPTER ONE INTRODUCTION ... 1
CHAPTER TWO REVIEW OF LITERATURE ... 4
Process Mapping Tools ... 4
IDEF ... 5
Visio ... 10
CA Erwin Process Modeler ... 13
Touchpoint Methodology ... 14
Supply chain ... 15
Supply chain Tools ... 17
Supply chain Transparency ... 18
Global SC vs. Local SC ... 20
Cluster Sourcing ... 25
Silk Road ... 31
World pattern in textiles ... 32
Social Media ... 33
History, Evolution and Future ... 33
Spread and Scale ... 35
Social Media Strategy ... 37
CHAPTER THREE METHODOLOGY ... 38
Touchpoint Mapping ... 38
Case Study- Local supply chain of TSD Carolinas T-shirt ... 41
Data Sources ... 43
CHAPTER FOUR RESULTS ... 45
Farmer& Ginner ... 46
Spinner ... 50
Printer & Dyer ... 53
Retailer ... 59
A. Retail Stores- Distribution Center. ... 60
B. Consumers- Retailer ... 61
C. Retailer- Vendors... 64
CONCLUSION, IMPLICATIONS AND RECOMMENDATIONS ... 69
Conclusion& Implications ... 69
Recommendations ... 72
CHAPTER SIX LIMITATIONS AND FUTURE RESEARCH ... 75
Limitations ... 75
Future Research ... 75
REFERENCES ... 76
LIST OF TABLES
LIST OF FIGURES
CHAPTER TWO
REVIEW OF LITERATURE
Figure 1 Consultants and teams working on process improvement ... 5
Figure 2 Process-centered schematic IDEF3 ... 7
Figure 3 Object-centered schematic IDEF3 ... 8
Figure 4 Symbols used for IDEF3 Process Description Schemes ... 9
Figure 5 Screenshot of Microsoft Visio ... 12
Figure 6 Screenshot of CA Erwin Process Modeler ... 14
Figure 7 Transparency of SCM ethics – a conceptual framework ... 19
Figure 8 Number of Textile and Apparel clusters in China ... 28
Figure 9 Location of Cotton production regions in the U.S. ... 30
Figure 10 Locations of South Carolina Textile Mills ... 30
Figure 11 Map of Silk Road Trade Routes ... 32
Figure 12 The evolution of Social Media ... 34
CHAPTER THREE METHODOLOGY Figure 13 Touchpoint Metrics (MCorpConsulting) ... 39
Figure 14 End-to-end lifecycle services (Touchpoint Experience) ... 40
Figure 15 T-shirt tracking of local Supply Chain ... 41
CHAPTER FOUR RESULTS Figure 16 Cotton prices Jan. 2008- Feb. 2011 (Monthly) ... 46
Figure 17 Cotton prices 2001- 2011 (Yearly) ... 47
Figure18 Saw Ginning Touchpoints ... 48
Figure19 Spinning Touchpoints ... 51
Figure 20 Printing and Dyeing Touchpoints ... 55
Figure 21 Locations of Retailer ... 60
Figure 22 Retail Touchpoints ... 61
CHAPTER ONE
INTRODUCTION
Supply chain issues such as forecast accuracy, inventory control, JIT production, and transparency have made supply chain relationship management paramount. Several contemporary supply chain tools have been developed to address these issues. APS, ERP, CPFR, EDI, TXTPERFORM2008 are used by companies to manage orders, forecast sales demand, better distribution and replenishment, coordinate production, optimize inventory, and create visibility throughout the entire supply chain.
Touchpoint mapping is to identify the information flow and therefore permit automation of information flow.
The textile supply chain generally consists of five main stages- fiber and raw material, textile manufacturing (yarn, fabric, finishing), textile products, distribution and sales. A textile cluster has been defined as a collection of companies in geographic proximity producing products with same raw materials. The supply chain in this research is one example that clusters local textile mills (farmer, ginner, spinner, knitter, finisher, cutter, sewer, printer, and dyer) producing TSD Carolinas T-shirts in North Carolina. TSD Carolinas T-shirts are made from Cotton of the Carolinas grown in North Carolina. Before the T-shirt delivered to the consumers, it should go through the nine stages for processing. Traditionally, these segments operate as independent entities and are geographically separated. However, in response to the trend of supply chain localization, TSD Carolinas T-shirts are made and sold by members of a local supply chain with strong partnership and linkages. With Touchpoint mapping, the textile supply chain in North Carolina could be visualized taking the example of TSD Carolinas T-shirts.
interviews involved in this specific supply chain that have been conducted for information input to the mapping. Microsoft Visio has been selected as the tool for mapping in this research. The primary objective is to collect data from this local supply chain sample, to organize the information into a Touchpoint mapping and to visualize the local supply chain. The map identifies Touchpoints occurring either within a supply chain entity or between supply chain members. There are more than 100 Touchpoints mapped out in the Cotton of the Carolinas supply chain and only a fraction of this amount is in the processing of the product. These Touchpoints bring value to the product process as well as the end market and the methodology differs from the traditional process mapping approaches used to optimize supply networks..
CHAPTER TWO
REVIEW OF LITERATURE
Process Mapping Tools
It is very likely that many managers do not really understand their business processes and how to simplify and optimize them. Process mapping is an analytical and communication tool used to describe each step in the business processes in the form of workflow diagrams and supporting texts. A process map usually shows activities with boxes and arrows to represent data and interfaces. Leading process mapping tools care categorized into 1) Simple Flow-Chart Graphic Software such as Visio, 2) Process Mapping Products such as BPwin, 3) IDEF Process Mapping Products, 4) Process Simulation Products, and 5) Process-Mapping ABC Products including OPTIMA, ADC Process Simulator, Prosim, SIMPROCESS, ITHINK, Design/CPN and PROMODEL [Hunt, 1996].
Figure 1 Consultants and teams working on process improvement Source: Sweet, S. (2011). Process Improvement with Multiple Teams Using Action Learning. Retrieved from I4Process, CA.
IDEF
produce models, or descriptions are the raw material from which models are made. Thus, the utility of descriptions may also be realized through their reuse in constructing multiple models.
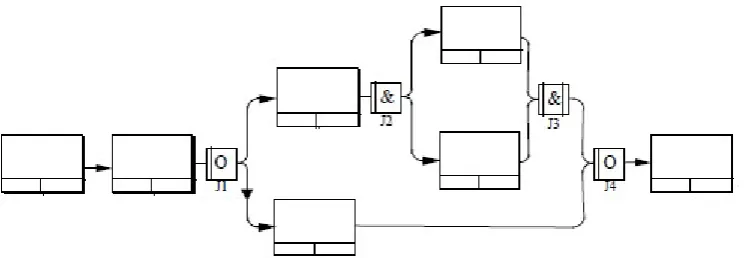
There are two types of diagrams in IDEF3: (1) process flow diagrams (Figure 2), which capture the knowledge of how things work; and (2) object state transition network diagrams (Figure 3), which summarize the transitions of an object. The process centered strategy organizes process knowledge with a focus on processes and their temporal, causal, and logical relations within a scenario. The second dimension organizes process knowledge with its focus on objects and their state of change behavior. Both the Process Flow Description and Object State Transition Description contain units of information that constitute the description of a system. In summary, an IDEF3 Process Flow Description, which is intended to show how things work in a particular organization, captures a description of a process and the network of relations that exists between processes within the context of the overall scenario in which they occur.
introducing logic to the flows. [Chen, 2009 & Carrie, 1995]
Figure 2 Process-centered schematic IDEF3
Source: Mayer, R., & Menzel, C. (1995). Information Integration for concurrent engineering(IICE) IDEF3 Method Report. College Station, TX: Knowledge Based Systems, Inc.
Boxes- UOBs ; arrows- links; small box containing the “X” denotes a junction Numbering scheme-- explicit traceability between levels of detail in the description
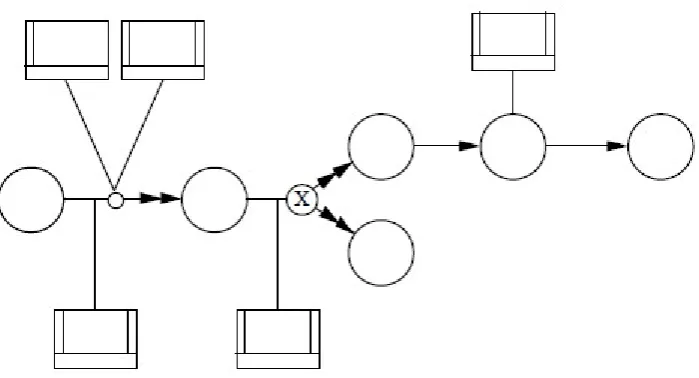
Figure 3 Object-centered schematic IDEF3
Source: Mayer, R., & Menzel, C. (1995). Information Integration for concurrent engineering(IICE) IDEF3 Method Report. College Station, TX: Knowledge Based Systems, Inc.
Figure 4 Symbols used for IDEF3 Process Description Schemes
Source: Carrie, Allan (01/01/1995). "Application and assessment of IDEF3-process flow description capture method". International journal of operations & production management (0144-3577), 15 (1), p. 63.
The benefit of IDEF3’s design is to capture and structure descriptions of how a
1. Distribute detailed manufacturing process knowledge among geographically dispersed units;
2. Enhance the analysis of a business system with a structured approach; 3. Facilitate design data life-cycle management;
4. Support the project management process by monitoring and controlling project activities in real-time
Benefits realized through the application of IDEF3 can be measured by cost savings, quality improvements and capability improvements.
Visio
There are two versions of Visio available. The basic standard version (Figure 5) which creates business-related diagrams such as flowcharts, organizational charts, and project schedules, is flexible enough to address most common business needs. The professional version builds on the standard version with shapes and solutions that enable technical professionals to create IT, Web, engineering, and other technical diagrams.
[LaFon, 2004] Visio's core strength is seducing users into expressing ideas and
relationships of a given process, rather than forcing users to focus on how to use the program. [Doherty, 1999]
have to buy, install and manage it on the desktop. [Caton, 2006]
Business Process Modeling Notation (BPMN) represents multi-dimensional business processes, as it uses the set of graphical elements describing every important aspect of the business process, which can be regarded as the modeling dimension. However, BPMN is only graphical notation and does not support the essence of Business Process Management (BPM) which supports full business process lifecycle from documenting and modeling to execution and monitoring. To accelerate the adoption of BPM, industry has come forward with two BPMN complementing standards – Business Process Execution Language (BPEL) and XML Process Definition Language (XPDL). [Penicina, 2010]These two standards are used for different purposes – BPEL is process
execution language and XPDL is process exchange language.
Figure 5 Screenshot of Microsoft Visio
Microsoft Visio makes it easier to communicate information, reach consensus across an organization, optimize business processes, design or configure complex systems, monitor and maintain IT systems. [Microsoft Support, 2011]
1) Visio Standard
Visio Standard 2007 helps visualize, document, communicate, and share ideas by performing tasks such as exporting brainstorming diagrams to Microsoft Office Word documents in outline form, organization charting, scheduling activities or generating calendars for easy review, tracking project progress based on assigned timelines, visualizing business processes.
Professionals in IT, engineering, and software development benefit from Visio Professional 2007 that are targeted to specific domain needs. Besides a rack diagram drawing type and updated network shapes, an improved web site mapping solution, software development templates, architectural/ engineering/ facilities management, and database modeling, the features that Visio Professional 2003 offers, Visio Professional 2007 introduces additional technical solutions and advanced functions on the basis of Visio Standard 2007. Some added features are the integration of data and diagrams to combine disparate sources of complex visual, textual, and numeric information, visualization of business data in a hierarchical form, visualization of manufacturing processes based on lean methodology, compliance with ITIL standards, creation of site maps of existing web sites by using templates and predefined shapes, support for incorporating data into a building plan, etc. Visio Professional 2007 even enables to reverse-engineer database models and software solutions.
CA Erwin Process Modeler
CA (Computer Associate) ERwin Process Modeler is formerly BPWIN. [ERWin,
2011] CA ERwin PM, used for general review of resources, planning of major
Dynamic Data Exchange reporting. CA ERwin PM provides a mechanism for capturing key enterprise business knowledge, improving collaboration, productivity and quality, and guiding the application development process. A future version of BPwin may include a spreadsheet interface for sophisticated calculations and optimization.
Figure 6 Screenshot of CA Erwin Process Modeler Source: Product Brief (2011): CA ERwin® Process Modeler.
Touchpoint Methodology
customer Touchpoints that will do most to increase brand equity and resulting profits. They identify the most critical Touchpoints, evaluate the performance of each and monitor them to optimize the interaction between the brand and the consumers.
To figure out the best way for a company to touch its customers, what triggers the intention to purchase and how Touchpoints affect the consumer behavior, process mapping helps in managing Customer Relationship Lifecycle (CRL) which cover 7 stages- Awareness, Knowledge, Consideration, Selection/ Trial, Satisfaction, Loyalty and Advocacy. [Intervox Group, 2003] Touchpoints in terms of customer relationship management may include websites, telephone, email, stores, advertisement and social media, or any other channels that a customer comes in contact with the business.
Touchpoint could be managed from different perspectives. [Marketing Week, 2006] It could be managed by channel- media, call center, stores, or the product itself, and by type- informational, physical or personal. Information Touchpoints require state-of-the-art IT systems to deliver the most effective information to the customers and get customer view back in an efficient manner.
Supply chain
Supply Chain is a set of three or more organizations linked directly by one or
information from a source to a customer. Supply chain, a systematic process, is composed of interrelated activities that are internal and external to a firm. [Handfield, 2009] Supply chain is transparent only when participants are willing to share information based on trust. Thus, the supply chain relationship management becomes paramount. Organizations are effectively forming new types of relationships that require shared resources.
From a customer’s perspective, what really matters is where they could get the best products at the most reasonable price, but supply chains are irrelevant and not so critical. However, a well managed supply chain and a systematic process of internal and external activities will benefit not only the organizations involved but also the customers at the end of the chain.
Supply chain management activities include purchasing, in-bound transportation, quality control, demand and supply planning, materials handling and inventory control, order processing, production planning, scheduling, warehousing, distribution, shipping, outbound transportation, and customer service. [Taylor, 2003] Sourcing as a primary activity in supply chain management includes analyzing the budget, identifying suppliers, requesting quotations, making contract and monitoring the order.
Supply chain Tools
consumer needs and preferences, and diversification or variation of products, companies are faced with severe supply chain issues such as forecast accuracy, inventory control to maintain service levels, transparency across the extended supply chain, and the gap between production and sales caused by the lack of visibility as to what is actually being sold in real time. The level of transparency and demand visibility could be supported by the improved real-time communication between business partners to be proactive rather than reactive.
The advanced planning system (APS) is used to develop proper production schedules to support the potential orders. Enterprise Resource Planning (ERP) is applied at executive level to integrate the order execution related business process. Linking an APS system to an ERP system is a major integration project. [Hon, 2008] There are overlaps between APS and ERP system in terms of managing order fulfillment, planning, sales demand, distribution, production and purchasing.
flow from manufacturers to retailers eliminating distributors is more efficient along the supply chain [Fliedner, 2003].
TXTPERFORM2008 brought up by TXT e-solutions enables greater visibility and
control over supply costs, more accurate forecast, better distribution and replenishment planning as well as inventory optimization aligned with sales and production. Based on best-in-class industry practices, TXTPERFORM2008 supports consumer goods companies such as textile and apparel to go for the best demand management and supply planning that delivers an exceptional combination of analytics capabilities and functionality. [Kumar, 2008]
Supply chain Transparency
All activities throughout the supply chain from the point-of-origin to the
Figure 7 Transparency of SCM ethics – a conceptual framework
Source: Svensson, G (01/01/2009). "The transparency of SCM ethics: conceptual framework and empirical illustrations". Supply chain management (1359-8546), 14 (4), p. 259.
Supply-chain transparency in ordering, inventory and transportation is essential
for companies to make better business decisions being proactive rather than reactive to the marketplace and society as a whole. Transparency enables companies to see how the suppliers perform from raw materials sourcing to the store delivery. [Gunasekaran, 2004] It should be noted that information is the driving force of all SC activities and accurate information should be in place in terms of order quantity, delivery date and flow or transition of products to achieve reduced operational cost, expected service levels and customer satisfaction.
is applied when the organizational memory or the knowledge from the past is brought to present activities for improvement. External knowledge refers to production, shipping, order schedules, demand and inventory levels that each player in the value chain could see. [Davey, 2005] The “voice of the customer” should be shared throughout the pipeline by allowing the changing customer preferences visible to everyone. Knowledge management systems create opportunities for quicker response to changes and reduced cycle or lead time.
Global SC vs. Local SC
Changes as well as challenges have taken place throughout the textile supply
Global supply chain brings benefits such as lower procurement cost through outsourcing in developing countries, advanced knowledge and technology, as well as diversified talents that play different roles in all supply chain activities such as production, R&D, sourcing, marketing, and sales, etc. Firms need to compare procurement cost on the same basis and Brinbaum advocates that they use the FCVA- Full Value Cost Analysis method. [Birnbaum, 2000] The FCVA method separates costs into direct cost, indirect cost, and macro cost. Direct cost associated with the product such as labor cost is insignificant compared to the final price costs. Macro costs such as logistics and communication, tariffs and quotas are more important.
An integrated global supply chain is flexible and efficient. Supply chain globalization helps accelerate the capability to manage global customer base, but adds complexity and risk to the supply chain. In the globalised business world, there are factors more important than price. Different culture and currencies, information flow, trade barriers, availability of resources, government or country specific situations, compliance, etc. all pose challenges on the supply chain management on a global basis. There is also underlying intangible cost from the loss of core technology, longer lead time, lower quality and less flexibility as well as the tangible cost of money accruing interest once the order is placed. [WEBER, 2007]
great loss, leading to considerable cost implications along the supply chain network. Offshore sourcing becomes less attractive when the hidden costs such as inflexibility and unresponsiveness outweigh the benefits coming out of low wage, and low production cost [Christopher, 2004]. A domestic supplier that provides quick response and flexibility
would be a better choice for adding velocity into the supply chain.
A global supply chain has higher demand on information transfer and relationship management. Companies and their suppliers or business partners share information, rewards as well as risks. To build well-established relationships with both upstream and downstream players along the supply chain becomes even more difficult due to the differences in economic, political, social, infrastructure, cultural and logistical aspects across nations. Economic challenges may include exchange rates, inflation, duties, and taxes. Political factors are considered in terms of law and regulations, labor and capital. Infrastructure differences may have effect on the banking, logistical and transportation systems. Information flow could be accelerated by the advanced technology and information systems; however the transnational physical flow involves more uncertainty in lead time. [Rugman, 2009 & Manuj, 2008]
of the product that contribute to the competitive advantage. The first step to address this question is to understand the cost triggered by the geographical distance and the balance between the cost and the benefits. [Levy, 1995] As is discussed, local sourcing brings convenience and flexibility while international sourcing makes JIT production and lean production hard to implement. Inaccurate sales and demand forecast caused improper planning in production and inventory. However, the improvement in sales forecast could be offset by the problems caused by poor management in shipping and transportation. Therefore, besides the potential production problems that can occur in international sourcing, there is a non - ignorable threat of disruption regarding offshore transfer of products.
Two main factors are both considered in international sourcing, location-specific factors versus the relational factors. The former represents the attractiveness of a particular region in general. However, the latter disrupt the value chain activities by separating them which may cause delayed shipping, overstock or insufficient inventory, and demand fulfillment problems. The location-specific factors specifically include the local resources, the production cost, the political stability, the economic and social status, and the availability of technology. Meanwhile, the relational factors refer to the flow of physical product, capital and information. International sourcing separates activities along the value chain. The benefits coming out of the low production cost or cheap labor are weakened by the distance from the production center to distribution center or the dynamic consumer markets. Regarding to this, effective communication technology as well as efficient transportation and logistics should be extremely important. [Kotabe, 1993 & Bartlett, 1989] It is imperative for the managers to understand the trade-offs entailed in
international sourcing in order to make better choice between local sourcing and global sourcing. Moreover, the risk and cost behind each mode could be controlled and minimized concerning the supply chain activities such as the shipping method, choice of suppliers or vendors, and the location of production, R&D facilities, etc.
for business, and thus financial returns as well as profitability. However, the supply chain itself is complicated to coordinate since it involves multiple functions generating substantial information flow and product flow. There are underlying risks and multiple uncertainties for a global supply chain which is more difficult to coordinate, communicate and monitor due to the identified factors such as high transportation cost, technological complexity and product immaturity. Therefore, long-term perspective, patient and careful implementation should be taken towards Global SC footprint which is usually managed by global organizations. MNCs usually control the risk by developing suppliers in a reduced number and establishing long-term partnership with them. Transparency of the supply chain activities and trust in business relationships help offset uncertainty and risks associated with international sourcing.
Cluster Sourcing
Domestic companies that supply products with flexibility and quick response
more important than capacity or cost will continue to compete effectively with imports.
service, markets and technologies. [Apex, 2006] Clusters bring benefits to customers, producers and suppliers as is analyzed in Table 1.
Table 1 Cluster Benefits from customer, producer and supplier perspectives
Customer Producer Supplier
- Approachable - Variety of choices - Fast delivery
- Availability in
resources, land, infrastructure and labor, etc.
- Centralized purchasing - Government support
- Approachable - Efficient logistics - Bulk order and high
consumption - Centralized
supplying
Clusters promote competition as well as co-operation. A cluster will die without competition. However, over competition may cause normalization and inflexibility which has negative effects on the clusters instead. Textile clusters traditionally originated from the vicinity of raw material sources. In today’s world, the clusters compete on end-products and production competencies including technology and infrastructure. It is continuous innovation or new product development that makes the clusters more competitive in the long run.
hosiery sector are found in Tirupur, Ludhiana and Kolkata. Silk clusters are in Bangalore and Mysore and woolen clusters for shawls in Kullu and Amritsar. China and India are the two developing markets that could best illustrate “cluster” concept in the textile industry. According to United Nations Industrial Development Organization’s (Unido) estimate, India has about 70 textile clusters comprising about 80% of textile production. India’s Budget 2006 stimulates cluster-based development, especially in the textiles and handloom sector. India has the most handicraft clusters nationwide making handicrafts better than any other regions or nations in the world. In 2010, more than 125 clusters participated in the cluster sourcing exhibition representing all major crafts like Embroidery, Cane & Bamboo, Wood, Stone, Block Printing, Metal, etc. [fiber2fashion, 2010] The show provides convenient B2B and B2C platforms for the cluster artisans to
network nationwide. Handicraft sector in India has contributed to emerging business opportunities, growing employment, larger capacity of production, and increasing export overseas.
global trade. In 2004, it was estimated that around 80% of the total sales of all textiles and apparel enterprises above designated size were generated from industrial clusters. According to Figure 8, more than two thirds of the textile clusters are located in Jiangsu and Zhejiang province while Guangdong is the largest apparel producer with 16 more clusters [Li& Fung, 2006]. Jiangsu province, for example, has the strongest clusters nationwide in terms of the output of textile materials such as woolen cloth, yarns, and textile machinery.
The textile and apparel clusters in China are large in scale and well-established all the way from raw materials, yarn and fabric, to final products and brand management. Cluster sourcing in China requires considerable knowledge of the clusters and suppliers due to the large amount of clusters competing in the market thus thousands of choices.
Figure 8 Number of Textile and Apparel clusters in China
[USDA, 2007] that cotton growers are clustered in the southern part of the nation. North
Figure 9 Location of Cotton production regions in the U.S. Source: Economic Research Service-data Sets- Production Regions (2007)
Figure 10 Locations of South Carolina Textile Mills
Source: Eades, D. (2007). South Carolina's Textile and Apparel Industries: An Analysis of Trends in Traditional and Emerging Sectors. UCED Research Report, 12(1), 50-60.
Silk Road
BC–24AD), and gradually formed throughout the Han Dynasty (25–220). With the establishment of the Tang Dynasty (618–907), which saw rapid development of economy and society, this famous trade road reached its most prosperous stage in history and during Yuan Dynasty (1271–1368), it experienced its last flourishing period. [Frank, 1990] Silk Road could be considered as a prototype of supply chain in today’s world. It
played the role of exchanging goods, technologies, information and ideas between nations or regions. More than just a trade route, the Silk Road also witnessed the movement of cultural influences. In pre-history there was the original “Silk Road” linking China to Europe. It is more inclusive in so far as it links the Pacific Ocean to the Atlantic Ocean via rail and road. These modern links will enable faster (and safer) transportation of goods from Europe to the USA and to intermediate points.
modern and efficient logistic and supply chain systems nowadays.
Figure 11 Map of Silk Road Trade Routes Source: Steve (2010). The Silk Road, Pt. 1: Introduction.
World pattern in textiles
In the early 1800s, cotton was raised in the southern United States and exported to
mills in England and the north. After the Civil War (1861–1865), North Carolina built large number of mills which made cotton mills in New England less important. World War I (1914–1918) and War II (1939-1945) emphasized the need for self-sufficiency and new companies emerged. American textile companies thrived with the use of imported machinery and dyestuffs. [Washington Post, 1991]In the 1990s, there was a shift in production from U.S. to lowest cost producers. Textile and apparel sector has seen large-scale downsizing in domestic manufacturing with employment declining from 12.1% in the 1970s to 8.1% in the 1990s. [Malhotra, 2006]
Mexico and Canada), and CBI enforced in 1984 (between the U.S. and the Caribbean basin countries) have reshaped the world pattern and benefited the U.S. textile and apparel industry. The geographical proximity with countries like Mexico, Canada allows U.S. firms to save transportation cost and to ensure JIT delivery, rather than sourcing from distant regions in Asia. Moreover, quota systems help shape the world trade pattern as well. [Franklin, 2004]Worldwide quotas on textiles and apparel expired under WTO rules, and textile and apparel makers in the U.S are threatened by losing numerous job opportunities.
Social Media
Social media has penetrated into every corner of people’s life in the modern society. Dating back to the early 17
History, Evolution and Future
th
Touchpoints.
Figure 12 illustrates the evolution of social media industry, however not all social media invented are presented. Six Degrees, founded in 1997, was the first modern social network. It allowed users to create profiles and to add friends into their network. Some popular social networks that have most visits nowadays would be Facebook, LinkedIn and Flickr. Social media isn’t just limited to social networking. It also acts as a platform for users to share personal status, photos, videos, and other information or activities. Youtube, launched in 2005 was the first major video hosting and sharing site.
Figure 12 The evolution of Social Media
Location-based services like Facebook Places and Deals indicate that social media extend beyond the web. Another trend will be social commerce such as group-buying sites and social currencies such as Facebook Credits.
Some tools utilized by companies to monitor and analyze social media results are Radian6, uberVU, Argyle Social, Social Mention, Social Radar, Viralheat, Meltwater Buzz, and Flinchline. These tracking tools are used for measuring buzz and the spread of a campaign. The question is that companies might know how many views or Touchpoints of one campaign via one channel of social media like Facebook. However, there is no way for them to know who is watching. [Howell, 2010]
Spread and Scale
Statistics collected from social media, especially Facebook, could illustrate the enormous spread and scale of social media nowadays. [Lukes, 2010& USAToday, 2009] The tremendous scale covered by social media could tell how many individuals, groups or organizations have been touched via these social channels. It could be regarded as numbers game.
- Facebook has 500 million or more users at the end of 2010, rising from 300 million the year before
- More than 10,000 webs use Facebook connect as affiliated sites
- The average user on Facebook has 130 friends and connected to 80 pages, groups and events
- The average user on Facebook creates 90 pieces of information per month (i.e.,
photos, video, links, and status)
- More than 30 billion pieces of information are shared on Facebook per month - Twitter has 40 million more users who create a staggering amount of tweets per
day
- LinkedIn has over 365,000 company profiles
It is said that only 10% of US online consumers upload videos to public sites like Youtube while one-third of them basically watch that are considered as “lurkers”. [Social Behavior; Forrester, 2010] According to Forrester Research, people in the US generate more than 500 billion online impressions regarding products and service, while 16% of online consumers generate 80% of the impressions. [Ray& Wise, 2010]
CHAPTER THREE
METHODOLOGY
The purpose of this research is to investigate how “touch point analysis” can be used to map the product pipeline. It is focused on the analysis of information flow, physical product flow and cash flow along the textile supply chain in North Carolina. The “touch point analysis” methodology is used to map out the business processes and to identify the value stream. With adequate range of companies and resources involved in all stages of the product pipeline, North Carolina provides a best local platform for this research. The data collected in this research come from a completely local supply chain, from cotton grower all the way to the local retailer. This research uses a case study of T-shirts made from Cotton of the Carolinas locally grown and made.
Touchpoint Mapping
actions and relationships.
Figure 13 Touchpoint Metrics (MCorpConsulting)
Intervox Group defines it as “all physical, communication, and human interactions that customers experience during their relationship cycle with the company. Increasingly, customer Touchpoints are ‘owned’ and managed by the contact center.” [Intervox Group, 2010] Touchpoint Experience, Inc. which helps optimize the total customer experience to
Figure 14 End-to-end lifecycle services (Touchpoint Experience) Source: Building Customer Advocacy (2004).
Each Touchpoint has cost and time associated with it and provides critical input to a process. Touchpoint analysis methodology is to define, analyze and optimize the Touchpoints. The first step is Touchpoints identification- how many Touchpoints there are and what they are; the second step is Touchpoint evaluation- whether the Touchpoints work well and add value to the process, whether there are redundant Touchpoints and missing Touchpoints that caused inefficiency. And the final step is optimization by eliminating or adding Touchpoints in a process. Touchpoint mapping helps prioritize and refine the Touchpoints for better analysis and improvement of a process. Touchpoint management allows companies to optimize all the interactions with existing and potential customers, the external and internal communications as well as process management.
production, packing and shipping, quality assurance, and database management, etc. but also in different supply chain roles- farming, ginning, spinning, knitting, finishing, cutting & sewing, printing, dyeing and retailing. Touchpoint mapping in this research is based on the Touchpoint analysis methodology and the platform of Microsoft Visio, which is easy to use and widely applicable.
Case Study- Local supply chain of TSD Carolinas T-shirt
The data collected for this research concentrates on the local supply chain of a T-shirt. The data used were compiled from businesses in making T-shirt and selling T-shirt all within North Carolina. TSD Carolinas by TS Designs is a t-shirt brand that is grown, made, sold fully locally. The complete local supply chain of TSD T-shirt starts from farmer, ginner, spinner, knitter, finisher, cutter, sewer, printer, dyer, to the retailer.
In data collection and utilization, the research follows these steps A) Setup visits to each process in the product pipeline B) Setup visits to each transfer point C) Interview the relevant personnel for each supply chain element D) Collect information/data and enter into the framework E) Develop a map characterizing the local supply chain using Touchpoint analysis F) Validate the maps and information collected.
The interviews were set up via email or phone calls at least one week ahead. Two on-site visits were conducted before and after the mapping. Taking TS Design for example, during the first visit, the CEO and CIO provided large pool of information towards interview questions that had already been listed in the pre-research. In the second visit, the CIO had a review of initial map and corrected the information collected. Questions raised during the interview include but not restricted to:
1. What role do you play in the textile supply chain? Could you describe your job
title and responsibility?
2. Describe your suppliers and customers.
3. What product information is communicated to your suppliers and customers? 4. What steps and processes are included in this section of the supply chain?
5. What is the time consumed in each process mentioned above? Which step is the
most critical and why?
8. How do you decide on which new products to offer? 9. In your work experience, describe the ongoing problems. 10. Describe your plans to improve any parts of the system.
11. How do you achieve the optimal value in each step of product processing within
this section of the supply chain?
12. How many employees are there in this section of the supply chain? 13. How does the market influence the working process?
14. Describe the personal contacts within and between the sections of the supply
chain.
15. Describe the technology solutions of your section of the supply chain.
Data Sources
The companies involved in this research include Thurman Burleson & Sons Farm (Richfield, NC), Rolling Hills Gin, LLC (New London, NC), Hill Spinning (Thomasville, NC), [Mortex Apparel (Wendell, NC), MoCaro Dyeing and Finishing (Statesville, NC)], TS Designs (Burlington, NC) and Great Outdoor Provision Co. It is estimated that 50% of cotton grown in North Carolina is shipped overseas to be manufactured into finished products, and then shipped back to the local store for sale.
CHAPTER FOUR
RESULTS
Thurman Burleson & Sons Farm is the first step in the Cotton of the Carolinas project. The farm located in Richfield of North Carolina brings cotton back in 1991. The cotton used is grown from conventional, Monsanto Roundup Ready cotton seed.
Farmer& Ginner
Rolling Hills Gin, LLC, first established in 1996, has long been involved in the business of ginning for local planted cotton. The gin uses a combination of wire screen, teeth and hooks to pull the cotton through and to filter the debris and short fibers out while brushes help remove the loose cotton lint to prevent jams.
almost every 30 minutes which makes quotation for cotton quite difficult and challenging. In order to optimize cotton inventory, to facilitate the cash flow, and to keep waste down, the T-shirt printer and dyer now takes the overall control in the upstream supply chain.
The price of cotton has hit around $1.72/lb in February 2011 compared with $0.80/lb in February 2010. Cotton price per 100 lbs has been tracked and the results are shown in Figure16 and Figure17. This increase is not short-term. The surging price of raw materials will lead to the expected increase in the prices of textile products around 30-100% over the next 6 months. According to the yearly trend in Figure16, this year hit the highest price point in the past decade with a dramatic jump in the past year.
Figure 17 Cotton prices 2001- 2011 (Yearly) Source: Barchart- Future Market
Cotton in the Carolinas is typically planted in April, and harvested in October each year. In October, the fields are dry enough for picking and cotton plants are defoliated easier for mechanic picking. The stalks break down in winter and decompose into the field. Cotton is planted in evenly spaced rows, perfectly aligned for the picker. For the 2010 harvest, the picker automatically wraps the cotton with yellow wrappers. It is new John Deere equipment introduced in 2010 that makes the new wrapped round bales.
processed to feed cows or cattle.
Figure 18 Saw Ginning Touchpoints
Modules are transported from fields to the ginning plant 2. Seed/ Trash Cotton Seed Oil/ Cattle Feed
The seeds and trash during ginning process are used to feed cattle or to produce cotton seed oil
3. Seed/ Trash Fodder
The seeds and trash are also used by farmers for fodder 4. Bales in Ginning Plant Bales Warehouse
The bales are shipped from the plant to the nearby warehouse for distribution to different buyers
5. Bales Warehouse Samples for test
Samples are selected from the bales warehouse for characterization 6. Bales Warehouse NCC database with IDs
Each bale is labeled with ID and the IDs are entered into the database of the National Cotton Council
7. Samples after testing NCC database
After tested, the bales are characterized into different categories based on parameters such as fiber length, strength, etc. The information is then sent to NCC database.
Approximately 40 bales are processed per hour. Modules are sent to the module feeder and mixed with hot air which makes cotton moisture, loose, unstuck and ready to be cleaned. Further down the line, fibers are pulled from the seeds and taken onto extra cleaning process which keeps the fibers more aligned. The seeds separated from the fibers fall into the bottom. The cleaned cotton is then compressed into bales by the automated machinery. A sample of each bale is taken and tested for staple length and quality before the bale is packaged for storage and shipping. The bales are labeled to differentiate the cotton and shipped to the warehouse and offered for sale.
Hill Spinning Mill, established in 1941 is a private cotton processing company incorporated in North Carolina. The technique for processing in this mill is basically ring spinning which differs from mule spinning or rotor spinning. The mill offers Ring Spun Carded Yarn, Ring Spun Combed Yarn, Ring Spun Slub Yarn made from organic cotton, cottina cotton and cotton of the Carolinas. Yarns are available on cones or dye tubes in a knitting twist, weaving twist, or reverse twist.
Spinner
cleaning process. After then, the carding process is to straighten and smooth the cotton fibers breaking up any fiber locks, and to make fibers aligned. Carded fibers are blended to create slivers of consistent thickness for the next combing process which removes the short fibers to make quality fabrics. The carded or combed slivers are drawn and twisted to create roving. The roving is finished up as yarn that is then wound around bobbins prepared for shipping.
1. Bales Shipped Fibers
The bales are open and loosened into fibers 2. Fibers Cleaning
Fibers are cleaned before production
3. Lab Quality Control Production
Lab technician controls the quality of fiber processing and yarn production 4. Ring spinning Bobbins
The roving are spun to create yarns on bobbins 5. Bobbins Cones on new Murata Winder
Yarns are wound on the cone of various angles for storage and shipping but the CoC goes to Mortex and is picked up by the Mortex truck
6. Bobbins Sales
Sales makes connects and relationships with the market to develop new yarns or to market the existent yarns and slivers. The Cotton of the Carolinas yarn is collected by Mortex truck and transported to Mortex in Wendell for knitting.
connection between yarn and sales because sales help bring in orders as well as new market trend or new materials.
During the visit to the mill, the manager introduced cationic cotton which is a technology when cotton is modified in order to be dyed differently from regular cotton. Cottina Cotton absorbs dyes easier and quicker with less water and dyes without any chemicals. Cottina Cotton also has superior wash fastness which enables good appearance of fabrics after wash and wash again. The shorter dye cycle not only means less energy used and higher efficiency, but also more color offerings, inventory savings, and flexibility for the retailers moving fashion forward. Cottina cotton is made in the U.S. with small manufacturing footprint which makes quality control easier than outsoucing. This technique will be applied in denim jeans, denim shirts, socks, hosiery, and T-shirts but not for Cotton of the Carolinas at this time.
environmental footprint.
TS Designs offers three types of T-shirts: TSD-Organic, TSD-Carolinas (Cotton of the Carolinas), and TSD-Recycled. In this research, the focus is on the best and most expensive line-- TSD-Carolinas T-shirts made from 100% cotton locally grown and made.
The local idea helps reduce the footprint generated by unnecessary consumption and waste of resources like, transportation, land, and manpower. Besides the positive environmental and social impact coming out of the local movement, there is also more transparency that offers consumers a way to track their shirts throughout the entire supply chain.
Figure 20 Printing and Dyeing Touchpoints
1. Customers Sales
Customers and sales make initial contacts by phone call or email; Customers place the order including T-shirt style, color, and size. 2. Customers Artists
Customers request quote and upload the artwork online 3. Sales Artists
Salesperson asks artists to make layouts 4. Artists Sales
5. Sales Customers
Salesperson sends layouts to the customers and quote for the orders 6. Customers Sales
Customers approve the layouts and order the price 7. Sales Artists
Salesperson sends the customer’s approval to artists for production 8. Sales Finance
Salesperson communicates with the accountants to invoice 50% deposit for orders 9. Sales Printing
Salesperson reserves inventory space;
Printing manager works out all schedules (printing/ dyeing/ inspection schedule) and gets back with the salesperson
10. Sales Sourcing& Purchasing
Salesperson informs sourcing department to purchase solid colored/ white T-shirts 11. Sales Database
Salesperson enter orders in the computer database to generate paperwork to run orders and to distribute them to each department
12. Artist Printing
Artists put specifications in bags and make films to production 13. Printing Quality
14. Printing Dyeing
After quality inspection, t-shirts are sent to the dye house for dyeing 15. Dyeing Quality/ Assorting
Dyed T-shirts are sent back for quality inspection and assorting based on different colors, styles or sizes.
16. Quality/ Assortment Packing
After production and assortment, T-shirts are packed in stock and prepared for shipping 17. Packing Shipping
Packaged T-shirts are shipped 18. Shipping Finance
The shipping information is automatically shown in the database and Finance department is informed
19. Shipping Customers
T-shirts are delivered to the customers 20. Finance Customers
Accountants issue the bill to the customer for payment 21. Sales Customers Feedback
Sales follow up with the customers and customers provide feedback
is responsible for researching the target and potential buyers, especially those companies interested in “green and sustainable” product. Usually sales check out company websites and email or make phone calls to the marketing director or the owner who make decisions in the company. It is always important for sales to know the buying cycle of each buyer. Typically sales put buyer information into the database and call three months in advance before the buying season of the potential buyer. If any company shows interest, sales would set up meetings with the local buyers and display T-shirts in all categories. Sales would also mail the T-shirts samples in package to the buyers either within or outside the state.
When an order comes in, buyers upload the artwork to the art director with basic questions about styles and colors and place the order specifying style, color and size to the sales. Receiving the order, sales ask the artists to make layouts. With the layouts and schedule, sales get back with the buyer and quote for the T-shirts. In this process, the buyer could negotiate with sales and make changes on the style, color as well as order quantity.
previous orders quantity, and only T-shirts are purchased on order basis. Sales also reserve inventory space and receive the production schedule from the production manager. At this point, sales enter order information and production schedules into the computer database to generate order paperwork distributed to each department. Artists put specifications in one bag and make films for production. With inventory, inks and bags all ready and the copy of order put on board, the order runs and production begins.
After printing, T-shirts are inspected to ensure consistent quality and sent to the dye house for dyeing. Sometimes the T-shirts are only printed but not dyed according to the customer request. The dyed T-shirts are sent back for quality inspection and then assorted based on colors, sizes or styles and packaged for shipping. When T-shirts are shipped out, accountants invoice to the customers for order payment. Sales confirm order with the buyer by sending out the automated tracking information and follow up with the customers for feedback to make sure the order is fully entertained.
which acquire land for protection thus preserving open space for adventure, and Scout Troops which provides the leadership and skills that enable young people to safely enjoy the wilderness.
Touch points in the retail environment can be grouped into three main categories based on the interfaces: consumers-retailer, retailer-vendors, retail stores-distribution center.
A. Retail Stores- Distribution Center.
There are seven retail stores located in different cities in North Carolina- Raleigh, Wilmington, Greenville, Charlotte, Winston-Salem, Greensboro and Chapel Hill. Among them, the one in Raleigh also provides as the distribution center that delivers products to other stores in the distance range of 26.6 miles to 170 miles.
B. Consumers- Retailer
Figure 22 Retail Touchpoints
Each time when a consumer touches the physical product, information, or service is one touch point. Webs, events, social media and stores are the main channels that bridge consumers with the products and retailer. To quantify the touch points, consumers have 6 touch points with “events”, “webs” and “social media” each related with the products and the company.
their preferences. By registering online, consumers could get year-round benefits and exclusive deals for shopping. Newsletters and emails are sent regularly to keep them updated and to reinforce the consumer relationship, thus triggering additional touch points. Unlike companies which operate web-based transaction as well as offline shops, this company only sells gift cards online which avoids traffic and other problems associated with online commerce. However, detailed product information is all provided and consumers could contact a local shop for product availability. In this case, the retailer specialized in outdoor equipment or wearing and the target consumers are supposed to be interested in outdoor activities. The website then builds a convenient and useful platform for them to seek guides and tips for outdoors, and to dig more about the products behind the scene such as the suppliers and the manufacturers.
Social media is recognized as today’s word-of-mouth, which has accelerated the consumer adoption cycle or decision process from the initial stage of information gathering, to selection and purchasing, and to the post-consumption stage. [Patti& Chen, 2009] When consumers are searching for information and messages, they could rely on
comments but also the companies that offer the products or service by connecting with existent and new consumers in the future.
Companies also seek to engage consumers in relationships and take actions to show that they are reliable and trustworthy by coming up with these events- “Land& Water”, “Leadership”, “Helping Hand”, “Donations to Charity”, “Sales or Clearance” and “Classes& Sessions”. Sometimes consumers get access to these events by getting tickets from social media or company websites. The events or promotions touch the consumers by showing that the company is not only caring about them but also all human beings, environment and the planet. When consumers become comfortable with the company, more Touchpoints and contacts will be cultivated. Additionally, through direct interaction with the consumers, companies could research their needs and wants to provide them with tailored products and services to their satisfaction or even beyond their expectations.
Consumers bring coupons that are received from webs, events or social media to the retail store and get discounts on their purchase.
What makes a Touchpoint in store different from other channels is the dimension associated with it. Touch points in store are three dimensional- informational, personal and physical. Physical touch point refers to the one between consumers and physical products. Informational and personal dimensions indicate that consumers are informed and have the opportunity to communicate or to interact with people, the dimensions that could also be obtained through webs, events and social media. Regarding to the product availability in each 7 retail stores, there are basically 2-3 color options and 250 items of each color.
Both consumers and companies benefit from Touchpoints. Touch points bring consumers and companies closer and develop relationships between them. Through touch points, consumers make good choices and obtain what they want and need more efficiently. For the companies, they benefit by having a pool of consumers that may generate repeat purchases and positive word-of-mouth which brings in more potential consumers.
C. Retailer- Vendors
is to identify vendors. For Great Outdoor Provision Co. the company selects vendors defensively such as The North Face, Columbia Sportswear, and TS Design. The company emphasizes on the vendors’ capabilities in distribution, reliable delivery and the profit margin that could be brought to the retail side.
The mapping of a complete supply chain for TSD Carolina T-shirts is depicted in Figure 23. It is drawn on the platform of Microsoft Visio. Some symbols used in mapping are explained as following:
Local Supply Chain
/ : Farming, Ginning, Spinning, Knitting, Finishing, Cutting& Sewing, Printing& Dyeing, Retailing, the eight primary stages aligned with the pipeline
: One-way flow of information, payment or products : Two-way flow of information, payment or products
Figure 23 Touchpoint Mapping of Local Supply Chain for TSD Carolinas T-shirts
Touchpoints via social media. For example, one piece of content on Facebook or one video published on Youtube would be touched by hundreds and thousands of audiences who may or may not be the target consumers.
Figure 24 Simplified Framework of Local Supply Chain for TSD Carolinas T-shirts
In the simplified framework (Figure 24), it could be concluded that the printer/dyer is associated with the most Touchpoints compared with other players. The printer/dyer plays the role of Chief Supply Chain Officer if the complete supply chain is regarded as an organization. It is the important linkage between the upper and the lower side of the supply chain.
CHAPTER FIVE
CONCLUSION, IMPLICATIONS AND RECOMMENDATIONS
This paper has mapped the local supply chain for TS Designs’ Carolinas T-shirts in North Carolina by applying the “Touchpoints mapping” methodology. In the second chapter, topics related with supply chain and mapping tools were discussed. To better understand the philosophy behind the ongoing operations of a supply chain, it is critical to map the chain out for further analysis and improvement. “Touchpoints mapping” methodology is identified as a place to start. Local supply chain for TS Designs’ Carolinas T-shirts was selected as a case study conducted to apply this methodology to a specific situation. To investigate the TS Designs’ Carolinas T-shirts pipeline, the first step was to identify local supply chain players in the Carolinas, and second is to setup visits to the companies and interviews with the relevant personnel for each supply chain element. Next is to collect information/data and enter into the framework. After all information collected, a framework was developed and validated for characterizing the supply chain with Touchpoint analysis. The final process is to expand the Touchpoint methodology to the supply chains in a broader sense by analyzing the map or framework of the local supply chain that has been studied in this research.
The local supply chain studied in this research could be characterized as an industry cluster within 750 miles in North Carolina. All parties involved in the supply chain share the common goal of local, sustainable products. This goal has brought them on one table driving the local business through integrated efforts.
There are over 100 Touchpoints mapped out for a local supply chain of TSD Carolinas T-shirts. Process points have been discussed a lot in the literature however they only take up a small portion of the total Touchpoints in this research. The most Touchpoints take place in the stage of the printer/dyer, which indicates that the printer/dyer controls or manages the local supply chain for integration. The printer/dyer is the leader of the local supply chain organization for TS Designs’ Carolinas T-shirts. It touches the upstream suppliers as well as the downstream retailers. Most of the Touchpoints on the retail side are associated with consumers. Only the T-shirt printer has direct connections with the retailer. The ginner, spinner and knitter are not fully aware of who is selling the T-shirts made from their cotton or fabric. This disconnection may lead to longer response time to the market and thus the reduced pipeline velocity.
chain compared with a local one. The additional Touchpoints may come from tangling with the problems such as the remote control of quality, high trainning cost, inventory inefficiencies, longer lead time, complicated payment method, cultural or language differences, and delays in logistics or delivery variables. A local supply chain outperforms a global one when labor cost in some developing countries has increased. For a specilised line of business, e.g. the green and sustainable TSD Carolinas T-shirts manufactured locally in this research, an integrated local supply chain should be the right choice.
varies. The shift in the purchasing power of cotton is also influenced by the surging cotton prices. Cotton price is so volatile that it would change, most likely increase when the order of cotton comes from the spinner. Therefore, the printer/dyer orders cotton all the way to the end against short-term price jumps.
In a typical supply chain, the retail either outsources external distributors or operates its own distribution center internally. In this case, the retailer has seven retail stores, one of which is the distribution center. The distributor determines order quantities from the different vendors or production facilities for multiple products and SKUs. The retailer in this case has a specialized line of business only dealing with outdoor related products. Therefore, it is not necessary for them to rely on an external distributor for purchasing products on highly diversified basis. The roles of retail buyer and distributor have overlapped in this local supply chain studied. The retailer decides on order quantities of products served on the store shelf and holds the inventory in it own warehouse. The Touchpoints in distribution in this case has been reduced, which adds velocity to the supply chain.
It is recommended to add a Logistics Manager in the organization to integrate interrelated supply chain activities. The Logistics Manager is a single entity who is responsible for product flow from one place to another in a timely manner. Shipping notice and order status are automatically sent to the logistics manager who arranges shipping and delivery instantly. Any possible delays during transition traditionally could be more or less prevented, thus adding velocity to the chain. What’s more, the logistic information and order status are elevated to a higher level so that everyone in the organization could track the order from end to end.
It has been summarised that retail Touchpoints are connceted with the consumers and the printer/dyer, but not other upstream suppliers. To address this problem, integration effort is needed to optimize the Touchpoints in the supply chain. Retailers and their suppliers need to be more closely connected through shared information such as Point-of-Sale data from stores. By doing this, there should not be delays caused by hand-offs or buffers between the different stages from upstream to downstream supply chain. For example, it would be better for the cotton ginner to know how the end market performs and what is the demand of the retailer so as to start production in an instant manner.
CHAPTER SIX
LIMITATIONS AND FUTURE RESEARCH
1. This research was focused on a case study of the local supply chain in North Carolinas. It may not be generalized to include other types of supply chains.
Limitations
2. The product studied in this research is TS Designs’ Carolinas T-shirt. The supply chain configuration or mapping may vary on the product basis.
3. Results and data collected are based on on-site visit and personal interviews.
Therefore, the information is specific to the product being made. Other products may use different processes.
1. Future research could include more textile products to extend the applications of
Touchpoint methodology to other situations and supply chains. Future Research
2. Touchpoint mapping methodology could be further developed on a more advanced platform or software
3. Conduct Touchpoint analysis upon a global supply chain for better understanding of
REFERENCES
A Comparison of Visio Standard and Visio Professional (2011). Retrieved from Microsoft Support, Redmond, WA. Web site:
Apex Cluster Development Services Pvt, Ltd. (2006). Use the Textile Clusters Tool Well. Retrieved from The Financial Express, U.S.. Web site:
Bartlett, Christopher A. & Sumantra Ghoshal. 1989. Managing across borders: The transnational solution Boston: Harvard Business School Press.
Birnbaum, D. (2000). Birnbaum's global guide to winning the great garment war. Hong Kong: Third Horizon Press. Retrieved from
Borders, B. (2009, June 2). A brief history of social media. Retrieved from Social Media Rockstar website
Building Customer Advocacy (2004). Retrieved from Touchpoint Experience, Weston, CT. Web site:
Carrie, Allan (01/01/1995). "Application and assessment of IDEF3-process flow description capture method". International journal of operations & production management (0144-3577), 15 (1), p. 63.
Caton, M. (2006). SmartBPM eases process building. eWeek, 23(34), 35-36. Retrieved from EBSCOhost.
Chen, Yu-Liu (01/01/2009). "IDEF3 Process Capture Method" EMPTY_STRING Modeling and Analysis of Enterprise and Information Systems: From Requirements to Realization (3-540-89555-8, 978-3-540-89555-8), (p. 159).
Christopher, Martin (01/01/2004). "Creating agile supply chains in the fashion industry". International journal of retail & distribution management (0959-0552), 32 (8/9), p. 367. Customer Interaction Management (2010). Retrieved from Intervox Group, Greenbrae, CA. Web site: