ESTIMATION OF
THE
MATING SYSTEM I N OPEN-POLLINATED MAIZE POPULATIONS USING ISOZYME POLYMORPHISMS1A. H. D. BROWN2 AND R. W. ALLARD
Department of Agronomy and Range Science and Department of Genetics, University of California, Dauis, Califorma
Received January 12, 1970
mating system by which a given population reproduces plays a n im- T g t a n t role in determining its genetic structure.
In
maize, random mating has usually been assumed. However, GUTTIEREZ and SPRAGUE (1959), in a shtdy of polycross plantings of ten stocks which were homozygous for recessive markers, found marked differences in the effectiveness of the stocks as male and female parents. They showed that these differences related to attributes of the mating system such as time of silking and time of pollen shedding. The investigation reported here was undertaken to determine whether such marked deviations from random mating occur in advanced generation open-pollinated populations of maize.Isozyme variants were adopted as markers in this investigation because of their many advantages in studying such populational processes as the mating system. However, isozymes are frequently expressed only at some specific stage in the life cycle and then only in materials grown under carefully controlled conditions. Further, sampling an individual for enzymatic assay may cause damage that upsets the growth pattern and ultimately affects mating behavior; this applies particularly when isozymes are expressed only in seedlings, as is often the case. These difficulties can be circumvented by collecting seeds from mature plants in the field, and inferring the genotype of the maternal parent from progeny tests of seedlings grown under controlled conditions. In this sit- uation an appropriate statistical method for estimating the relevant mating system parameters is required. Such a n estimation procedure is described and discussed in the first part of this paper. Following this the results obtained when the method was applied to isozyme data from two open-pollinated populations of
maize are presented.
ESTIMATION PROCEDURE
Description of the Diallelic Case
Consider a population polymorphic for a codominant diallelic locus (alleles A, and A,) in which maternal genotypic frequencies of A,A1, AIA,, and A,A, at mating are D,
W ,
and R. Let p equal the gene frequency of the A, allele in the pollen pool. Let s denote the proportion of ovules which are self-fertilized andThis work was supported in part by grants from the National Science Foundatmn (GB-6866) and the Nabonal Insbtutes of Health (GM-10476)
2 Present address Department of Biology, Univeraty of York, Heslington, York, England. YOIBDD.
134 A. H. D. BROWN A N D R. W. ALLARD
TABLE 1
Classification of half-sib fam'ly arrays, their possible maternal parents and the expected proportion of such families in the diallelic case
I 0 k 0 A,A,,AlA20rA2A2
1I:l 1 k-I 0 A,A, or A,A,
: 1 i k-i 0
: k k O O
1II:l 0 k-1 1 A, A, or A, A,
: i 0 k-i i
:k 0 0 k
IV: 1 or 1 or A A
more more
K i k ! / i ! ( k - l ) !
t (=l-s) denote the proportion of ovules which are fertilized as a result of random outcrossing. Random samples, each of size
( k
>
1 ),
of progeny from arandom sample of 12 female parents are assayed and the total ( n k ) of genotypes
is recorded.
The assumptions made are: ( 1 ) that excess of self-fertilization is the only factor which may cause the actual mating system to deviate from random mating; (2) that t is uniform for maternal genotypes and pollen alleles (i.e., there is no incompatibility and mating events are independent) and ( 3 ) that pollen fre- quency is uniform over maternal genotypes.
A sufficient partition of the data, with respect to the estimable parameters,
D,
H , p , and t, is obtained when the progenies of all families are grouped accord- ing to genotypes present within each family. Table 1 lists four groups. Families classified in Group I are those in which allk
individuals are genotypically A,A2; the genotype of their maternal parent thus could have been A,A,, AlA2 or A2A2. Group I1 families are those with at least one A,A, and no A2A2 offspring; their possible maternal parents were therefore either A,Al or A,A,. Group I11 is symmetrically opposite to Group 11. Group IV contains families which include at least one offspring of both AIA, and A,A2. Hence Group IV is the only one in which the female parent (A1A2) is definitely known from the progeny array. Within Groups I1 and 111, there arek
possible subgroups depending on the num- ber of homozygotes observed. For Group I, 11, and I11 families, the family sub- group classification also specifies the total number of observed progeny of each genotypz For Group IV families however, the total observed number of A,A,, A,A2 progeny must be recorded. There are 1 (from Group 1 )+
k
(Group 11)+
k
(Group 111)
+
2 (Group IV) = 2k -t 3 ( k > 2 ) total degrees of freedom.M A T I N G SYSTEM A N D ISOZYMES I N MAIZE 135 type within each subgroup, the expected proportions of families in the 2k
+
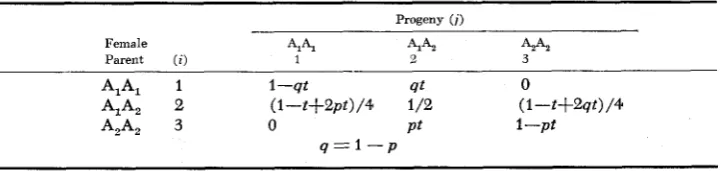
2 subgroups is first calculated. Table 1 gives these expectations in terms of the~ i i ' s which are the single progeny conditional probabilities, i.e., the probability that an offspring is of genotype
i,
given that the female parent is of genotype i ;i,i
= 1,2,3 for AIAl, A,A2, and A2A2. The values of ~ iappear in Table j 2. ForGroups I, I1 and 111, the expected number of individuals of a given genotype within a subgroup equals the product of the expected number of families in the subgroup (i.e. the values in the last column of Table 1 multiplied by n ) times the frequency with which the particular genotype occurs in the subgroup. For Group IV, the expected values are obtained by multiplying n times the conditional fre- quencies, given that at least one of each of the homozygotes occurs. The numbers of progeny of type A,Al, A,A,, and A,A,, respectively are:
EIA,AII = nkHrzl [ 1 - ( ~ ~ ~ + ~ ~ ~ ) ~ ~ l
E [AIA,] = nkHTz2 [ 1 - ( x ~ ~ + T ~ ~ )
E [A,A,] = nkHrZ3 [ 1
-
( ~ 2 2 + i ~ ~ 3 ) L1].- ( ~ 2 2 + ~ 2 3 ) L1
4-
7rZzb1]The model and its expectations are now completely specified, and in theory, the likelihood equation for a given set of data can be formulated and the maxi- mum likelihood estimators for the four parameters, i.e.,
D,
A,
$ and 2, can be derived. However, since general literal solutions for these estimators do not exist, numerical solutions are required. The situation is even more complex when there are more than two alleles per marker locus because female parent genotypes are less easily delineated from the progeny arrays.Two-step Likelihood Scoring Method
While it is possible to formulate a single-step maximum likelihood estimation process based on a probability model of the type displayed in Table 1, this becomes very cumbersome with three or more alleles and moderate
k.
This diffi- culty can be largely overcome by breaking the estimation process into two steps, linked by induction; consequently such a procedure was adopted. Since no more than three alleles can be distinguished at any of the loci studied here, the descrip- tion of the two-step method will be limited to the three allele case. It can, how- ever, easily be expanded to encompass more alleles. Considering the results for each marker locus as a separate experiment, let Z,, z=l,...
n, denote the n discreteTABLE 2
Single progeny conditional probabilities for the diallelic case
4 ' 4 2
3
' 4 1 4 e Female ' 4 1 4
136 A . H. D. B R O W N A N D R. W. ALLARD
random variable vectors, with elements zxj, where zzj is the observed number of
progeny of the jth single-locus genotype (j=1,2 .... 6) for the zth parent. The population parameters of the statistical model can be denoted as: t = outcrossing rate.
P
= an n-dimensional vector whose elements are discrete entries (the actualq = a 3-dimensional vector whose elements ( p , q, and r) are the pollen gene The conditional probabilities ( n i i ) of obtaining a single progeny with specific genotype, given the material genotype, are shown in Table 3.
The joint likelihood function, when the individual family densities are inde- pendent, is
n.
The function f is of the form
unknown genotypes of the n random female parents). frequencies.
uzx;
t, P, q ) = f(Z,I
t, P, 9 . ) : x=l,nwhere ( ~ i j ) ~ = ~ = 1 for all j when aij = z,i = 0, and where Gi is the frequency of
ith genotype in the maternal population. Thus, for each family this function can take six possible discrete values, one for each value of
i.
The likelihood function L cannot be maximized by the usual differentiation procedure because f is nondifferentiable due to the discrete nature of
P.
Conse- quently a computer program was written which calculates, from the data 2, of the xth family and for given values of t and q, the values assumed by f for each of the six possible female parents(i).
To do this, it is necessary to assume that the Gi can be evaluated in terms of t and q (i.e., the population is near equili- brium),
so thatG , = p 2
4-
pqF4-
prF G , = q2+
pqF+
qrF G, = 1-24-
prF+
qrFG, =2pq (1-F) G , = 2pr (1-F) G5=.2qr (I-F),
where F = (1-t)/(l+t). Only when
k
is small (k<6) and t large, does this evaluation seriously affect the ranking of the likelihood scores for a few of theTABLE 3
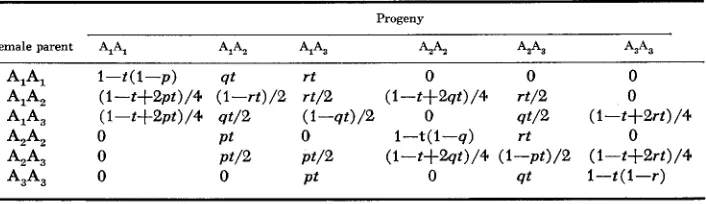
Single progeny conditional probabilities for the triallelic case
Progeny
Female parent AIA, Ai4 4'42 44 A A '43'4,
A A 1-t(1-p) qt rt 0 0 0
A,-% (l-t+2pt)/4 ( I - r t ) / 2 rt/2 ( 1 -t+2qt) / 4 rt/2 0
AZA, 0 Pt 0 I-t(1-q) rt 0
A I 4 ( 1 -t+2pt) / 4 qt/2 (I--qt)/2 0 qt/2 (I-t+2rt)/4
A A 0 Pt/2 Pt/2 (I-t+2gt)/4 ( I - p t ) / 2 (1-t+2rt)/4
M A T I N G S Y S T E M A N D ISOZYMES IN M A I Z E 137
family types. The function g is then set equal to the maximum (over
i )
of these joint family probabilities which, omitting the combinatorial coefficient, are:g ( Z ; t, 4 ) = ~ y p [GiY (xij)'z~I.
This value of
i is stored as the maximum likelihood estimate of the maternal
genotype of the sth family, given t and q. Next an overall likelihood score for the values of t and q assumed is obtained as,n
x=1
l O g L = x l O g g ( z z ; t , q ) .
Repetition of this process using various values of t and q generates a surface and the estimates of t and q ( 2 and $, respectively) are those values at which a maxi- mum occurs in the surface. For each point there is an appropriate estimate of P ;
the maximum likelihood estimate of P is the vector stored when t=t^ and q=$.
In practice, if a large number ( n k ) of seeds from a large number of families ( n )
are assayed, then
4
can be taken as the gene frequencies among the seeds, and the calculation can first be made in one dimension (i.e., by varying t ).
This simplifi- cation assumes that the gene frequencies are the same for ovules and pollen. The maximum point can be estimated graphically; consequently the final estimate need not be one of the specific iteration values. A subsequent check of the effect of variation in q values on 2 can be made. The total value of log L still remains the overall criterion for the joint estimation of t and q.Further simplification is necessary to obtain an estimate of the variance of 2. The approach adopted here was to derive a minimum bound for this variance by reducing the model to one of single parameter estimation. This assumes that P and q are known. If both n and
k
are large this may be a reasonable approxi- mation. Thus, following MATHER (1957), the information per plant is given by1
Ge(1-r) + (G2+G3) ( 1 - - 2 ~ ) '
4 l-t+2pt
+--
t [ 1-t( 1-r) ]-
- G ( 1 - p ) + G,(l--q)
t [ 1-t ( 1 -p) ]
+--
(GZ+G5) 4 (1-2q)Z t [ 1 -t (1-q) ]2t 1-qt 22 1-pt
[
l-t+2qtG3q 2-qt G5p 2-pt
+-
[-]
+
-1.[--I
where the Gi are obtained from the estimated P vector. A minimum bound for the variance of the estimator is var ( t ) = (l/nki,)
.
Discussion of the Mixed Mating System Model and the Estimation Procedure
Many assumptions are involved in the mixed mating model. For example, factors which promote either positive and/or negative assortative mating may be involved. Also mating can vary from genotype to genotype, from environment to environment ( JAIN and ALLARD 1960; ALLARD and WORKMAN 1963; HARDING and TUCKER 1964), and with genotypic frequencies ( RICCELLI-MATTEI 1968).
Further, the pollen pool itself may not be constant (HARDING and TUCKER
138 A. H. D. BROWN A N D R. W. ALLARD
in practice the simplest tenable operating procedure is to estimate a single parameter t=l-s, which summarizes a possibly complex set of biological phe- nomena in terms of an “effective” amount of random outcrossing us. self-fertili- zation. At equilibrium the effect of any mating system can be summarized by WRIGHT’S equilibrium law with one parameter, the fixation index (WRIGHT 1965) F (l-H)/2pq, because F = (1-t)/( l + t ) . I t should be noted that esti- mates of t provided by codominant isozyme markers may be less biased, due to cancelling effects associated with the larger number of genotypes sampled, than estimates based on recessive homozygotes.
FYFE and BAILEY (1951) give the theory of estimation of the mixed mating system using recessive markers, with a careful discussion of assumptions. They use the transformation f = ( 1 - t ) / ( I S t ) and formulate the joint maximum likeli- hood estimators and their variances for f and p (the gene frequencies). VASEK
(1965,1967) has developed a method which does not make use of the maximum likelihood principle. He estimates the two parameters by the six possible painvise solutions of four equations, and a final estimate is derived by averaging the solu- tions. Standard errors for these estimators are not formulated, and the method is open to criticism on the grounds of statistical inefficiency.
The point of departure of the method formulated above from that of FYFE and BAILEY relates to practical experimental efficiency in the joint estimation of t and P.
FYFE
and BAILEY’S method assumes “that the progenies grown are large enough to avoid misclassification of heterozygous parents”, whereas in the present case all the parental genotypes P are unknown and must be determined by progeny test. The question therefore arises as to how large progeny sizes( k )
should be.“Avoidance of misclassification” needs further definition. The only type of progeny array which uniquely defines the maternal genotype is the one which contains two different homozygotes (Group IV). Thus only a proportion of heterozygous parents can be identified unambiguously. Further, homozygous parentage cannot be “proved” with finite
k.
The parentage of a n array with only one or no homozygous types thus can be stated only in probabilistic terms. ( A sequential decision making process is impractical with as many as nine genotypic classifications per individual because fully heterozygous mothers will be very rare.)The first step in maternal classification is essentially a likelihood ratio test. The question arises: what is the effect of family size on the accuracy of this test under various conditions? To answer this question it is necessary to calculate the total probability of correct identification, X , in a given population for various
k.
This total probability is the weighted average of the probabilities of correct identifica- tion of each genotype. In the diallelic caseX = P(AiA1) P(AiAi/AiAi)
4-
P(AiAz) P(AiAz(A1Az)+
P(AzA2) . P(AzAzIAzAz),M A T I N G S Y S T E M A N D ISOZYMES IN M A I Z E 139
probability of identifying the parent of a n array as A,A,, given that the parent is in fact A,A,. These conditional probabilities cannot be formulated algebraically. However, numerical results for various values of outcrossing ( t ) and gene fre- quency ( p ) of A, in the pollen were obtained on the computer. This was done by calculating the rij’s (Table 2) and Gi values for each case. Then, for each sub-
group (I to IV) of Table 1, the largest value of Gi II T z j was taken as the correct
identification. For example, considering Group 11, either
G 1 ~ l l ~ l z b - l
>
Gzrzlr22k-1or G1~11r12k-1
<
G2~21r2216-1. In the former case, all families falling into this sub- group are considered to have maternal parent A,A,. Therefore klrllrlzkl of A,A, parents would be correctly identified but k1TZ1r2Zk-1 of A,A, parents would be incorrectly identified (as A,A,).
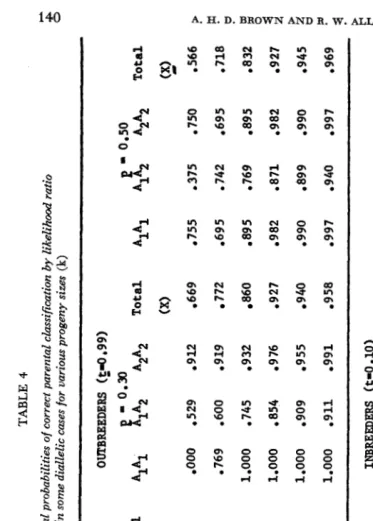
Summing the correct identifications over all subgroups gives the conditional probability for that genotype.A sample of these results is shown in Table 4. Two values of t are considered, one representing virtually complete outbreeding and the other heavy inbreeding, each at three gene frequencies. In the six cases, the first three columns give the conditional probabilities of correct identification of each of the three genotypes. The fourth column gives the value of
X
where, for the outbreeders,D,
H ,
and Rare assumed to be the Hardy-Weinberg proportions and for the inbreeders,
D,
H , andR
are assumed to be inWRIGHT’S
equilibrium under inbreeding ( F =( 1 - t ) / ( l + t ) = .818) for the value of p specified. The expected overall trends are apparent, in that: ( 1 ) the probability of correct identification increases with increasing k ; and ( 2 ) the probability of correct identification increases with decreasing t.
Table 4 shows that progeny sizes of 9-10 give “reasonably good” probabilities of correct identification and that for k
>
10,X
improves slowly. Misclassification of heterozygotes would tend to inflate the estimate of t , whereas misclassification of homozygotes would tend to depress the estimate. With k 2 9 these biases are low. Progeny sizes of 9-10 were therefore chosen for the present experiment. This was also convenient experimentally because each gel accommodates 18-20samples, i.e., the progeny of two individuals.
For a fixed number of electrophoretic assays ( n k ) a conflict arises in the allo- cation of resources because t and the parental genotypic proportions must be estimated cojointly. The efficiency of estimation of t , measured as information per plant, increases as
k
increases because larger families give more accurate female parent identification. However under fixed resources n must fall ask
increases, and the efficiency of estimation of the parental genotypic proportions will decline because fewer parents ( n ) are sampled. Table 4 indicates that 4 5k
5 6, allowing larger n, may provide for optimum allocation of resources if there is reason to believe that t is small.I
A P P L I C A T I O N TO TWO O P E N - P O L L I N A T E D P O P U L A T I O N S O F M A I Z E
Materials and Methods
TABLE 4 Conditional and total probabilities of correct parental classification likelihood ratio test in some diallelic cases for various progeny sizes (k)
p
-
0.10 AIAl A& A2% Total k-
(9
2 0000 0351 .990 .865 4.ooo
.780 .949 .go9 6 1.000 ,758 ,985 .944 9 lo000 0870 0992 -970 12 1.000 .923 .996 .977 .OOO .529 .912 0769 e600 e919 1.000 ,745 .932 1.000 0854 e976 1.000 .go9 .955 1,000 .911 ,991Total (XI ,669
772 860 .927 0940
.958
AIAl 0755 0695 .895 .982 0990 0997
p
-
0.50 A2A2 -375 .750 .742 .695 .769 .895 -871 .982 0899 0990 0940 0997Total
(5)
.
566.
718.832 0927 0945 0969
INBREEDERS ($=O .lo) 2 -992 0374 1.000 .979 .995 .375 .999 .950 -998 .375 .998 .941
4
0997 ,849 0999 -994 0999 0843 e995 0984 e986 0930 09860981 0995
6 0988 0963 1.000 e998 ,994 0964 -999 ,995 e998 0964 0998 9 0999 0992 1.000 1.000 1.000 .987 1.000 0999 0999 0994 .999 0999 10 .999 .996 1.000 1.000 1.000 .995 1.000 0999 1.000 .991 1.000 0999 12 1.000 .999 1.000 1.000 1.000 -998 1.000 1.000 1.000 .999 1.000 1.000
MATING SYSTEM A N D ISOZYMES I N MAIZE 141
(RRS)
program. We are indebted to Dr. D.G.
SMELTZER for providing us with stocks of these populations. In 1968 plantings were made of the generations designated B.2.1 and A.2.2 which represent, respectively, the first and second generations of open-pollinated propagation (relaxed selection) after two cycles ofRRS.
Two generations of open pollination followed the synthesis of the two pools and preceded the first cycle of RRS. At maturity random ears were har- vested from these populations and the kernels from these ears were germinated at 25°C in a growth chamber to produce seedlings representing generations B.2.2 and A.2.3. Electrophoretic assays were based on crude extract of a composite sample of tissue from five-day old seedlings.Formal genetic studies (BROWN and ALLARD 1969a,b) of the six inbred parents of each pool, and certain F,, F,, and testcross progenies, have established that these twelve inbreds differ with respect to nine codominant isozyme loci. On the basis of parentage Pool A is expected to be polymorphic for all nine loci with two alleles per locus, whereas Pool
B
is expected to be triallelic for three loci (E4,Px
and Phos,), diallelic for five loci and monomorphic for one( E I S P ) .
HOW- ever, following Round I of RRS, Pool B was also polymorphic for the E,, locus, indicating chance migration of one (or more) gametes carrying the E,,’ allele into that pool.For Pool B nine seedlings from each of 60 open-pollinated ears were assayed for seven loci (El, E,, E4, E,,, E,,, Adh, and
Px)
using the starch-gel electro- phoretic methods described previously(BROWN
and ALLARD 1969a,b). Hori- zontal slicing enabled assays for butyrate esterase, acetate esterase, and alcohol dehydrogenase in three separate anodal slices. No phosphatase assay was per- formed on these samples. For Pool A, ten seedlings from 50 Open-pollinated ears were assayed for a11 nine loci using a method of lateral slicing described byBROWN
and ALLARD (1969b).Experimental Results and Discussion
For each of the 16 data sets (9 loci in Population A.2.3 and 7 loci in P o p - lation B.2.2), the values of [- log L ] were calculated with q equal to the gene frequencies in the total ( n k ) progeny, and t = 0.75, 0.80, 0.85
.
. .
1.10. Values for a sample of four of the data sets in Table 5 show that the maximized likeli- hoodoccurredwhen.90<2< .95,.95 < 2 < 1.00,1.00<2< 1.05and.90<2< .95, respectively. In theory the variance of this estimator of q should be biased slightly upwards because no account was taken of the multiple sampling of a fmite num- ber ( n ) of female parents. Further, this estimator is not fully efficient since it does not use information about q obtained from the maternal genotypes. However these objections appear to be minor because there was little improvement in the values of L when the q vectors were modified. The likelihood scores for each locus were plotted and a final estimate 2 was derived as the point at which the curve showed a minimum.142 . . A. H. D. BROWN A N D R . W. ALLARD TABLE 5
Values of [- log L] in four cases
A.2.3. B.2.2
Value of t E , Adh
0.85 0.90 0.95 1 .oo 1.05 1.10
209.27 184.73
209.07 184.13
209.14 183.81
209.35 183.82
209.52 184.10
209.99 184.92
358.92 40.59
357.27 40.5 1
356.20 40.51
355.72 40.65
355.87 42.59
356.69 00
not differ from t = 1. The relative magnitude of the approximate standard errors for different loci parallels the rate of change in the values of [- log L ] in Table 5 .
The two triallelic systems ( E 4 , P,) gave the lowest standard errors.
The next column shows the 3’ values computed from data from the homozygous parents only, ignoring information from heterozygous parents. These values, simulating those which would be obtained if the markers had been recessive for each allele in turn, are more erratic but parallel the total likelihood estimate. The codominance of isozyme markers thus considerably improves the efficiency of the estimation over that for recessive markers because all families, not just those derived from recessive homozygotes, contribute information about t .
Thk first three terms of the information formula (ip) above, express the infor- mation about t arising from all the homozygous females. Thus the sum of the first three terms as a percentage of the total ip (given in Tables 6 and 7) is a
TABLE 6
Mating system estimates for generation A.2.3.
Minimum ?Estimated Efficiency Allele’ t* Calculated
for S.E. Homozyqotes Homozygous I n Progeny I n Progeny Bound from of Frequencies
%2ia
-
from2
*
Estimation 5 2
s
(a
_-_
__
_ _ _ _ I_-
-.-- -----
---.- I-.90 .06 .84 .94 97 .34 .66
-
.01 .97E .98 .09
-
.97 34 .10-
.90 .03 .95.92 .07 .81 .96 99 .45
-
- 5 5 .01 .99-81 1.20 88 .26 .74
-
-.04 1.09E1
-!
-“4_
%
*07,El6 1.01 .07 .89 1.11 100 .48 .52
-
-.01 1.02p”
-
&h .97 -06 1 - 0 1 .96 97 .33 .67
-
-.02 1.031.08 .07 1.08 1.00 67 .17 - 8 3 - -.09 1.19
P&s4 .97 .07 .99 .91 90 . 7 1
-
.29 .01 .98Phos8
-
1.12 .07 1.30 1.00 75 .80 .20-
-.03 1.06-
Average estimate: t = 1.00 Average t * : 1.03
M A T I N G SYSTEM A N D ISOZYMES I N MAIZE
TABLE 7
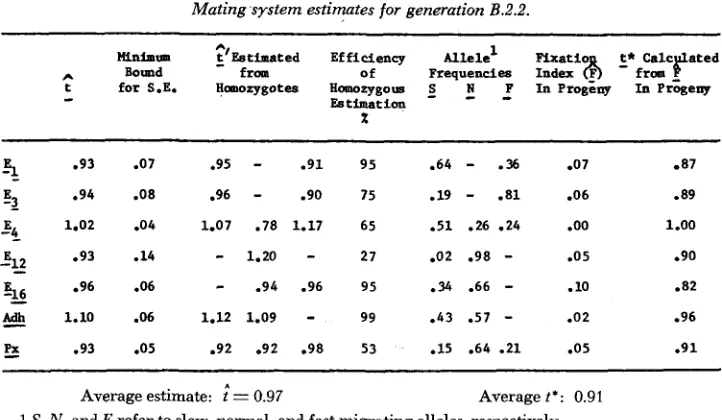
Mating system estimates for generation B.2.2.
143
Minimm ;)'Estimated Efficiency Allele' Flxatio t* c Bound fropl of Frequencies Index
6
-
from-
ES timat ion
x
t for S.E. Homozygotes Homozygous S N ,P In Progeny In Progeny
.93 .07 .95
-
.91 95 -64-
-36 8 7 87.94 .os .96
-
.90 75 .19-
.81 -06 .891.02 .04 1.07 .78 1.17 65 .51 .26 .24 .oo 1.00
-
1.20-
27 .02 .98-
-05 .90E++ e96 -06
-
.94 .96 95 -34 .66-
.10 -82 1.10 .06 1.12 1.09-
99 .43 .57-
.02 -963
53
Jg
212 O g 3 .14
2 .93 .05 -92 .92 .98 53 .15 .64 .21 .05 .91
Average estimate: = 0.97 Average t*: 0.91
S, N , and F refer to slow, normal, and fast migrating alleles, respectively.
measure of the efficiency when only the data from all the homozygous parents encountered in the experiment are included in estimating t. In all the diallelic cases, there is a close relation between this value and the gene frequency. With Q = .02 ( E l s in B.2.2) homozygous estimation is only 27% efficient, but with Q =
.35
( E , ) , it is virtually fully efficient. However, the efficiency of homozygous estimation is markedly lower in both triallelic cases ( E 4 , P,).
Thus the cases in which heterozygous females contribute substantial information about t are those involving multiallelism, or disparate gene frequencies, with moderate to high values of t.For comparison, fixation indices calculated as
E
= 1 - A/2p^Q are also given, as well as the t* statistic of ALLARD and WORKMAN (1963) which is calculated here using the transformation which assumes equilibrium under inbreeding. In Population A.2.3,E
is slightly larger than 0 for4
loci and slightly smaller than 0 for 5 loci. Similarly t* is slightly larger than 2 for 5 loci and slightly smaller or equal to2
for 4 loci. Hence in Population A.2.3 the relationship between gene and genotypic frequencies appears to follow the Hardy-Weinberg rule. However, in Population B.2.2,P
>
0 and t*<
2
for 6 of the 7 loci, suggesting that there are fewer heterozygotes in the population than expected on the basis of the mating system (2 = .97, not significantly different from 1 ).
If this deficiency of hetero- zygotes is real, the present data are not adequate to ascertain whether it is due to heterozygote disadvantage, inbreeding due to restricted population size, o r other causes.CONCLUSIONS
144 A. H. D. BROWN A N D R. W. ALLARD
earlier generations. The 12 inbred parents of the two populations differ in various attributes of mating (e.g., onset of flowering), and in early generations, before gene blocks were broken, association between these attributes and the isozyme markers might have led to deviations from random mating. The difference be- tween the present results and those of GUTIERREZ and SPRAGUE (1959) may result from the breakdown of such associations in the absence of selection. This view is consistent with the results of PATERNIANI (1969) which indicate that the degree of assortative mating in maize can be increased by selection and that this may be associated with changes in particular attributes of the reproductive system. Thus when PATERNIANI selected against intercrossing between two open- pollinated populations of maize he observed both a rapid increase in intrapopu- lational isolation and a correlated divergence in the onset of flowering of the two populations.
We wish to thank Drs. B. S. WEIR and JULIAN P. ADAMS for significant contributions made during the preparation of the manuscript, and the reviewers for their helpful suggestions.
SUMMARY
A two-step likelihood method was developed for estimating outcrossing rates from the genotypic arrays of half-sib families whose maternal parent is of un- known genotype. Application of this method to isozyme data in two open-polli- nated populations of maize yielded estimates of outcrossing equivalent to random mating. The difference between this result and earlier results indicating non- random mating in maize is discussed.
LITERATURE CITED
ALLARD, R.
w.
and P. L. WORKMAN, 1963 Population studies in predominantly self-pollinated species. IV. Seasonal fluctuations in estimated values of genetic parameters in lima bean populations. Evolution 17: 4 7 M 8 0 .Inheritance of isozyme differences among the inbred parents of a reciprocal recurrent selection population maize. Crop Sci. 9: 72-74.
-,
1969b Further isozyme differences 'among the inbred parents of a reciprocal recurrent selection population of maize. Crop. Sci. 9: 643-644.FYFE, J. L. and N. T. J. BAILEY, 1951 Plant breeding studies in leguminous forage crops. I.
Natural cross-breeding in winter beans. J. Agric. Sci. 41 : 371-378.
GUTTIEREZ, M. G. and G. F. SPRAGUE. 1959 Randomness of mating in isolated polycross plant- ings of maize. Genetics 44: 1075-1082.
HARDING, J. and C. L. TUCKER, 1964 Quantitative studies on mating systems. I. Evidence for the nonrandomness of outcrossing in P h e o l u s lunatus. Heredity 19: 369-381. -,
1969 Quantitative studies on mating systems. 111. Methods for the estimation of male gametophytic selective values and differential outcrossing rates. Evolution 23 : 85-95.
Population studies in predominantly self-pollinated species. I. Evidence for heterozygote advantage in a closed population of barley. Proc. Natl. Acad. Sci.
U. S. 46: 1371-1377.
The Measurement of Linkage in Heredity. Methuen, London. BROWN, A. H. D. and R. W. ALLARD, 1969a
JAIN, S. K. and R. W. ALLARD, 1960
M A T I N G S Y S T E M A N D ISOZYMES IN M A I Z E 145
Selection for reproductive isolation between t w o populations of maize, Zea mays L. Evolution 23: 534447.
Estimation of genetic parameters related to the mating system in populations of sorghum, Sorghum bicolor (L.) Moench. Ph.D. Thesis, Library of the Uni-
versity of California, Davis.
Outcrossing in natural populations. 11. Clarkia Unguiculata. Evolution 19: 152-156.
-,
1967 Outcrossing in natural populations. 111. The Deer Creek popula- tion of Clarkia exilis. Evolution 21: 241-248.The interpretation of population structure by F-statistics with special regard
PATERNIANI, E., 1969
RICCELLI-MATTEI, M., 1968
VASEK, F. C., 1965
WRIGHT, S., 1965
![TABLE 5 Values of [- log L] in four cases](https://thumb-us.123doks.com/thumbv2/123dok_us/1787989.1231618/10.482.66.418.379.629/table-values-log-l-cases.webp)