RECOMBINATION IN ZEA MAYS L. I. LOCATION
OF
GENES
AND
INTERCHANGES IN CHROMOSOMES
5, 6,
AND
7l
R. L. PHILLIPS
Department of Agronomy and Plant Genetics, University of Minnesota, St. Paul
Received April
IO,
196.8HE purpose of this study was to determine the gross cytological location
of
24 genes in chromosomes 5, 6, and 7 through linkages with interchanges
whose breakpoints are known. The multiple-point linkage data
(PHILLIPS
1966)
serve to place the breakpoints in relation to the genes and provide the information
for the physical locations of the genes.
RHOADES
(1936) showed that the genes
bm
(brown midrib) and
bt
(brittle
endosperm) are on opposite sides of the chromosome 5 centromere although only
two map units apart. ANDERSON,
KRAMER,
and LONGLEY
(1955) found no recom-
bination between
Y
(yellow endosperm) and T6-9e which has a break in chro-
mosome 6 at
6L.
17.
ANDERSON
and RANDOLPH
(1945) placecl the centromere on
the short arm side of
Y
in chromosome 6 and on the short arm side of
Ra
(ramosa
ear) in chromosome 7. BURNHAM
(1957) placed
Y
in the long
arm
of chromosome
6,
since
Y
and
PZ
were still linked in a stock homozygous for T5-6c which has
a
break in the short arm of chromosome 6 adjacent to the centromere. ANDERSON,
KRAMER,
and
LONGLEY
(1955) found
PI
(purple plant color) to be near 6L.47
and
sm
(salmon silk) to be proximal to 6L.49. They also showed
py
(pigmy) to
be proximal to
6L.68.
From a linkage study involving
PI
and two subterminal
knobs
(K,
and K2) in 6L, PHILLIPS
(1968) determined that P1 was near 6L.38.
The order of the genetic and knob markers and the recombination values were:
PI-18.8-K,-4.7-K,.
MATERIALS A N D METHODS
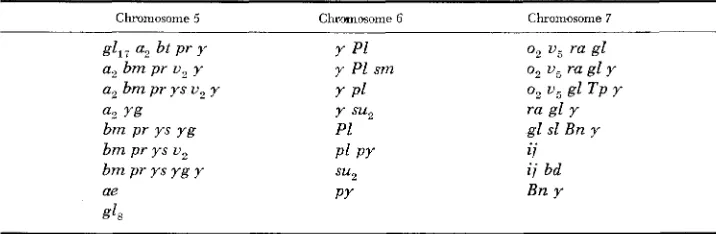
Stwcks: The genetic marker and interchange stocks listed in Tables 1 and 2, respectively, were obtained from DR. C. R.
BURNHAM
and MR. K. K. BATRA (University 09 Minnesota), DR. D. V.GLOVER (Purdue University), DR. E. B. PATTERSON (University of Illinois), and DR. D. S. ROBERTSON (Iowa State University). LONGLEY’S 1961 report was used as a guide in selecting interchanges with the desired breakpoints.
The traits which were utilized are given in the following list according to their gene order i n the chromosome
Chromosome 5 : glossy seedling (gl17), colorless aleurone (a,), brown midrib ( b m ) , brittle endosperm ( b t ) , amylose extender ( a e ) , red aleurone ( p r ) , glossy seedling (g18), yellow stripe
( y s ) , yellow green ( y g ) , and virescent seedling ( u 2 ) .
Chromosome 6: yellow endosperm ( Y ) , purple plant color ( P l ) , sugary endosperm (su2), salmon silk ( s m ) , and pigmy (py).
Chromosome 7: opaque endosperm ( 0 2 ) , virescent seedling ( u s ) , ramosa ear (ra), glossy
l From a thesis submitted UI partial fulfillment of the requirements for the Ph D degree at the University of M im e sota, S t Paul Journal Paper No 6501, Minnesota Agncultural Expenment Statlon
108
R. L. PHILLIPSTABLE 1
Genetic marker stocks utilized+
Chromosome 5 Chromosome 6 Chromosome 7
*
Certain stocks were segregating for one or more of the traits.seedling ( g l ) , teopod ( T p ) : slashed ( s l ) , iojap striping ( i j ) > brown aleurone ( B n ) , and branched silkless ( b d )
.
Experimental field methods: The genetic marker stocks were crossed to those interchange stocks with breakpoints near the loci of the genes carried by the marker stocks. Reciprocal back- cross progeny were obtained using the same F, plant and the same tester plant (F,'s heterozygous for the genes py, T p , Bn, and bd were backcrossed only as the female parent). The presence of the interchange in the backcross progeny was detected by pollen classification in the field. Some ears were classified for sterility at maturity, especially those of rare crossovers, as a check on the pollen classification.
Cytology of interchanges: The breakpoints of each interchange were determined cytologically from heterozygotes and/or homozygotes. Homozygotes were particularly useful (1) in deter- mining if the break was in the satellite; nucleolus organizer, or short arm of chromosome 6; and (2) in checking on which side of a morphologically-distinct chromosome marker (chromosome knob or centromere) was the breakpoint. The precise breakpoints could be calculated easily from the homozygote drawings when the break was in the nucleolus organizer. Aceto- or propiono- carmine smears on microsporocytes fixed in 3 parts 95% ethyl alcohol : 1 part glacial acetic acid and stored in 70% ethyl alcohol provided good pachytene figures. Measurements were made from camera lucida drawings of these figures. Chromosome 10 was always identified to be certain abnormal 10 was not present.
Pollen sterility of plants heferozygous for interchanges: Tassel branches were obtained from at least two heterozygous plants of each interchange and more than 500 pollen grains from the middle one-third of an anther from each plant were stained with an aqueous solution of I, and KI. Each pollen grain was scored as either (1) normal, ( 2 ) devoid of starch and smaller than normal, (3) partially-filled with starch but nxmal size, (4) well-filled but smaller, o r (5) par- tially-filled but smaller. Classes 2 through 5 were considered as aborted in calculating the percent abortion.
Calculation of recombination ualues: Multiple-point linkage data provided the basis for determining the order of the interchange breakpoint in relation to the genes. In backcrosses involving heterozygotes for interchanges T5-6b, T5-6d, T5-6 (8219), and T6-7 (027-6), the genetic data indicated that one df the deficiency plus duplication gametes was transmitted through the egg but not through the pollen. Since certain phenotypic classes among the fertile progeny in these cases may contain both crossovers and noncrossovers, the recombination percentages are based only on the partially sterile progeny (interchange heterozygotes). For chromosome 5 tests, only the A, (colored) kernels were used in calculating recombination percentages in regions involving Pr, since Pr and pr cannot be distinguished in the a2 (colorless) class.
POSITIONS OF GENES AND INTERCHANGES IN
Zea
mays
109
the formula
p
=
___. '(I' where pi represents one of the recombination values obtained from a cross between a particular pair of interchange and genetic marker stocks andIi
is the informa-tion calculated by the formula I'
=
.
The standard error of the weighted mean wascalculated by S.E.
p
=
vx.
z
Iil
(S.E. P , ) 2
Z I i
RESULTS A N D DISCUSSION
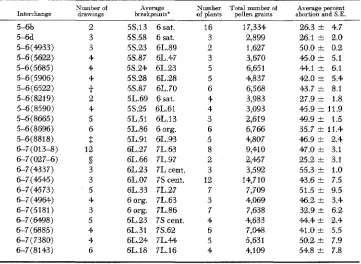
Interchanges T5-6b, T5-6d, and T5-6(8219) all have a break in the satellite
of chromosome 6 and have approximately 27% pollen sterility (Table
2 ) ,
since
only alternate and adjacent
1
disjunctions occur in interchange heterozygotes
with chain configurations
(BURNHAM
1950)
and spores deficient for the satellite
TABLE 2
Breakpo-'nt and sterility determinations of the interchanges utilized, arranged by their identification number
Number of Average Number Total number of Average percent
Interchange drawings breakpoints' of dants callen mains abortion and S.E.
5-6b 5-6d 5-6 (4933) 5-6 (5622) 5-6 (5685) 5-6(5906) 5-6( 6522) 5-6(8219) 5-6 (8590) 5-6( 8665) 5-6 (8696) 5-6 (881 8)
6-7 (027-6) 6-7 (433 7) 6-7(4545) 6-7 (45 73) 6-7(4964) 6-7 (51 81 ) 6-7 (6498) 6-7 (6885) 6-7 ( 7380) 6-7 (013-8)
6-7 ( 81 43)
2 3 3 4 4 4 2 4 5 6
2
12s
3 3 5 4 3 5 4 4 6i
5S.13 6sat. 58.58 6sat. 5S.23 6L.89 5S.87 6L.47 58.24 6L.23 5S.28 6L.28 5S.87 6L.70 5L.69 6sat. 5S.25 6L.61 5L.51 6L.13 5L.86 6org. 5L.91 6L.93 6L.27 7L.63 6L.66 7L.97 6L.23 7L cent. 6L.07 7s cent, 6L.33 7L.27 6org. 7L.63 6org. 7L.86 6L.23 7s cent. 6L.31 78.62 6L.24 7L.44 6L.18 7L.16
.
-16 17,334 26.3 f 4.7 3 2 3 5 5 6 4 4 3 6 5 8 2 3 12 7 3 7 4 6 5 4 2,899 1,627 3,670 6,65 1 4,83 7 6,568 3,983 3,093 2,619 6,766 4,807 9,410 2,447 3,592 14,710 4,069 7,638 4,633 7,048 5,631 4,109 7,7m
26.1 i 2.0 50.0 f 0.2 45.0 i 5.1 44.1 t 6.1 42.0 k 5.4 43.7 t 8.1 27.9 t 1.8 45.9 t 11.9 49.9 t 1.5 35.7 i 11.4 46.9 t 2.4 47.0 t 3.1 25.2 i. 3.1 55.3 & 1.0 43.6 t 7.5 51.5 t 9.5 46.2 f 3.4 32.9
*
6.2 44.4 f 2.4 41.0 f 5.5 50.2 f 7.9 54.8 i 7.8~~~ ~ ~~
*
For example, 5S.13 means the breakpoint is 13% of the distance from the centromere to the+
Breakpoints are those determined by LUNGLEY (1961).$ LONGLJX'S breakpoints (1961) except 5s changed to 5L to agree with the genetic results of
$j Unable to assign breakpoint values due to frequent asynapsis near the ends of both chromo- end of the short arm of chromosome 5.
sat.
=
satellite org. = nucleolus organizer cent.=
near centromerethis report.
110
R . L. PHILLIPSfail to abort. These pollen grains are normal in appearance but carry a duplica-
tion which makes them unable to compete with normal pollen grains. For two
of the three interchanges with a break in the nucleolus organizer region of chro-
mosome 6, T5-6(8696) and T6-7(5181), about
35%
of the pollen was aborted
(the high standard error for T5-6(8696) resulted from variation (15-20%) in
the frequency of the “well-filled but smaller” pollen class). The break was far
out in the other chromosome in both of these cases whereas the third interchange
with a break in the nucleolus organizer, T6-7 (4964), had a break nearer the
middle of the arm of the other chromosome and possessed about 46% pollen
abortion with essentially no “well-filled but smaller” pollen grains. The genetic
data indicate, however, that the gametes deficient for part of the nucleolus organ-
izer do not function in any of these three interchanges.
The standard errors for the average percent pollen abortion (Table 2) indicate
considerable variation between plants heterozygous for the same interchange. The
reason for this variation is
not
apparent. The variation within a plant was not
assessed since only one count per plant was made.
TABLE 3
Mean linkage intensities between genes in chromosome 5 and
T5-6
interchangesRegion
61,,-5-6(6522) A,-5-6( 5622)
5-6( 6522) 5-6d 5-6(5906) 5-6( 8590) 5-6( 5685) 5-6( 4933) 5-6b Bm-5-6(8590)
5-6 (5685) 5-6(5685) 5-6 (5685)
5-6b Bt-5-6b Ae-5-6 (5 685 )
Pr-5-6 (8696) G1,-5-6 (5685)
5-6b 5-6(4933)
5-6b
Ys-5-6 (8818) V,-5-6 (8696) Yg-5-6 (8696)
Breakpoint
in J
Number
of ‘plants Percent recombination and S.E.’
5S.87 5S.87 58.87 5S.58 5S.28 5s.25 5S.24 5S.23 5IS.13 5s.25 58.24 58.24 5S.24 5S.23 5S.13 5S.13 5S.24 5B.13 5L.86 5S.24 5S.13 5L.91 5L.86 5L.86
162 410 391 692 258 480 273 377 25 3 532 912 475 169 B 2 247 253 633 818 74 147 117 495 555 254
46.6
*
7.8 33.2 f 2.3 34.8 -+ 2.4 7.0 f 1.1 3.3 f 1.2 1.9 i- 0.7 3.7 f 1.1 6.4 zk 2.5 1.5 zk 1.1 0.8 i- 0.7 2.9 f 0.w 6.3 f 1 . l t 7.6 t 2.04- 2.8 k 1.0 2.7 k 1.0 7.5 f 1.7 18.3 f 1.5 17.7 f 1.5 31.1 t 5.4 20.3 C 3.3 22.2 f 4.0 11.5 f 1.4 7.9 f 1.1 11.6 t 3.8*
The percent recombination and standard error are weighted values including all of the dataPOSITIONS OF GENES AND INTERCHANGES IN
Zea mays
111
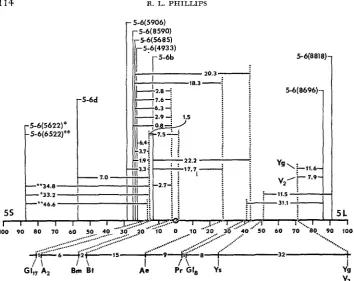
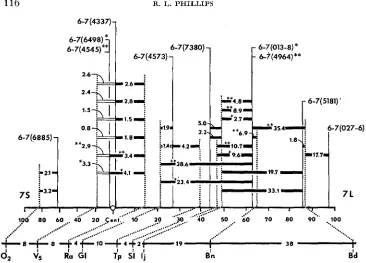
The multiple-point linkage data (see
PHILLIPS
1966)
were used to place the
breaks in relation to the genes and to determine the gross cytological locations
of
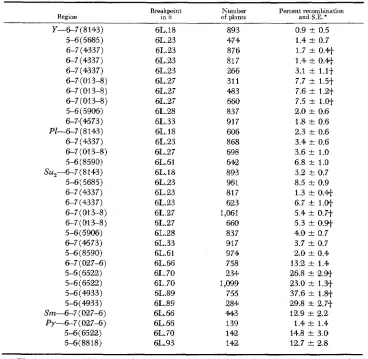
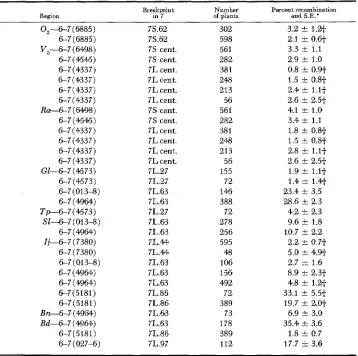
the genes. Tables
3,
4,
5 ,
and
6
give the weighted mean percent recombination
and standard
error
computed from all the data involving a particular pair of
genetic marker and interchange stocks. The results and the approximate cyto-
logical locations of the various genes are illustrated in Figures
1,
2, and
3 .
These
are gross placements and should not be regarded as the exact positions
of
the
genes. The locations are subject to the variation inherent in the cytological break-
point determinations and the recombination estimates, which may be affected by
the genetic background of the stocks employed.
TABLE 4
Mean linkage intensities between genes in chromosome 6 and T5-6 and T6-7 interchanges
Breakpoint Number Percent recombination
Region in 6 of plants and SE.*
Y-67 (8143) 5-6 (5fj85) 67(4337) 6 7 (4337)
6 7 (013-8) 67(013-8) 6-7 (4337)
6 7 (01 3-8) 5-6(5906) 678(4573)
6 7 (4337) PZ-67(8143)
6-7(013-8) 5-6 (8590) Su2-6-7 (8143) 5-6(5685) 6 7 (4337) 6-7 (4337) 6-7(013-8) 6 7 (013-8) 5-6(5906) 6-7(4573) 5-6(8590) 6-7(027-6) 5-6( 6522) 5-6 (6522) 5-6(4933) 5-6( 4933) S m A 7 (027-6)
Py-67 (027-6) 5-6( 6522) 5-6( 8818)
6L.18 6L.23 6L.23 6L.23 6L.23 6L.27 6L.27 6L.27 6L.28 6L.33 6L.18 6L.23 6L.27 6L.61 6L.18 6L.23 6L.23 6L.23 6L.27 6L.27 6L.28 6L.33 6L.61 6L.66 6L.70 6L.70 6L.89 6L.89 6L.66 6L.66 6L.70 6L.93 893 474 876 817 266 31 1 483 660 837 917 606 868 698 642 893 961 81 7 623 1,061 660 837 91 7 9 74 758 234 1,099 755 284 443 139 142 142
0.9 t 0.5 1.4 t 0.7 1.7 t 0.41- 1.4 +- 0 . q 3.1 t 1.l-f 7.7 t 1.5-f 7.6 t 1.2t
2.0 t 0.6 1.8 t 0.6 2.3 t 0.6 3.4 t 0.6 3.6 t 1.0 6.8 t 1.0 3.2 t 0.7 8.5 t 0.9 1.3 t 0 . q 6.7 t 1.w 5.4 t 0.7t
4.0 k 0.7 3.7 t 0.7 2.0 t 0.4 13.2 t 1.4 26.8 t 2.w 23.0 t 1.3t 37.6 t 1.8t 29.8 t 2.7-t 12.9 t 2.2
1.4 3- 1.4 14.8 t 3.0 12.7 t 2.8 7.5 3- 1.w
5.3 t 0.9-f
*
The percent recombination and standard error are weighted values including all of the data -f Results cif tests with different genetic marker stocks.112
R. L. PHILLIPSTABLE 5
Mean linkage intensities between Y and T5-6 and T6-7 interchanges obtained f r o m crosses i n d u i n g chromosome 5 or 7 genetic marker stocks
Region Breakpoint in 6
Number of plants
Y-5-6b 5-6(8219) 6-7 (W64)
6-7 (4964) 5-6( 8696) 5-6( 8696) 6-7 (4964)
6-7(4545) 5-6( 8665) 5-6 (8665) 5-6( 8665) 5-6 (8665) 6-7 (m98)
5-6 (5 685) 5-6(5685)
5-6 (5685) 5-6 (5685)
67(4337) 6 7 (433 7) 67(4337)
6-7 (013-8) 6 7 ( 01 3-8) 5-6 (5906) 6 7 (6885)
6 7 (4573) 5-6 (5622) 5-6(8590) 5-6 (6522) 6-7 (6885)
5-6 (4933) 5-6( 88 18)
sat. sat. org. org. org. org. org. 6L.07 6L.13 6L.13 6L. 13 6L. 13 6L.23 6L.23 6L.W 6L.23 6L.23 6L.23 6L.23 6L.23 6L.27 6L.27 6L.28 6L.31 6L.31 6L.33 6L.47 6L.61 6L.70 6L.89 6L.93 117 175 256 388 255 74 565 282 594 695 244 396 332 273 931 147 474 199 56 208 278 146 226 5 98 152 72 410 764 356 659 495 Percent recombination and S.E.' 5.9 f 2.2 17.7 i- 2.9 4.2 f 1.3t 3.5 0.w 10.3 f 3 . q 4.1 t 2.3t 9.9 t 1.3t 1.2 f 0.6 4.9 t 0.9t 1.9 f a.5-t 0.5 & 0.5t 1.6 t 0.5-f 1.9 & 0.9 1.1 f o.st 1.0 &
0.41
7.7 t 2.2t 3.2-+
1.41
4.4 & 2.2t 2.6 f 2.51- 2.2 t 1.2-t 8.8 f 1.71 5.2 f 2.2+ 2.5 f 1.1 6.0 f 1.w 5.3 t 1.81 4.2 2 2.3 31.5 f 2.3 38.0 1.1.7 43.4 t 2.6 48.8 f 1.9 47.9 f 2.2
*
The percent recombination and standard error are weighted values including all of the datat
Results d tests with different genetic marker stocks.(see MATERIALS AND METHODS).
The order of the genes with respect to the various breakpoints is believed to be
correct in all cases for chromosome 5. The order
is
not known
for
Y
and "5-6
(8665) or T6-7 (6498)
p y
and T5-6 (8590)
T p ,
SI,
o r
ij
and T6-7 (7380) or
B n
and T6-7 (4964).
POSITIO NS O F G E N E S A N D I N T E R C H A N G E S IN
Ze@
mCl’)5TABLE 6
Mean linkage intensities between genes in chromosome 7 and T6-7 i n t e r c h g e s
113
Region
0,-67 (6885) 6-7 (6885) V,-67 (6498)
6 7 (4545) 67(4337) 6-7 (4337) 6-7 (4337)
Rrr-6-7 (6498)
6-7 (4545) 6-7(4337) 6 7 (4337)
6-7 (4337) 6 7 (4337) 6-7 (4337) GZ-6-7(4573)
6-7 (4573)
6-7 (4964) Tp-6-7(4573)
SI-6-7 (01 3-8 ) 6-7 (4.964) Ii-6-7 (7380)
6-7 (7380) 6-7 (013-8) 6-7(4.964) 6-7 (4964) 6 7 (5181 ) 6-7(5181) Bn-6-7 (4964) Bd-67 (4964) 6-7 (013-8)
6-7 (51 81 ) 6-7 (027-6)
Breakpoint
in 7
7S.62 7S.62 7s cent. 7s cent. 7L cent. 7L cent. 7L cent. 7L cent. 7s cent. 7s cent. 7L cent. 7L cent. 7L cent. 7L cent. 7L.27 7L.27 7L.63 7L.63 7L.27 7L.63 7L.63 7L.M 7L.M 7L.63 7L.63 7L.63 7L.86 7L.86 7L.63 7L.63 7L.86 7L.97 Number
of plants
302 598 561 282 381 248 21 3 56 561 282 38 1 248 213 56 155 72 146 388 72 278 256 595 48 106 156 492 72 389 73 178 389 112
Percent recombination
and S.E.’
3.2 t 1.2+ 2.1 t 0.61
3.3 t 1.1 2.9 t 1.0 0.8 f 0.w 1.5 t 0.81. 2.4 t 1.11. 2.6 t 2.5.f 4.1 t 1.0 3.4 f 1.1 1.8 t 0.8-j- 1.5 f 0.8t 2.8 t 1.11. 2.6 t 2.5.f 1.9 f 1.11. 1.4 t 1.41 23.4 i 3.5 28.6 f 2.3 4.2 f 2.3 9.6 t 1.8 10.7 f 2.2 2.2 f 0.71. 5.0 t 4.91 2.7 t 1.6 8.9 t 2.3.f 4.8 f 1 . w 33.1 f 5.5.f
19.7 t 2.01- 6.9 & 3.0 35.4 t 3.6 1.8 f 0.7 17.7 k 3.6
*
The percent recombination and standard error are weighted values including all of the datat
Results df tests with different genetic marker stocks.Individuals heterozygous for an interchange may have reduced recombination
in the vicinity of the breakpoint.
BURNHAM
(1962) relates the effect on recom-
bination to non-homologous pairing which occurs when the pachytene “cross”
is
not at its true position.
If
the
interchange breakpoint is in a region where crossing
over is normally low ( f o r example, near centromeres)
,
the effect on recombination
may not be discernible.
ANDERSON,
KRAMER
and LONGLEY
(1955) found that interchanges between
Y
and
P2
caused a reduction in recombination between
Y
and
PZ
from a normal value
of about
31%
to less than 10%. This result also was obtained in this study and
can be extended to include
Su,
(Figure 2 ) . Interchanges T5-6(4933), (6522),
114
R. L. PHILLIPSS - 6 d 5-6(5622)* 5-6(6522)**
I
7.0-
k . 3 3 . 2 **34.8
5 5
i
5-6(5906)
5 1
I
I 100%6(8818)-
22.2
....
....
....
...
...
...
...
..
..
..
..
..
:.
:I
.
'..r
100 90 80 70 60
....:
:::
4i+6r;i
15...
1 32 I
/ \
I
I
Pr GI8
Ys
ysV2
I \
I
Ae
/ \
GIt7 A, Bm Bf
FIGURE
1.-Gross cytological locations of chromosome 5 genes and their mean linkage intensities with T5-6 interchanges (adapted from Table 3). The dashed vertical lines indicate the gross cytological position of the genes and the solid vertical lines indicate the interchange breakpoints. Contiguous double and solid horizontal lines indicate both genes were segregating in the same test. Two interchanges having breaks at the same position are distinguished by a*
and**.
The standard recombination values given in the genetic map are from =YES, IMMER,and SMITH (1 955).
(8590), and T6-7(027-6) have breaks distal to the
Y-Su,
region and did not affect
recombination in the
Y-Su,
region. Interchanges T5-6(5685), (5906), T6-7(013-
S), (4337), (4573), and (8143), however, have breaks within the
Y-Su,
region
and recombination was drastically reduced in that region. The
Y-PI
region was
also tested in heterozygotes f o r T6-7(013-8) and T6-7(4337) and reduced recom-
bination values were obtained. Low recombination values were obtained between
Y
and interchange breakpoints in the long arm proximal to 6L.33, whereas high
values were obtained when the breakpoint was at or distal to 6L.47 (Table 5 ) .
Little information was obtained
fd
chromosome 5 on recombination in the
immediate vicinity of the breakpoint, since only one interchange utilized in the
study had a breakpoint which mapped within the extremes
of
the chromosome 5
linkage group. For chromosome 7, the recombination values were generally
reduced around the breakpoint but inconsistencies were present.
POSITIONS OF GENES AND INTERCHANGES IN
Zea
mays
115
5-6(8818)-
29.8-
FIGURE
2.-Gross cytological locations of chromosome 6 genes and their mean linkage intensities with T5-6 and T6-7 interchanges (adapted from Table 4). The dashed vertical lines indicate the gross cytological position of the genes and the solid vertical lines indicate the inter- change breakpoints. Contiguous double and solid horizontal lines indicate both genes were segre- gating in the same test. Two interchanges having breaks at the same position are distinguished by a*
and**.
The standard recombination values given in the genetic map are fromHAYES,
IMMER, and SMITH (1955).
S U M M A R Y
The gross cytological positions of
24
genes in chromosomes
5 ,
6, and 7 were
determined from multiple-point linkage data involving these genes and
23
selected
T5-6 and T6-7 interchanges. Pachytene analyses of the heterozygous and/or
homozygous interchanges furnished the evidence for determining the break posi-
tions and checked those reported previously. The percent pollen abortion was
determined for each interchange when heterozygous.
L I T E R A T U R E C I T ED
ANDERSON, E. G., H. H. KRAMER, and A. E. LONGLEY, 1955 Translocations in maize involving chromosome 6. Genetics 40: 531-538.
ANDERSON, E. G., and L. F. RANDOLPH, 1945 Location of centromeres on the linkage maps of maize. Genetics 30: 518-526.
116
R. L. PHILLIPS6-7(4337)
6-7(7380) 6-7(013-8)* 6-7(4573) 6-7(4964)
**
1.5
k2.1-
7s
F-
.
.
.
.
7 L.
.
.
.
: :
...
....
...
...
...
f..
%.2
38 I
d2
\I,
a,
GIsi
I;d"
dd FIGURE 3.-Gross cytological locations of chromosome 7 genes and their mean linkage inten- sities with T6-7 interchanges (adapted from Table 6). The dashed vertical lines indicate the gross cytological position of the genes and the solid vertical lines indicate the interchange breakpoints. Contiguous dsuble and solid horizontal lines indicate b3th genes were segregating in the same test. Two interchanges having breaks at the same pasition are distinguished by a*
and**.
The standard recombination values given in the genetic map are from HAYES, IMMER, and SMITH (1955).HAYES, H. K., F. R. IMMER, and D. C. SMITH, 1955
LONGLEY, A. E., 1961
Methods of PZand Breeding, 2nd Edition. McGraw-Hill, N.Y.
Breakage points for four corn translocation series and other corn chromo- some aberrations maintained at the California Institute of Technology. U.S. Dept. Agr., Agr. Res. S e n . ARS 34-16,M pp.
Cytogenetic studies of recombination in reciprocal crosses and the loca- tion of genes in Zea mays. L. Ph.D. Thesis, Univ. of Minnesota (Diss. Abstr. 28: 57, 1967). PHILLIPS, R. L
,
1966__ 5 9 : 56.
1968 Cytogenetic location of the gene f o r purple plant color in maize. J. Heredity