TEST FOR SELECTION ON POLYMORPHIC ISOZYME GENES USING THE POPULATION CAGE METHOD*
TERUMI MUKAI AND TSUNEYUKI YAMAZAKI
Department of Biology, Kymshu University 33, Fukuoka 812, Japan
Manuscript received September 6, 1979 Revised copy received July 31, 1980
ABSTRACT
Published experimental data of several species of Drosophila using the population cage method were reexamined. The authors of these works have claimed that selection operates on polymorphic isozyme genes. Since selection coefficients (s) estimated by us for the above data, assuming overdominance, or for some cases, additivity between alleles, were too large (s
>
O.l), we con- clude that these experimental results do not reflect the effects of the single loci in question; rather, we suggest that careful experimentation and judgment are required for testing with the population cage method whether or not selection actually operates on single genes.O N E of the most frequently used methods for demonstrating the existence of selection at enzyme loci in the laboratory is the population cage method. The changes in allele frequency are traced in cage populations, usually starting from two different allele frequencies. In some experiments, little changes in allele fre- quency were observed in carefully controlled genetic backgrounds (e.g., YAMA- ZAKI 3971), but in most work it has been observed that allele frequencies con- verged to certain intermediate equilibrium frequencies. This has been taken to imply the presence of balancing selection at the locus in question or at blocks of genes that include the locus (AYALA and ANDERSON 1973; FONTDEVILA et al.
1975; VAN DELDEN, BOEREMA and KAMPING 1978, and others)
,
and many authors have claimed that they proved the selection on polymorphic isozyme loci.In the present paper, we shall present estimates of selection coefficients for some
of the above experiments. It is questionable whether or not selection is operating on the loci themselves, since the estimated selection coefficients are large enough to indicate that selection acted on gene blocks that include the loci in question. As
the form of balancing selection, we assume only overdominance or heterozygote superiority. The estimated selection coefficients, assuming this model, may not be different in order of magnitude from those assuming other balancing selection models. In the single-locus model, in which there are two alleles, A and a, with frequencies of p and 4 ( p
+
Q = 1 .O),
respectively, the fitnesses of AA, Aa, and aa are assumed to be ( l--sl), 1, and ( l--sz),
respectively. When the overdomi- nance model was not applicable, the additive model was used. In this case, the Paper No. 9 from the Laboratory of Population Genetics, Kyushu University, Fukuoka, Japan. This work was supported by Research Grant No. 348003 from the Ministry of Education, Science and Culture of Japan.538 T. M U K A I A N D T. YAMAZAKI
fitnesses of AA, Aa and aa were assumed to be 1, (l-sz) and (1-s), respec- tively. I n the case of a sex-linked gene, the fitnesses of A and a males were as- sumed to be the same as those of A A and aa females, respectively. Two different approaches were used in estimating the selection coefficients for the above popu- lation cage experiments: analytical methods and computer simulations.
Analytical method: The following approximate relationships among the num- ber of generations ( n )
,
allele frequencies of a at the starting and the last genera- tions ( g o and gn), under the condition that the selection coefficient is small in comparison with unity:(1 For the overdominance model (only €or autosomal loci) :
. . .
(1) (2) For the additive model (only for autosomal loci) :The process of estimation of the selection coefficients is as follows: W e have estimated approximate equilibrium gene frequencies of a (@) from the data. This can be done reasonably well since, in most of the experiments, the gene frequen- cies have reached points very close to the equilibria, From the @ value, whose ex- pected value is sl/(s1+s2), it is possible to estimate the ratio of s2 and sl. From this relationship and formula ( 1 )
with
go, qn and n, it is possible to estimate SIand sz. These estimates are not accurate for the following reasons: (1) It was
assumed in deriving formula ( 1 ) that s1 and sz are small relative to 1, and (2) the equilibrium gene frequencies were intuitively estimated. I n spite of this, the estimates are sufficiently useful for the present discussion.
When reasonable selection coefficients were not estimated (negative or larger than 1 ) even for an extreme value of @ (0.001 or O.999), it was judged that the equilibrium allele frequency cannot be reached, and the overdominance model was not applied. In such cases, the additive model [formula
(e)]
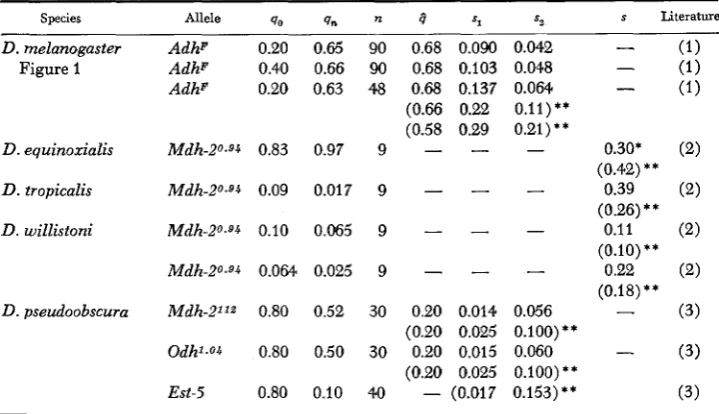
was employed for the estimation of s.The names of the species, enzyme allele, go, gn,
3,
n and the estimated selection coefficients are listed in Table 1, together with the name of the authors of the papers from which the data were taken. Generally speaking, the estimated selection coefficients are too large.Computer simulation: We also conducted computer simulations using a
FACOM 192 to estimate the selection coefficients of the individual genotypes in the above cage experiments and to check the approximate selection coefficients es:jmated above. Simulations were performed under overdominance and semi- dominance selection models (described above), depending on the results of the approximate selection coefficients.
P O P U L A T I O N CAGE M E T H O D 539
TABLE 1
Estimation of selecticm coeficients of genotypes that were exposed to natural selection in population cages
D. melanogaster AdhF 0.20 0 . 6
Figure 1 AdhF 0.40 0.66
AdhF 0.20 0.63
D . equinoxialis Mdh-20,94 0.83 0.97
D . tropicalis Mdh-20.04 0.09 0.017
D . willistoni Mdh-20.04 0.10 0.065
Mdh-20.94 0.064 0.025
D . pseudoobscura Mdh-P** 0.80 0.52
Odh1.04 0.80 0.50
Est-5 0.80 0.10 90 90 48 9 9 9 9 30 30 40
0.68 0.090 0.042 0.68 0.103 0.048 0.68 0.137 0.064 (0.66 0.22 0.11)** (0.58 0.29 0.21)**
-
-
-
0.20 0.014 0.056
0.20 0.015 0.060 (0.20 0.025 0.100)**
(0.20 0.025 0.100) * *
-
(0.017 0.153)**0.30* (2)
0.39 (2)
0.11 (2) (0.10)**
0.22 (2)
(3) (0.42) **
(0.26)
*
*(0.1 8) * *
-
(3)
~~
* Selection coefficient for the allele, the frequency of whose alternative allele (Mdh0.94) was
** The numbers in parentheses were estimated by computer simulations.
(1) VAN DELDEN, BOEREMA and KAMPING (1978); (2) AYALA and ANDERSON (1973); (3)
qo, qn and 4: The allele frequencies at the starting, the nth generation and at the equilibrium n: Number of generations that have elapsed.
s1 and s2: Selection coefficient of respective homozygotes in the overdominance model. s: Selection coefficient of less fit homozygote in the additive model.
traced.
FONTDEVILA et al. ( 1975). state, respectively.
performed with several population sizes ( 2 N ) . Since no significant differences were observed among the runs of different population sizes (2N = 500 to 4000), only the results obtained with 2 N ' = 4000 for D . melanogmter are shown in Figure 1, together with the original data (VAN
DELDEN,
BOEREMA
and KAMPING540 T. MUKAI A N D T. YAMAZAKI
I
A A : A a : a a = 0.986 : 1 : 0.990 (1) = 0.821 : 1 : 0.870 ( 2 ) = 0.710 : 1 : 0.790 ( 3 )
= 0.780 :1:0.890 ( 4 )
u1 0.8
a,
.3
U
al
0.6
LI
‘U
al
r l f 0 . 4 a:
4
0.2
- - -
G O . 2 0 1 G O . 8 0 1G O . 8 O I I GO.ZOI[
(1)
I
20 30 40 50 6 0 70 80 90
0 10
Generations
FIGURE 1.-The changes in allele frequencies at the alcohol dehydrogenase loci i n population cages and those obtained by computer simulation. Solid line indicates D. melanogaster data from
VAN DELDEN, BOEREMA and KAMPING (1978). Dotted lines show the results of computer simula-
tions. Population sizes were assumed to be 4,000 in all simulations. Fitnesses of AA, Aa and an are shown in the figure f o r each computer simulation.
Autosomal overdominance model was applied. Two different equilibrium frequencies (0.66
and 0.58) were assumed. One generation was assumed to be 15 days.
noxialis and D. tropicalis. Even at the other loci, the estimated values were over
10%. We believe that selection coefficients of over 10% are much too large for the effect of single locus. (2) It takes a long time for the population to reach an equilibrium in allele frequency if the selection coefficient is a few percent, even in the case of a finite population size, as was theoretically predicted.
Incidentally, SCHAFFER, YARDLEY and ANDERSON (1977) modified FISHER and
FORD’S (1947) method of testing whether the change in gene frequency in a cage population is mainly due to selection or to random genetic drift. YARDLEY, ANDERSON and SCHAFFER (1977) applied this method not only to their own data, but also to some of the available published data. However, evidence for selection with respect to polymorphic isozyme genes could not be obtained. The data of
AYALA and ANDERSON (1973) were also analyzed by them, but no significant selection was detected, in contrast to the large selection coefficient estimated in
the present studies. This difference may be due to insufficient power of the method of SCHAFFER, ANDERSON and YARDLEY.
I n recent papers, it has been reported that linkage disequilibrium among iso-
POPULATION CAGE METHOD 541 and
VOELKER
1977). This finding, together with that ofFRANKLIN
andLEWON-
TIN (1970) and of
YAMAZAKI
(1974), may reject the generality of overdominance and frequency-dependent selection. Furthermore, selection with respect to via- bility and fertility could not be detected even after accumulating the heterozygous effects over three loci (MUKAI,WATANABE
and YAMAGUCHI 1974). These experi- mental results are also inconsistent with the results listed in Table 1, which are most probably due to linkage disequilibria that were formed in the process of initiating the experimental populations, although some authors had attempted to avoid these phenomena. The effects of linkage disequilibria in cage populations on the maintenance of polymorphisms have already been well demonstrated experimentally(JONES
and YAMAZAKI 1974; POWELL and RICHMOND 1974). It is most difficult to prove selection for lociwith
extremely small selection co- efficient, using the population cage technique, since it takes a long time to reach equilibrium and since the effect of selection is easily covered by random genetic drift and linkage disequilibrium,In conclusion, the results of the experiments claiming the proof of natural se- lection on isozyme loci using the population cage technique cannot be accepted. It is most likely that these results were obtained because of the linkage disequi- libria in natural populations due to random genetic drift or those produced artificially during the process of initiating cage populations.
We are grateful to HENRY E. SCHAFFER for his editorial corrections and suggestions.
LITERATURE CITED
AYALA, F. J. and W. W. ANDERSON, 1973 Evidence of natural selection in molecular evolution. Nature New Biol. 241 : 274-276.
DELDEN, W. VAN, A. C. BOEREMA and A. KAMPING, 1978 The alcohol dehydrogenase polymor- phism in populations of Drosophila melanogaster. I. Selection in different environments. Genetics 90: 161-191.
FISHER, R. A. and E. B. FORD, 1947 The spread of a gene in natural conditions in a colony of the moth Panaxla dominula L. Heredity 1: 143-174.
FONTDEWLA, A., J. MENDEZ, F. J. AYALA and J. MCDONALD, 1975 Maintenance of allozyme polymorphisms in experimental populations of Drosophila. Nature 255: 149-151.
FRANKLIN, I. and R. C. LEWONTIN, 1970 Is the gene the unit of selection? Genetics 65: 707-734.
JONES, T. S. and T. YAMAZAKI, 1974 Genetic background and the fitness of allozymes. Genetics
MUKAI, T. and R. A. VOELKER, 1977 The genetic structure of natural populations of Drosophila
melanogaster. XIII. Further studies on linkage disequilibrium. Genetics 86 : 175-1 85.
MUKAI, T., T. K. WATANABE and 0. YAMAGUCHI, 1974 The genetic structure of natural popula- tions of Drosophila mlanogaster. XII. Linkage disequilibrium in a large local population. Genetics 77: 771-793.
Founder effects and linkage disequilibria in experi- mental populations of Drosophila. Proc. Natl. Acad. Sci. U.S. 71: 1663-1665.
Drift or selection: a statistical test
of gene frequency variation over generations. Genetics 87: 371-379.
78: 1185-1189.
POWELL, J. R. and R. C. RICHMOND, 1974
542 T. M U K A I AnTD T. YAMAZAKI
YAMAZAKI, T., 1971 Measurement of fitness at the esterase-5 locus i n Drosophila pseudoobscura.
Genetics 67: 579-603. -, 1974. Organization of linked genes under frequency de- pzndent selection of minority advantage. Japan. J. Genetics 49: 33-36.
Gene frequency changes at the a- amylase locus in experimental populations of Drosophila pseudoobscura. Genetics 87 :
357-369.