Review
A systematic review of the basis for WHO's new
recommendation for limiting aircraft noise
annoyance
Truls Gjestland
SINTEF DIGITAL, Trondheim, Norway; truls.gjestland@sintef.no Correspondence: truls.gjestland@sintef.no; Tel.: +47 932 05 516
Abstract: The new WHO Environmental Noise Guidelines for the European Region have recommendations for limiting noise exposure associated with adverse health effects. The limits are said to be based on a systematic review of existing evidence. This paper gives a systematic assessment of the presented evidence with respect to aircraft noise annoyance and demonstrates that the new guidelines are based on an arbitrary selection of existing studies comprising an imperfect and faulty set of data not representative for the general airport population.
Keywords: aircraft noise; annoyance, dose-response, environment, WHO guidelines
1. Introduction
The World Health Organization just recently published their report Environmental Noise Guidelines for the European Region [1]. The report is the result of the joint effort by a team of researchers covering all aspects of negative health effects by exposure to environmental noise. According to WHO, the main purpose of these guidelines is to provide recommendations for protecting human health from exposure to environmental noise originating from various sources.
WHO stresses that all reasonable precautions have been taken to verify the information contained in the publication. However, the published material is being distributed without warranty of any kind from WHO, and to be on the safe side, they state that the responsibility for the interpretation and use of the material lies with the reader.
This reservation is very appropriate regarding the guideline's chapter on aircraft noise annoyance. In the new guidelines WHO strongly recommends «reducing noise levels produced by aircraft below 45 dB Lden, as aircraft noise above this level is associated with adverse health effects».
This recommendation is based on the idealistic assumption that nobody should ever be exposed to noise levels which endanger complete individual well-being or quality of life, and, as such, it is useless for general regulatory purposes. Nevertheless, the recommendation will be observed with great interest by individuals and groups advocating reduced noise exposure from aviation. It is therefore unfortunate that the recommendation is based on a very imperfect and faulty set of data.
2. Systematic review of evidence 2.1 WHO dataset
Several groups of researchers were commissioned by WHO to compile results from recent surveys on health effects of noise. The report from the group on annoyance [2] was, according to the authors, based on a systematic review of studies of environmental noise and annoyance conducted from 2000 and onwards. The authors had developed a strict protocol for selection of studies. The inclusion criteria comprised inter alia:
• Participants should be members of the general population
• Participants should have at least 5 years residency near the airport
• Annoyance question and response format should follow (as close as possible) recommendation given by ICBEN and/or ISO TS 15666
The authors went through an extensive search in existing databases and came up with a
list of 15 aircraft noise annoyance studies that complied with their inclusion criteria. After an additional elimination process 12 studies were selected for the final meta analysis. The
rationale for excluding three studies from their initial list is unclear. One of these studies comprises surveys at two different airports, but Guski et al. [2] have only considered one of them for unknown reasons. It is interesting to note that results from previous similar
surveys at both of these airports which were excluded, were included in the analysis by Miedema & Vos [3] for their well-known EU reference curve. It is also interesting to note
that both of these airports represent below-average annoyance functions.
The final list of candidate studies on aircraft noise annoyance for their meta-analyses is shown in Table 1. They called the results from these 12 studies WHO full dataset. These
surveys were conducted during the period 2001 – 2011. The list comprises data from a total of 17,094 respondents.
The table contains information on the airports and their respective IATA codes for identification, reference to the publication of the survey results, total number of respondents per survey, calculated Community Tolerance Level [10], and a classification "rate of
change", H/L, (that will be explained later). Some of the CTL calculations are marked with an asterisk (*) indicating that this is not a standard CTL value.
Table 1: Studies included in the WHO full dataset
Year IATA Airport Reference Respondents CTL H/L
2003 AMS Amsterdam Babisch et al [4] 898 71.6 dB* H
2003 ATH Athens Babisch et al [4] 635 55.6 dB* H
2003 TXL Berlin, Tegel Babisch et al [4] 972 65.6 dB* L
2003 LHR Heathrow Babisch et al [4] 600 65.0 dB* L
2003 MXP Milan, Malpensa Babisch et al [4] 753 54.6 dB*
2003 ARN Stockholm Babisch et al [4] 1003 67.3 dB* H
2002 AMS Amsterdam Breugelmans et al [5] 5873 63.3 dB H
2008 SGN Ho Chi Minh Nguyen et al [7] 880 75.5 dB L
2009 HAN Hanoi Nguyen et al [7] 824 68.2 dB L
2011 DAD Da Nang Nguyen et al [8] 528 75.0 dB L
2005 FRA Frankfurt Schreckenberg [9] 2312 63.3 dB H
Guski et al. offered the following scatterplot and quadratic regression of the relationship between aircraft noise, Lden, and the prevalence of highly annoyed residents, %HA, Figure 1.
Figure 1. Scatterplot of the response data from the 12 studies included in the WHO full dataset. The
size of the markers corresponds to the number of respondents in the respective study.
The data points in Figure 1 do not represent aggregated empirical observations as is usual in such plots. They represent predicted values estimated from the regression equations for each of the studies. Different regression models have been used in the respective studies, and the regressions have been based on different exposure ranges. Finally, the results for the WHO full dataset have been found using a quadratic regression model and weighting according to study sample size.
The procedure of applying a regression model to data points derived from other (and different) regression models makes it almost impossible to assess the confidence interval for the final curve.
A procedure based on combining all responses from different surveys in this manner represents an outdated way of analysing data from aircraft noise annoyance surveys. It ignores the fact that only about one third of the variance in the response data is explained by the cumulative noise exposure [11] and it effectively prohibits any possibility of studying the influence of non-acoustical factors; an issue that has received an emerging and growing interest.
highly annoyed residents varies between about 5 % and 70 %. It is difficult to attribute this enormous spread to personal or situational attitudes towards the cumulative noise exposure only. A more plausible explanation would be that there must be other factors that also play an important role. This fact is not commented on and completely overlooked by the researchers responsible for the presentation of evidence for the WHO guidelines.
2.2 The HYENA study
The results from surveys at six airports from the HYENA study have been included in the WHO full dataset. These survey results have been reported by Babisch et al. [4], see Table 1. The HYENA study was primarily designed to study hypertension among residents near airports and included respondents aged 45 – 70 years only. Most surveys have respondents aged 18 years and up. This is for instance the case for the 20 studies that are included in the Miedema & Vos curve, and which has become a de facto EU standard reference curve for aircraft noise annoyance [3]. The annoyance response is age-dependent with a maximum sensitivity around 45 years as reported by Van Gerven et al. [12]. These authors found that for aircraft noise at Lden 55 dB the prevalence of highly annoyed persons
was about 25 % among people aged 20 years and significantly higher, 43 %, among people 45 years old. According to their analysis the difference in the annoyance response in a group of respondents evenly distributed across an age span 20 to 80 years compared to a similar group 40 to 70 years is about five percentage points.
Guski et al. are aware of this fact that most certainly have contributed to an increase of annoyance in the HYENA study, but still they choose to include the data in violation of their own selection criterium («member of the general population»). If the HYENA results follow the general trend, a certain bias towards higher annoyance must be expected. The HYENA results comprise 28 percent of the WHO full dataset.
Another selection criterium was that the annoyance question and the response format should follow the recommendations given by ICBEN [13] and/or ISO TS 15666 [14] or at least be very similar. These recommendations specify an annoyance question without mentioning any particular time-of-day. The HYENA study, however, had two separate questions on "annoyance due to aircraft noise during the day " and "…during the night". This fact has been commented upon by the authors, but they conclude that the response to the daytime period can be used in their analysis, again a violation of their own inclusion criterium. This decision may be disputed. The question used in the HYENA study can be interpreted in different ways, for instance:
• How annoyed are you in general by aircraft noise during the day?
• How annoyed are you during the day by aircraft noise during the day?
• How annoyed are you during the day by aircraft noise in general?
airport Bartels [15] observed a higher prevalence of highly annoyed residents than what could be predicted from the Miedema & Vos curve. She attributed this to the relative high portion of night time flights. It is highly questionable to combine the responses from the HYENA study (annoyance during the day) with those that strictly follow the ICBEN recommendations (general annoyance with no specified time period).
A visual inspection of the annoyance data from the HYENA study reveals that two airports, Athens (ATH) and Milan (MXP) have an exceptionally high prevalence of highly annoyed neighbours, see Figure 1. The field work for the Athens study was conducted in 2003, but this airport was not opened until March 2001. First, this fact is in violation with one of the selection criteria, «people who had lived for at least 5 years near the airport», and secondly, someone that has endured a noisy construction period of perhaps 3-4 years and then suddenly has been exposed to unfamiliar aircraft noise for two years, can not be considered a typical airport neighbour.
There are two major airports serving the city of Milan, Malpensa (MXP) and Linate (LIN). Two years prior to the survey at Malpensa, Linate airport experienced a tragic crash with 114 casualties. This triggered a lot of public discussion about air traffic safety. This may very well have influenced the response at Malpensa. High fear of accidents has been found to shift the annoyance response equivalent to as much as 20 dB in the exposure [16] [17]. Milan Malpensa can therefore hardly be considered representative for a typical European airport.
In a report on the results of the HYENA study the authors comment on the very high annoyance scoring of the Athens and Milan airports. They discuss several reasons for this and conclude that the data from these two airports is not representative for airports in general. They therefore exclude the data from their subsequent pooled analyses [4] (p.1175). Nevertheless, Guski et al. include both airports in the WHO full dataset.
2.3 Response weighting
Analysts often rely on statistical software to develop regression-based dose-response relationships without detailed concerns for the assumptions made by various regression techniques, and for their implications. A typical pitfall is weighting according to the number of respondents. This may make perfect sense when studying a one-dimensional problem. However, this is not the case when analyzing aircraft noise annoyance.
The annoyance response to aircraft noise is governed not only by the cumulative noise level but also by several other factors, both acoustical and non-acoustical [18]. According to Basner et al. [11]cumulative measures of noise exposure per se, expressed in units similar to Day-Night Average Sound Level (DNL), account for about on third of the variance in community-level data.
curves. If the task is to find an average dose-response curve for the two airports, one would intuitively assume that this curve would be located midway between the two initial ones. However, if a weighting corresponding to the number of respondents per survey is applied, the average response curve could be located anywhere between the two, and closest to the curve corresponding to the survey with the highest number of respondents. In other words, the result will be highly dependent on the study design (number of respondents per airport). A weighting of multi-dimensional responses according to the number of respondents is therefore not recommended.
Response weighting has been applied by Guski et al. for the WHO full dataset. Studies at Amsterdam airport comprise 6 771 respondents equal to about 40 percent of this dataset. Any specific non-dose factor that may be present at this airport will therefore have a prominent and disproportionate influence on the final exposure-response function.
2.4 High-rate and Low-rate airport change situation
Most airports experience an increase in traffic. This increase usually occurs gradually over many years. Other airports are characterized by large abrupt changes such as the opening of a new runway, introduction of new flight paths, an abrupt increase in number of aircraft movements, etc.
Janssen and Guski [19] call airports low-rate change airports if there is no indication of a sustained abrupt change of aircraft movements, or the published intention of the airport to change the number of movements within three years before and after the annoyance study. They offer the following definition: An abrupt change is defined here as a significant deviation in the trend of aircraft movements from the trend typical for the airport. If the typical trend is disrupted significantly and permanent, we call this a ‘high-rate change airport’. We also classify this airport in the latter category if there has been public discussion about operational plans within [three] years before and after the study. Low-rate change is the default characterization.
Gelderblom et al. [20]have applied this "high-rate/low-rate" classification to 62 aircraft noise annoyance studies conducted over the past half century. They show that there is a difference in the annoyance response between the two types amounting to about 9 dB. To express a certain degree of annoyance people at a high-rate change (HRC) airport on average "tolerate" 9 dB less noise than people at a low-rate change (LRC) airport. Guski et al. [2] report a similar but somewhat smaller, 6 dB, difference. Any attempt to develop an average dose-response curve from at set of studies will therefore be highly dependent on the types of airports that are included. A high percentage of HRC airports will increase the average prevalence of highly annoyed people.
This was a little more than four years prior to the survey. The above-mentioned tragic accident at Milan Linate only two years before the survey may also have contributed to a high annoyance response. We are inclined to categorize both Zurich and Malpensa as HRC. In 2009 the decision to expand the Hanoi Noi Bai Airport had already been made, and the public knew there would be an increase in traffic. The new terminal was opened in 2014 causing a 30 % increase in the traffic volume. In our opinion Hanoi Noi Bai is a "borderline HRC" airport.
If these three airports, ZHR, MXP and HAN, are also included in the HRC category, the WHO full dataset comprises 8 out of 12 HRC airports or about to 83 % of the respondents. In contrast, in the dataset presented by Gelderblom et al. 17 out of 62 airports or about 35 % of the respondents have been categorized as HRC, and in the original dataset used by Miedema and Vos for their dose-response curve [3] only 2 out of 20 airports or about 10 % of the respondents were categorized as HRC.
2.5 CTL analysis
The CTL method [10] provides an accurate and convenient way of comparing the results from different annoyance surveys. The CTL value is a single number quantity that characterizes the results of a single survey or a set of surveys. Each CTL value is associated with a complete dose-response curve.
The average CTL value for the 12 studies included in the WHO dataset is LCT 66.1 dB
with a standard deviation of ± 6 dB. It should be noted that this calculation is based on some non-standardized test results (The HYENA study). Figure 2 shows the average CTL curve and the dose-response function presented by Guski et al. [2]. In addition, the EU reference curve by Miedema and Vos [3] has been plotted for comparison. The CTL value corresponding to the EU reference curve is LCT 73.7 dB [20]. The figure indicates an
Figure 2. Dose-response curve for the WHO full dataset presented by Guski et al. compared
with the corresponding CTL curve and the EU reference curve (Miedema & Vos) for aircraft noise
annoyance
2.6 Alternative selection of surveys
A literature search for post-2000 aircraft noise annoyance surveys yields 18 surveys that adhere to the inclusion protocol defined by Guski et al. [2] and for which we have sufficient data to do a comparative analysis. Six of these were included in the WHO full dataset. There are also reports from other surveys, but their design deviate too much to be readily included. The list of surveys comprises 12 studies in Europe, 5 studies in Asia, and 1 in the US. These surveys are listed in Table 2.
Table 2. Aircraft noise annoyance surveys conducted 2000 - 2015
Year Airport Reference respond CTL H/L
2001 ZHR SWI-525 Brink et al. [6] 1520 68.0 H
2002 AMS GES-2 Breugelmans et al. [5] 640 63.2 H
2002 MSP Fidell et al [21] 495 72.6 L
2003 ZHR SWI-534 Brink et al. [6] 1444 69.0 H
2003 ANASE Le Masurier [22] 2132 63.0 L
2005 AMS GES-3 Breugelmans et al. [5] 478 63.3 H
2005 FRA Schreckenberg & Meis, [9] 2309 63.3 H
2008 SGN Nguyen et al. [7] 880 75.5 L
2009 HAN Nguyen et al. [7] 824 68.2 H
2010 CGN Bartels, [15] 1262 67.6 L
2011 DAD Nguyen et al. [8] 528 75.0 L
2014 BOO Gjestland et al. [23] 302 81.3 L
2014 TRD Gjestland et al. [23] 300 82.3 L
0 20 40 60 80
45 50 55 60 65 70 75 80
%
h
ighly
a
n
n
o
ye
d
Noise exposure, Lden [dB]
WHO full dataset
WHO
CTL
2014 HAN Nguyen et al. [24] 910 65.6 H
2015 OSL Gjestland et al. [23] 300 68.0 H
2015 SVG Gjestland et al. [23] 302 80.0 L
2015 TOS Gjestland et al. [23] 300 83.0 L
2015 HAN Nguyen et al. [24] 1121 63.0 H
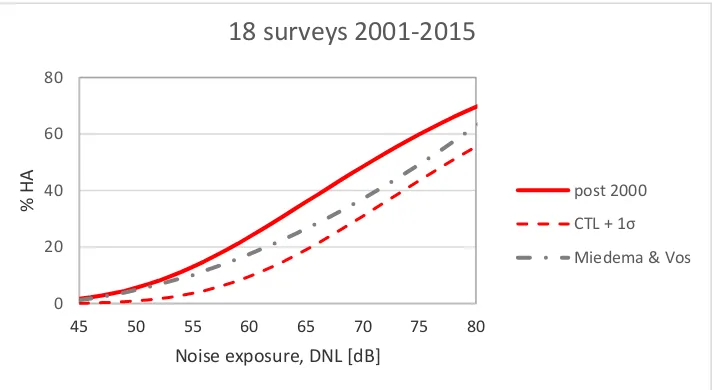
The selection of surveys comprises 16,047 individual participants. Half of the airports are categorized HRC airports and these comprise about 60 % of the respondents. The average unweighted CTL value for these surveys is LCT 70.7 ± 7 dB. The corresponding
dose-response curve is shown in Figure 3 together with the EU reference curve [3]. The average response lies above the reference curve, indicating a higher prevalence of annoyance. However, the difference between the two curves is less than 1 σ (one standard deviation). Their CTL values differ by only 3 dB, therefore one cannot conclude that they are significantly different.
Figure 3. Dose-response curve for 18 post-2000 surveys compared with the EU reference curve
(Miedema & Vos) for aircraft noise annoyance
3. Conclusions
The recommendations in the new WHO Guidelines for Environmental Noise [1] regarding aircraft noise annoyance are based on the results of a selection of noise surveys conducted after 2000. The selection has been made by a group of researchers commissioned by WHO.
This paper shows that the selection of surveys included in the WHO dataset has been made in violation of several of the selection criteria specified by the research group.
• The respondents in half of the surveys were not representative for the general population. The selection favoured special age groups that are known to be especially sensitive to aircraft noise.
0 20 40 60 80
45 50 55 60 65 70 75 80
%
H
A
Noise exposure, DNL [dB]
18 surveys 2001-2015
post 2000
CTL + 1σ
• Half of the selected studies did not follow the standard protocol for annoyance surveys recommended by ISO, but instead, questions that are likely to yield higher annoyance scores, were used.
• The required length of residency by the respondents was not met at one airport.
• Data from two airport surveys have been included despite the fact that these two datasets were considered non-representative and rejected for further pooled analyses by the researchers who conducted these surveys.
• Data from one specific airport comprises about 40 percent of the total dataset. This gives this specific airport a prominent and disproportionate influence on a selection that is supposed to be representative for airports world wide.
• The selected airports comprise 63 - 80 percent data from HRC airports (depending on definition). There is a significant difference between the prevalence of annoyance observed at so-called "high-rate" change airports as compared to the "low-rate" change ones. The percentage of HRC airports is much higher than is observed among airports in general.
An alternative selection of airport annoyance surveys conducted after 2000, and strictly following the original selection protocol, yields an average dose-response function which is shifted almost 5 dB compared to the one presented in the WHO guidelines. The results indicate that the respondents to these surveys on average "tolerate" 5 dB higher noise exposure than the WHO selection in order to express the same degree of annoyance.
The recommendations in the new WHO guidelines with respect to aircraft noise annoyance seem to be based on an arbitrary selection of surveys that have not been conducted according to internationally standardized methods and that do not adhere to pre-set selection criteria. In addition, the selection is not representative for airports in general. This study shows that a selection of different surveys based on an identical selection protocol, yields very different results.
The dataset provided by the WHO Systematic Review Team [2] should not have been accepted for publication in the WHO report, and thus caused misleading conclusions to be made by the WHO Guideline Development Group.
References
1. World Health Organization. Environmental noise guidelines for the European region. 2018, Copenhagen, Denmark: WHO Regional Office for Europe
2. Guski, R., Schreckenberg, D., & Schuemer, R. WHO Environmental Noise Guidelines for the European Region. A systematic review on environmental noise and annoyance. Int J of Environmental Research and Public Health, 2017, doi:10.3390/ijerph14121539
3. Miedema, H. M., & Vos, H. Exposure-response relationships for transportation noise. J Acoust Soc Am, 1998, 3432-3445.
5. Breugelmans, Wiechen, v., Kamp, v., Heisterkamp, & Houthuijs. Tussenrapportage Monitoring Gezondheitskundige Evaluatie Schiphol. Amsterdam, Netherlands: Rijksinstituut voor Volksgezondheit en Milieu, report 630100 001, 2005.
6. Brink, M., Wirth, K. E., Schierz, C., Thomann, G., & Bauer, G. Annoyance response to stable and changing aircraft noise exposure. J Acoust Soc Am, 2011,130(2), 791-806.
7. Nguyen, T L, Nguyen, H Q, Yano, T, Nishimura, T, Sato, T, Morihara, T, Hasimoto, Y. Comparison of models to predict annoyance from combined noise in Ho Chi Minh City and Hanoi. Applied Acoustics, 2012, 952-959.
8. Nguyen, T L, Yano, T, Nguyen, H Q, Nguyen, K T T, Fukushima, H, Kawai, K. Aircraft and road traffic noise annoyance in Da Nang City, Vietnam. Internoise 2012. New York: I-INCE.
9. Schreckenberg, D., & Meis, M. Noise annoyance around an international airport planned to be extended. Internoise 2007. Istanbul, Turkey: I-INCE.
10. ISO. ISO 1996-1. Acoustics - Description, measurement and assesment of environmental noise - part 1: Basic quantities and assessment procedures. 2016, International Standardization Organization.
11. Basner, M., Clark, C., Hansell, A., Hileman, J. I., Janssen, S., Shepherd, K., & Sparrow, V. Aviation noise impacts: State of the Science. Noise & Health, 2017, 19: 41-50
12. Van Gerven, P., Vos, H., Van Boxtel, M., Janssen, S., & Miedema, H. Annoyance from environmental noise across the lifespan. J Acoust Soc Am, 2009, 187-194.
13. Fields; Jong, de; Gjestland; Flindell; Job; Kurra; Lercher; Yano; Guski; Felscher-Suhr. Standardized noise-reaction questions for community noise surveys: research and a recommendation. J Sound Vib, 2001, 641-679
14. ISO. TS 15666: Acoustics - Assessment of noise annoyance by means of social and socio-acoustic surveys. 2003, International Standardization Organization.
15. Bartels, S. Aircraft noise-induced annoyance in the vicinity of Cologne/Bonn Airport. Darmstadt, Germany: Technical University Darmstadt, 2014
16. Fields, J. M. (1993). Effect of personal and situational variables on noise annoyance in residential areas. J Acoust Soc Am, 93, 2753-63, 1993
17. Miedema, H., & Vos, H. Demographic and attitudinal factors that modify annoyance from transportation noise. J Acoust Soc Am, 105, 3336-44, 1999
18. Job, R. F. Community response to noise: A review of factors influencing the relationship between noise exposure and reaction. J Acoust Soc Am, 991-1001, 1988
19. Janssen, S., & Guski, R. Chapter 7: Aircraft noise annoyance. In Evidence Review on Aircraft Noise and Health. S. A. Stansfeld, Eds, DG-JRC and DG-Env, European Union, Brussels, Belgium, 2017, (in press)
20. Gelderblom, F. B., Gjestland, T., Fidell, S., & Berry, B. On the stability of community tolerance for aircraft noise. Acta Acustica united with Acustica, 17-27, 2017
21. Fidell, Pearsons, Silvati, & Sneddon, Relationship between low-frequency aircraft noise and annoyance due to rattle and vibration. J Acoust Soc Am, 1743-1750, 2002
22. Le Masurier, B. T. (2007). Attitudes to noise from aviation sources in England (ANASE). Her Majesty's Stationary Office Report C34351, 2007
23. Gjestland, T., Gelderblom, F. B., & Granøien, I. L. Noise surveys at five Norwegian airports. Internoise
2016. Hamburg, Germany; I-INCE