Licensed under Creative Common Page 660
http://ijecm.co.uk/
THE ORGANIZATIONAL PERFORMANCE: THE EFFECT OF
VARIABLES CONTINGENCY AND PERFORMANCE MEASUREMENT
Muh Rays
Accounting Doctoral Program, Trisakti University, Indonesia ddn_ramdhani@yahoo.com
Yvonne Agustine
Lecture of Accounting Doctoral Program, Trisakti University, Indonesia
Abstract
This research aims to examine the relationship of competitive strategy, environmental
uncertainty, growth strategies, performance measurement system and strategic performance.
Scope of this study includes manufacturing firms in Banten Province, Indonesia. This study is an
empirical study with purposive sampling techniques in data collection. Data obtained by
questionnaire which was distributed to middle managers in manufacturing companies in the
province of Banten, the questionnaire return rate of 70% of 70 respondents. Data analysis was
performed with a Structural Equation Model (SEM) with a program Smart PLS (Partial Least
Square). The result shows that the hypothesis of the four hypothesis proposed by three
hypotheses are accepted. Accepted hypothesis is the Hypothesis 1a (there is a significant
positive relationship between competitive strategies of growth strategy), hypothesis 2 (there is a
significant positive relationship between the growth strategies of the performance measurement
system), and hypothesis 3 (there is a significant positive relationship between performance
measurement system to strategic performance). Hypothesis is rejected and hypothesis 1b
(there is not significant positive relationship between environmental uncertainty on growth
strategy).
Keywords: The Variable Contingency, Performance measurement system, Organizational
Licensed under Creative Common Page 661
INTRODUCTION
Manufacturing company in Indonesia in the era of globalization should strive to produce high quality goods at low cost in order to improve competitiveness in both the domestic and global markets thus increasing profits. To achieve the objectives of the company, the company should be able to predict the state, formulate strategies for the right company that has a strategic competitiveness (strategic competitiveness). One grand strategy that can be used is the growth strategy (growth strategy). Growth does not only prepare the ground in order to increase profits in the future, but will imply a new life into a company. The developments of manufacturing industries face barriers, such as the uncertainty of the environment. The uncertainty of the environment is high is defined as a sense of the individual's inability to predict accurately the environment (Miliken, 1987)
The phenomenon can be observed in the development of manufacturing enterprises that can be seen from the results of statistical data in Banten that the manufacturing industry is the biggest contribution of the nine sectors of the economy (BPS Banten), it can be expected of the manager is able to improve the performance of the company (Lane & Pollner, 2008).
This study aims to contribute in the field of management accounting examines the extent of competitive within the company relates to its growth strategy, and the relationship between the uncertainty with its growth strategy and relationship growth strategy performance measurement system and how performance measurement systems are associated with the performance of the company (Damon M. Fleming, Chee W. Chow and Chen Gongmeng 2009). This study draws on research Damon M. Fleming, Chee W. Chow and Chen Gongmeng, (2009) in their study one variable using secondary data strategic performance, but in this study the performance of a strategic variable using primary data.
The difference of this study with previous research is the object of research and testing different tools, as well as all of their data using primary data. So the title of this research is "strategy, system performance measurement and strategic performance".
LITERATURE REVIEW
The strategy focuses on how companies compete and position themselves in relation to its competitors (Fuchs, Mifflin, Miller, & Whitney, 2000; Langfield-Smith, 1997). So that their responsive to competition and the uncertainty of the environment (Damon M. Fleming, Chee W. Chow and Chen Gongmeng 2009).
Licensed under Creative Common Page 662 So that the performance measurement system can play a key role in the implementation of the strategy by monitoring organizations to explain the strategy into the desired behavior, and be able to communicate well, to monitor progress, provide feedback and motivate employees through performance-based awards (Banker, Potter, & Srinivasan, 2000; Chenhall, 2003; Chenhall & Langfield - Smith, 1998; Ittner, Larcker, & Randall, 2003; Kaplan and Norton, 2001). Performance strategy emphasizes the importance of the use of performance measures that are consistent with the priorities in the company's competitive strategy (Chow and Chen 2006. Langfield -Smith 2007). There are previous studies (Burns & Stalker, 1961; Porter, 1980) that strategy is the interaction with the environment. It is also in charge that the strategy is a response to the environment, so they can increase the performance of the company.
Hoque and James (2000), found a positive association between increased in the use of performance measurement system (CMS) that integrates with the company's performance.
From the explanation of the theories above and based on previous studies, the framework of this study is as follows:
Figure 1 Conceptual Framework
Source: Damon M. Fleming, W.Chow and Gongmeng Chee Chen (2009)
The Underlying Theory
Strategy Competitive companies must in accordance with the state of the environment (Child, 1997). The strategy focuses on how companies compete and be able to position themselves in relation to the competition (Fuchs, Mifflin, Miller, & Whitney, 2000; Langfield-Smith, 1997).
Uncertainty is a threat to the environment because of the uncertainty of strategic management could hinder the organization's ability to develop long-term plans and to make strategic decisions to keep the company balanced with the external environment (David and Thomas, 2003).
According Suwarsono (1996), the growth strategy is the competitive strategy which seeks to develop the company in accordance with the size of the amount agreed upon to
Competitive strategy
Environmental
uncertainty
Growth
strategy
Performance
measurement
system
Licensed under Creative Common Page 663 achieve the company's long-term objectives, such as managed to increase sales volumes, the size of the market share held and the profits obtained.
Performance measurement system also provides information relevant to decision making. Relevant information derived from performance measurement tools that cover all aspects of financial and non-financial. The unification of the measuring instrument which includes the value chain of an organization is believed to help managers to understand cross-functional relationships that lead to problem solving and decision making better and right (Banker et al, 2002). In this way the performance measurement system can guide the decision-making process and help evaluate decisions in the past (Malina and selto, 2001).
According Moeherlono (2009), the performance is an overview of the level of achievement of the implementation of a program of activities or policies in realizing the goals, objectives, vision and mission of the organization that poured through the strategic planning of an organization.
According to William and Lawarence, the strategy is a plan that is united, comprehensive and integrated, which connects the advantages of corporate strategy with environmental challenges and are designed to ensure that the company's main objectives can be achieved through proper execution by the organization.
According to Daft (1983) strategic performance in the company that is trying to make its resources in order to encourage innovation and create value to improve performance. Performance-based strategies are considered when practitioners made a strategic decision to try to 'understand and implement strategies that improve the efficiency and effectiveness''.
RESEARCH METHODOLOGY
Research Procedure
In this study, the data used is Primary data. The primary data used in this study was obtained directly from surveys conducted; the survey was conducted by dividing the questionnaire on middle managers in the manufacturing industry in the province of Banten.
In this study attempted to obtain data and information reasonably sufficient in accordance with the existing problems.
Population and Sampling Design
Licensed under Creative Common Page 664 According Sugiyono (2009: 116) sample is part of the number and characteristics possessed by this population. When large populations, and researchers may not learn all that there is in the population, for example, because of limited funds, manpower and time, then the researcher can use the sample drawn from that population. What is learned from the sample, the conclusion will be applied to the population. For that samples taken from the population should be rigorously representative (representing). The sample size for this study is 70 respondents. Sampling criteria proposed in this study are as follows:
1. Middle manager at a manufacturing company in Banten Province registered Disperindag Banten Province.
2. Middle Manager who has responsibility for planning, monitoring and decision makers. 3. Middle Manager lowest educated Bachelor
Descriptive statistics
Descriptive statistical analysis used in this study is intended to provide an overview of the demographics of the respondents which include gender, education last, position and tenure disclosed to clarify the description of the respondents.
Validity and Reliablity
Test the quality of the data in this research include tests of reliability and validity test. Test the validity aims to look at the accuracy of the measuring instrument in research. This test is to determine the accuracy of an instrument of research in order to provide accurate information about the measure.
Validity test is done by comparing the square root of average variance extracted (AVE) of each construct with the correlation between the constructs with other constructs in the model. If the value of the square root of the AVE of each construct is greater than the value of the correlation between the constructs more in the model then each indicator statement is valid Ghozali (2006: 25). The results of reliability testing are shown in an index that describes how far a measuring instrument can be trusted. Reliability test is intended to measure the internal consistency of a questionnaire which is an indicator of variables or constructs. Measuring reliability tests conducted by test Ghozali Composite reliability ≥ 0.70 (2006: 43)
Hypothesis Testing Tools
Licensed under Creative Common Page 665 take all the interdependence relationships into account simultaneously within a single model estimation procedure (Chin, 1998) In the analysis using PLS there are 2 things to do are:
1. Assessing Outer Model or the Measurement Model
Convergent validity of the measurement model with a reflexive indicators were assessed based on the correlation between the component score is calculated with the PLS. The size of individual reflexive said to be high if more than 0.70 correlated with the construct being measured. However, according to Chin (1998) in Ghozali (2006: 24) to study the early stages of development measurement scale loading value of 0.5 to 0.6 is considered adequate
2. Assessing Inner Model or Structural Model
Testing inner structural model or models made to look at the relationship between constructs, significance and R-square value of the research model. A structural model been evaluated by using R-square for dependent constructs, Stone-Geisser Q-square test for predictive relevance and significance of the t test and the coefficient parameter Ghozali structural lines (2006: 26). In assessing the model with PLS begins to see R-square for every dependent latent variables. Changes in the value of R-square can be used to assess the effect of certain independent latent variables on the dependent latent variables influence whether substantive. The influence of the amount can be calculated with the following formula:
Source: Ghozali, (2006)
Wherein R 2 and R 2 included excluded is an R-square of the dependent variable when the predictor variable latent used or issued in the structural equation.
ANALYSIS AND FINDINGS Demographic Profile
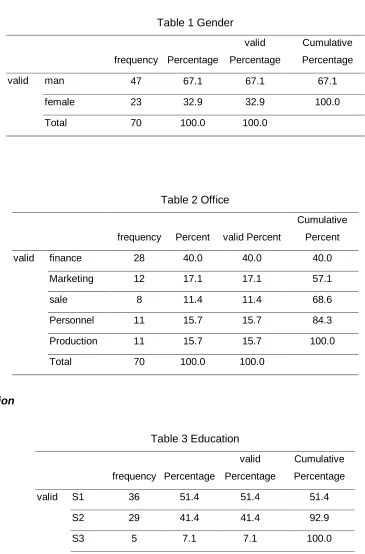
From the SPSS software version 16.0 results; of 70 respondents; 47 people (67.1%) were male and 23 people (32.9%) were female. Position held by respondents, 28 people (40%) from financial manager, 11 people (15,7%) from production manager, 12 people (17,1%) from marketing manager, 8 people (11,4%) from sales manager and 11 persons (15,7%) from personnel manager. The respondents who have been graduated from undergraduate programs are 36 people (51.4%), master programs are 29 people (41.4%), and doctoral programs are 5 people (7.1%). The respondents by the length period of working divided by 36 people (51,4%)
R2 included - R2 excluded
Licensed under Creative Common Page 666 for 1-5 years, 25 people (35,7%) for 6-10 years, and 9 people (12,9%) for 10 years. The following tables are presented depicting descriptive statistics respondents.
Gender
Table 1 Gender
frequency Percentage
valid Percentage
Cumulative Percentage
valid man 47 67.1 67.1 67.1
female 23 32.9 32.9 100.0
Total 70 100.0 100.0
Office
Table 2 Office
frequency Percent valid Percent
Cumulative Percent
valid finance 28 40.0 40.0 40.0
Marketing 12 17.1 17.1 57.1
sale 8 11.4 11.4 68.6
Personnel 11 15.7 15.7 84.3
Production 11 15.7 15.7 100.0
Total 70 100.0 100.0
Education
Table 3 Education
frequency Percentage
valid Percentage
Cumulative Percentage
valid S1 36 51.4 51.4 51.4
S2 29 41.4 41.4 92.9
S3 5 7.1 7.1 100.0
Licensed under Creative Common Page 667
Length Period of working
Table 4 Respondents Work Period
frequency Percentage
valid Percentage
Cumulative Percentage
valid 1 to 5 years 36 51.4 51.4 51.4
6 to 10 years 25 35.7 35.7 87.1
over 10 years 9 12.9 12.9 100.0
Total 70 100.0 100.0
Validity test
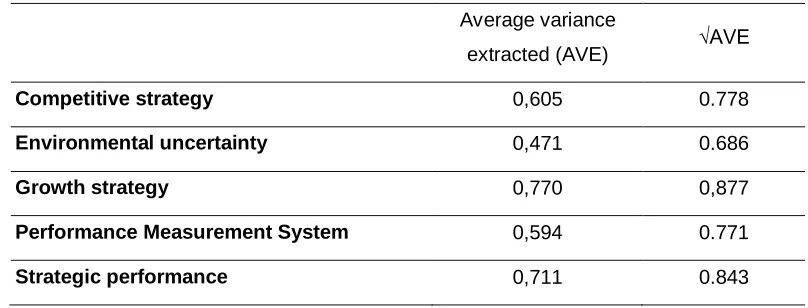
Testing the validity of the data in this research used software PLS with Outer Model is Convergent validity seen the value of the square root of average variance extracted (AVE) by Chin in Ghozali (2006; 24) of each construct where the value must be greater than 0, 5. Another way is by comparing the value of the square root of average variance extracted (AVE) of each constructs (latent variables) with a correlation between the construct with other constructs in the model.
If the value of the square root of AVE of each construct is greater than the value of the correlation between the construct with other constructs in the model, then it is said to have good grades discriminant validity (Ghozali, 2006; 24).
Table 5 Average Variance Extracted (AVE) Average variance
extracted (AVE) √AVE
Competitive strategy 0,605 0.778
Environmental uncertainty 0,471 0.686
Growth strategy 0,770 0,877
Performance Measurement System 0,594 0.771
Strategic performance 0,711 0.843
Licensed under Creative Common Page 668 Table 6 Correlations of Latent Variables
SK KL SP SPK KS
Competitive strategy (SK) 1,000
Uncertainty Environment (KL) 0,860 1,000
Strategy Growth (SP) 0,895 0,809 1,000
Performance Measurement System (SPK) 0,911 0,841 0,723 1,000
Strategic Performance (KS) 0,906 0,898 0,810 0,902 1,000
Table 5 explains the value of AVE and AVE root of the construct of competitive strategy, uncertainty environment, growth strategies, performance measurement and strategic performance. It can be seen that each constructs (variables) have a value above 0.5 AVE. Th is suggests that each construct, has a good validity of every indicator or the questionnaire used to determine the relationship of competitive strategy against the growth strategy, the uncertainty of the environment on the growth strategy, the growth strategy of the performance measurement system and performance measurement to performance strategies are valid ,
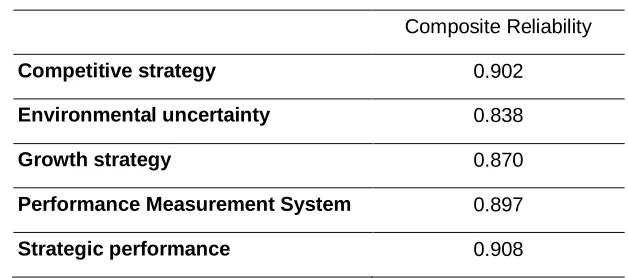
ReliabilityTest
In a reliability test, the authors used the Composite software PLS with Reliability. Chin in Ghozali (2006; 24), a data is said to be reliable if composite reliability is more than 0.7.
Table 7 Composite Reliability
Composite Reliability
Competitive strategy 0.902
Environmental uncertainty 0.838
Growth strategy 0.870
Performance Measurement System 0.897
Strategic performance 0.908
From table 7 it can be seen every constructs or latent variables that have a composite value reliability above 0.7 indicating that the internal consistency of between variables have good reliability.
Licensed under Creative Common Page 669
Hypothesis testing through the Outer Model
Convergent validity of the measurement model with a reflexive indicators were assessed based on the correlation between the component score is estimated by PLS software. The size of individual reflexive said to be high if more than 0.7 correlates with constructs (latent variables) were measured. But according to Chin in Ghozali (2006; 24), to study the early stages of development, the scale of measurement loading value of 0.5 to 0.6 is considered adequate.
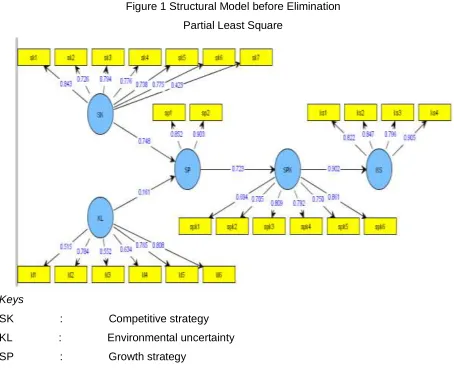
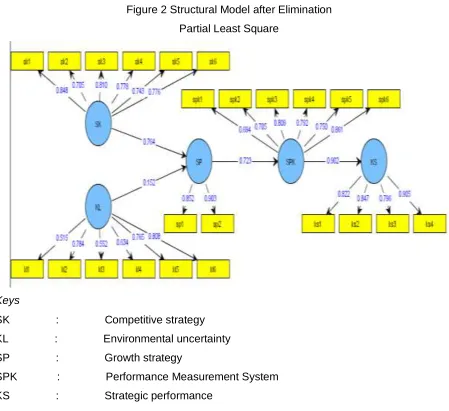
The following can be seen as a whole correlation to each of the variables in Figure 1 which is a drawing representing the relationship between the competitive strategy of the growth strategy, the uncertainty of the environment on the growth strategy, the growth strategy of the performance measurement system and performance measurement to Strategic performance. Where the model in Figure 1 carried elimination it is because there is a correlation constructs that are less than 0.5 so that one of the indicators of a competitive strategy should be eliminated. For the model in Figure 3 .2 no longer do this elimination as there is no correlation constructs less than 0.5 so that each of the variables meet the criteria of convergent validity.
Figure 1 Structural Model before Elimination Partial Least Square
Keys
Licensed under Creative Common Page 670 SPK : Performance Measurement System
KS : Strategic performance
Figure 1 correlation constructs that are less than 0.5 so that one of the indicators of a competitive strategy should be eliminated, then the result of the elimination contained in figure 2.
Figure 2 Structural Model after Elimination Partial Least Square
Keys
SK : Competitive strategy KL : Environmental uncertainty SP : Growth strategy
SPK : Performance Measurement System KS : Strategic performance
Outer Variable Model Competitive Strategy (SK)
Licensed under Creative Common Page 671 constructs. Indicators are considered reliable if it has a correlation value above 0.7. However, during the development phase correlation of 0.5 would be acceptable Ghozali (2006: 24).
Outer Model Uncertainty Environment Variables
Variable environmental uncertainties are described by six indicators comprising KL1 question until KL6. Test against the outer loading aims to see the correlation between the scores of items or indicators with a score constructs. Indicators are considered reliable if it has a correlation value above 0.7. However, during the development phase correlation of 0.5 would be acceptable Ghozali (2006: 24).
Outer Model Variable Growth Strategy
Variable growth strategies described are described by two indicators comprising SP1 question until SP2. Test against the outer loading aims to see the correlation between the scores of items or indicators with a score constructs. Indicators are considered reliable if it has a correlation value above 0.7. However, during the development phase correlation of 0.5 would be acceptable Ghozali (2006: 24).
Outer Variable Model Performance Measurement System
Variable performance measurement system is described by six indicators comprising SPK1 question until SPK6. Test against the outer loading aims to see the correlation between the scores of items or indicators with a score constructs. Indicators are considered reliable if it has a correlation value above 0.7. However, during the development phase correlation of 0.5 would be acceptable Ghozali (2006: 24).
Outer Variable Model Performance Strategic
Variable strategic performance is explained by the four indicators of questions consisting of KS1 through to KS4. Test against the outer loading aims to see the correlation between the scores of items or indicators with a score constructs. Indicators are considered reliable if it has a correlation value above 0.7. However, during the development phase correlation of 0.5 would be acceptable Ghozali (2006: 24).
Hypothesis testing through Inner Model
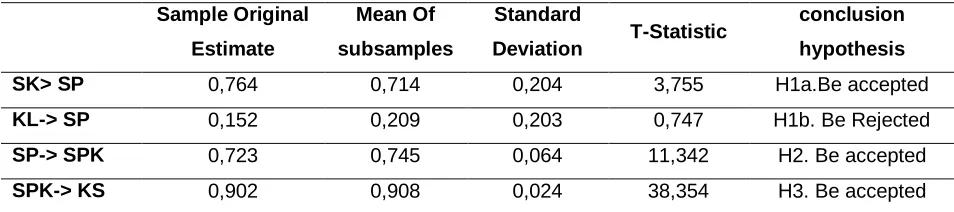
Licensed under Creative Common Page 672 Table 8 Results for inner weights
Sample Original
Estimate
Mean Of
subsamples
Standard
Deviation T-Statistic
conclusion
hypothesis
SK> SP 0,764 0,714 0,204 3,755 H1a.Be accepted
KL-> SP 0,152 0,209 0,203 0,747 H1b. Be Rejected
SP-> SPK 0,723 0,745 0,064 11,342 H2. Be accepted
SPK-> KS 0,902 0,908 0,024 38,354 H3. Be accepted
In assessing the structural PLS model can be viewed based on the value of R-Square for each latent variable. The value of R-Square on our data processing is as follows:
Table 9 R-Square
Competitive strategy
Environmental uncertainty
Growth strategy 0,807
Performance Measurement System 0,523
Strategic performance 0,813
The above table shows the R-square value constructs growth strategy for 0,807, constructs a performance measurement system for 0,523 and 0,813 amounted to construct strategic performance. The higher the R-square, the greater the independent variables can explain the dependent variable so that the better the structural equation. For variable growth strategy has the R-square value of 0,807 which means 80.70% variance competitive strategy and environmental uncertainty is explained by the variable growth strategy while the rest is explained by other variables, such as management structure (Nelson and Somers, 2001), business process reengineering (Kuang et al, 2001) and other variables outside variables studied in this research (Ghozali, 2006).
Licensed under Creative Common Page 673 While the strategic performance variable has a value of R-square of 0,813 which means 81.30% variance competitive strategy and environmental uncertainty is explained by the variable growth strategy while the rest is explained by other variables, such as top management support (Trimble, 2000 in Winahyu 2005), external expertise (Nelson and Somers, 2001) and other variables outside variables studied in this research (Ghozali, 2006).
Hypothesis Testing and Discussion
Hypothesis 1 a
Table 10 Testing and Discussion of Hypothesis 1 a
Sample Original
Estimate
Mean Of
subsamples
Standard
Deviation T-Statistic
SK> SP 0,764 0,714 0,204 3,755
Based on the data obtained and then processed by the authors are presented in table 10 competitive strategies have a significant positive relationship indicated by the value of the original sample estimate for 0,764 and the value of t-count equal to 3,755 bigger than t-table (1.96). Thus it can be said that H1 is a competitive strategy has a significant positive correlation with variable growth strategy is acceptable.
The results of this study confirm previous research conducted by Damon M. Fleming, Chee W. Chow and Gongmeng Chen (2009) which states that competitive strategy has a significant positive correlation to growth strategies.
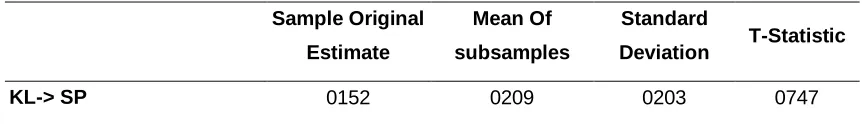
Hypothesis1b
Table 11 Testing and Discussion of Hypothesis 1 b
Sample Original
Estimate
Mean Of
subsamples
Standard
Deviation T-Statistic
KL-> SP 0152 0209 0203 0747
Licensed under Creative Common Page 674 uncertainty has a positive effect, namely 0.152 and no significant variable growth strategy is acceptable. Environmental uncertainty has a positive relationship in the low category of less than 0.5 is 0.152 and not significant, which is smaller than the t-test, namely 0.747.
The results of this study do not confirm an earlier study conducted by Damon M. Fleming, Chee W. Chow and Gongmeng Chen (2009). However, this finding is supported by research Chong and Chong (1997) also found a positive relationship between environmental uncertainty and the tendency of companies to pursue growth-oriented strategy.
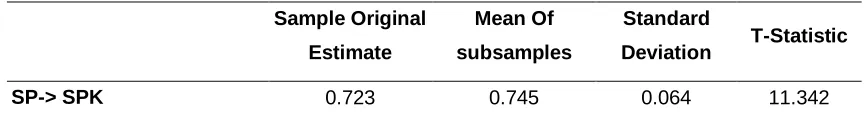
Hypothesis2
Table 12 Testing and Discussion of Hypothesis 2
Sample Original
Estimate
Mean Of
subsamples
Standard
Deviation T-Statistic
SP-> SPK 0.723 0.745 0.064 11.342
Based on the data obtained and then processed by the authors are presented in table 12 growth strategy has shown significant positive relationship with the original value of the sample estimate for 0.723 and the value of 11.342 t count bigger than t-table (1.96). Thus it can be said that the H2 is a growth strategy has a significant positive correlation with the variable performance measurement system is acceptable.
The results of this study confirm previous research conducted by Damon M. Fleming, Chee W. Chow and Gongmeng Chen (2009) which states that the growth strategy has a significant positive correlation to the performance measurement system.
Hypothesis3
Table 13 Testing and Discussion of Hypothesis 3
Sample Original
Estimate
Mean Of
subsamples
Standard
Deviation T-Statistic
SPK-> KS 0902 0908 0024 38 354
Licensed under Creative Common Page 675 (1.96). Thus it can be said that the H3 is a performance measurement system has a significant positive correlation with variable strategic performance is acceptable.
The results of this study confirm previous research conducted by Damon M. Fleming, Chee W. Chow and Gongmeng Chen (2009) which states that the performance measurement system has a significant positive relationship to strategic performance.
CONCLUSION
Based on the empirical findings on Strategy, Performance Measurement System Performance and Strategy, following conclusions are drawn:
1. Based on the statistical analysis, it can be concluded that there is a significant positive relationship between competitive strategies against the growth strategy. The results of this study confirmed previous research conducted by Damon M. Fleming, Chee W. Chow and Gongmeng Chen (2009). And supported by Oliver (1991) who states Strategy shows that the competitive conditions of the company stressed that adopting the orientation of growth to exploit critical resources and achieve a competitive advantage and is supported by other researchers such as Baines and Langfield-Smith (2003), Child (1997) and Fuchs, Mifflin, Miller, & Whitney (2000), Langfield-Smith (1997).
2. Based on the statistical analysis, it can be concluded that there are no significant positive relationship between environmental uncertainties on growth strategies. The results of this study do not confirm the previous study conducted by Damon M. Fleming, Chee W. Chow and Gongmeng Chen (2009). However, this invention is supported by Chong (1997) and he also found a positive relationship between environmental uncertainty and the tendency of companies to pursue growth-oriented strategy. Head (2005) showed the same results and explains that the environmental uncertainty makes it difficult for managers to predict the future; the company has found a positive relationship between environmental uncertainty and the company's emphasis on growth.
Licensed under Creative Common Page 676 4. Based on the statistical analysis, it can be concluded that there is a positive relationship between the significant performance measurement systems to strategic performance. The results of this study confirm previous research conducted by Damon M. Fleming, Chee W. Chow and Gongmeng Chen (2009).
SUGGESTIONS FURTHER STUDIES
1. To avoid the least respondents expected the further study took samples from a variety of other business entities outside the manufacturing sector such as the services sector, trade and state enterprises.
2. In a subsequent study, is expected to add the variable of how cultural differences affect the strategic and operational managers response to environmental forces and how managers react to the choices that have been made (Damon M. Fleming, Chee W. Chow and Chen Gongmeng, 2009)
REFERENCES
Aulia Rizka. 2010. Reaksi Pasar Terhadap Pengukuran Kinerja Akuntansi Perusahaan Prospector Dan Defender: Analisis Dengan Pendekatan Life Cycle Theory. Skripsi Akuntansi. Universitas Diponegoro.
Baines, A., & Langfield-Smith, K. (2003). Antecedents to management accounting change: a structural equation approach. Accounting, Organizations and Society, 28, 675−698.
Berita resmi statistik. No: 34 /08/36/Th. V, 1 Agustus 2011. BPS Provinsi Banten.
Chenhall, R. H. (2003). Management control systems design within its organizational context: findings from contingency-based research and directions for the future. Accounting, Organizations and Society, 28, 127−168. Chenhall, R. H. (2007). Theorizing contingencies in management control systems research. In C. S. Chapman, A. G. Hopwood, & M. D. Shields (Eds.), Handbook of Management Accounting Research, Vol. 1. (pp. 163−206) Oxford, UK: Elsevier.
Chenhall, R. H., & Langfield-Smith, K. (1998). The relationship between strategic priorities, management techniques and management accounting: an empirical investigation using a systems approach. Accounting, Organizations and Society, 23, 243−264.
Chong, V. K., & Chong, K. M. (1997). Strategic choices, environmental uncertainty and SBU performance: a note on the intervening role of management accounting systems. Accounting and Business Research, 27, 268−276.
David, Fred. R. 2006. Management Strategic Edisi 10. Salemba Empat. Jakarta.
David, J. Hunger, & Thomas L. Wheelen. 2003. Manajemen Strategis Edisi 2. Penerbit ANDI. Yogyakarta.
Duh, R. R., Chow, C. W., & Chen, H. (2006). Strategy, IT applications for planning and control, and firm performance: the impact of impediments to IT implementation. Information and Management, 43, 939−949.
Faisal. 2006. Analisis pengaruh intensitas persaingan dan variabel kontekstual terhadap penggunaan informasi sistem akuntansi manajemen dan kinerja unit bisnis dengan pendekatan partial least square. SNA IX. Agustus. Fleming, M. Damon. Chee W. Chow, & Gongmeng Chen. (2009). Strategy, performance measurement systems, and performance: A study of Chinese firms. The International Journal of Accounting 44 256–278.
Ghozali, Imam. 2008. Structural Equation Modelling: Metode Alternatif dengan Partial Least Square (PLS) Edisi 2. Badan Penerbit – UNDIP. Semarang.
Licensed under Creative Common Page 677 Gupta, A. K., & Govindarajan, V. (1984). Business unit strategy, managerial characteristics, and business unit effectiveness at strategy implementation. Academy of Management Journal, 27, 25−41.
Head, T. C. (2005). Structural changes in turbulent environments: a study of small and mid-size Chinese organizations. Journal of Leadership and Organizational Studies, 12(2), 82−93.
Ittner, C. D., Larcker, D. F., & Randall, T. (2003). Performance implications of strategic performance measures in financial services firms. Accounting, Organizations and Society, 28, 715−741.
Kaplan, R. S., & Norton, D. P. (2001). The Strategy-focused Organization: How Balanced Scorecard Companies Thrive in the New Business Environment. Boston, MA: Harvard Business School Press.
Lane, K., & Pollner, F. (2008). How to address China's talent shortage. The McKinsey Quarterly, 2008(3), 32−40. Langfield-Smith, K. (1997). Management control systems and strategy: a critical review. Accounting, Organizations and Society, 22, 207−232.
Langfield-Smith, K. (2007). A review of quantitative research in management control systems and strategy. In C. S.Chapman, A. G. Hopwood, & M. D. Shields (Eds.), Handbook of Management Accounting Research, Vol. 1.(pp. 753−784) Oxford, UK: Elsevier.
Miller, D. (1988). Relating porter's business strategies to environment and structure: analysis and performance implications. Academy of Management Journal, 31(2), 280−308.
Moeherlono. 2009. Pengukuran Kinerja Berbasis Kompetisi. GHALIA Indonesia. Bogor.
Mulyadi dan Johny Setiawan. 2001. Sistem Perencanaan & Pengendalian Manajemen Edisi 2. Salemba Empat. Jakarta.
Nur Indrianto, dan Bambang Supomo, 2002. Metodologi Penelitian Bisnis, Edisi ke-1. Yogyakarta: BPFE.
Perera, S., Harrison,G.,&Poole,M. (1997). Customer-focusedmanufacturing strategy and the use of operations-based non-financial performance measures: a research note. Accounting, Organizations and Society, 22, 557−572.
Rahman Syaiful, Muhammad Nasir dan Rr Sri Handayani. 2007. Pengaruh Sistem Pengukuran Kinerja Terhadap Kejelasan Peran, Pemberdayaan Psikologis DanKinerja Manajerial (Pendekatan Partial Least Square) Penelitian Terhadap Manajer Perusahaan Manufaktur Di Jawa Tengah. SNA X. Juli.
Riyani Ani. 2008. Pengaruh ketidakpastian lingkungan terhadap Kinerja manajerial dengan karakteristik Sistem informasi akuntansi manajemen sebagai Variabel intervening. Skripsi Akuntansi. Universitas Muhammadiyah Surakarta.
Schulz, Axel K-D, C. W, Chow, & Anne Wu. (2007). Environmental Uncertainty, Comprehensive Performance Measurement Systems, Performance-Based Compensation, and Organizational Performance. SSRN.
Sugiyono. 2009. Metode Penelitian Bisnis. IKAPI-ALFABETA. Bandung.
Suwarsono. 1996. Manajemen Strategik Edisi Revisi. UPP-AMP YKPN. Yogyakarta.
Utama Wandra. 2009. Pengaruh adaptabilitas lingkungan Dan orientasi kewirausahaan Terhadap kualitas aliansi untuk Meningkatkan keunggulan bersaing. Tesis Magister Manajemen. Universitas Diponegoro.