United Kingdom ISSN 2348 0386 Vol. VII, Issue 12, December 2019
Licensed under Creative Common Page 265
http://ijecm.co.uk/
EFFECTS OF MONETARY POLICY ON
INTEREST RATE SPREAD IN KENYA
Karimi Joan Nyaguthii
Master of Economics (Finance) Student, Department of Applied Economics,
School of Economics, Kenyatta University, Kenya
Abstract
Kenya’s Vision 2030 indicates that the interest rate spread needs to be maintained at a
sustainable level of about five to six per cent, to achieve the desired level of economic growth.
Little empirical research has been done with respect to the effects of monetary policy on interest
rate spread in Kenya. In addition, none of the studies has looked at the effects of monetary
policy changes on interest rate spread by including the interest rate capping regime. The study
therefore explored the effects of monetary policy on interest rate spread by including the first
quarter of the interest rate capping regime, since its introduction. Average quarterly interest rate
spread, lending rate and deposit rate were modeled against average quarterly central bank rate,
credit reserve ratio, repo rate, interbank rate and Treasury bill rate. Secondary data from 2006
to 2016 was used. The auto regressive distributed lag model and Eviews were employed to
analyze the data. The results revealed that the central bank rate and interbank rate had positive
effect on interest rate spread, while cash reserve ratio, repo rate and Treasury bill rate had a
negative effect on interest rate spread, in the long run. The cash reserve ratio, interbank rate,
repo rate and Treasury bill rate were found to be significant monetary policy instruments and
thus play an important role in explaining changes in the interest rate spread. The results also
concluded that the lending rate was more elastic than deposit rate to changes in monetary
policy instruments, in the long run.
Keywords: Interest rate spread; Monetary policy; Lending rate; Deposit rate; Banking sector;
Licensed under Creative Common Page 266
INTRODUCTION
Background
The banking sector plays a fundamental role in the economy through the intermediation
function. Banking business involves receiving funds from the public through demand, time and
saving deposits, or borrowing from the public and other banks, and then using the funds wholly
or partly for granting loans, advances and credit facilities and investing by other means (Chirwa,
2001). The process of accepting deposits and lending the funds takes place at an interest cost
both to the depositor and the borrower.
The difference between the interest paid to the depositor and the interest charged on the
borrower is what is called the interest rate spread (Tarus, Chekol and Mutwol, 2012). It is
defined by market microstructure characteristics of the banking sector and the policy
environment (Ngugi, 2001). A key indicator of banking sector financial performance, efficiency of
financial intermediation and monetary policy impact is the interest rate spread.
Globally, the magnitude of interest rate spread varies across the world, which has been
majorly attributed to the nature and efficiency of the financial sectors (Gatune and Gikera,
2015). It is inversely related to the degree of efficiency of the financial sector (Gatune and
Gikera, 2015). Economies with weak financial sectors have much larger intermediation costs
thus increased spread (Jayaraman and Sharma, 2003).
In developing economies, where capital markets are underdeveloped and commercial
banks are greatly relied on for financing, the banking sectors play a crucial role in economic
growth (Martinez and Mody, 2004). Tarus et.al (2012) noted that, it is therefore important that
commercial banks provide financing services at the lowest possible cost. However, most
countries in the sub Saharan Africa (SSA) still face high interest rate spreads, despite having
undertaken structural adjustment reforms that resulted to liberalization of interest rates (Were
and Wambua, 2014).
Researchers have ascribed the existence of high interest rate spread in developing
countries to several factors which include high operating costs; financial repression; lack of
competition among banks and market power of a few large dominant banks which enables them
to manipulate industry variables such as lending and deposit rates and high inflation rates
(Gatune and Gikera, 2015). A number of studies conducted on the factors influencing interest
rate spread in Kenya identified credit risk, market structure, liquidity risk, operation cost, bank
size, return on average assets, inflation, Treasury bill (Tbill) rate and central bank rate (CBR) as
significant factors.
Since liberalization of the Kenyan banking sector in the early 1990s, the sector has
Licensed under Creative Common Page 267
financial hub of the East Africa region (Nyasha and Odhiambo, 2012). According to Financial
Sector Deepening (FSD) Kenya (2015), the banking sector in Kenya has transformed
significantly with increased depth, stability and access. Despite this, the sector has been a
victim of challenges such as high cost of credit, high interest rate spread, comparatively high
ratio of non-performing loans in some major banks, weak legal arrangements and slower
transformation of local small privately owned banks (FSD Kenya, 2010; FSD Kenya, 2015).
Of concern is the high interest rate spread and its negative effects, which has attracted a
lot of research and debate both in the private and public forums. Kenya’s Vision 2030 indicates
that the interest rate spread needs to be maintained at a sustainable level of about five to six
percent to achieve the desired level of economic growth (Ondari, Murkas and Momanyi, 2016).
Several reforms and monetary policy developments have taken place in a bid to tackle the issue
of high interest rate spread.
In 2002, the Kenya African National Union (KANU) regime was replaced by a newly
elected coalition government which pledged to uproot corruption among other vices in the
economy (Gatune and Gikera, 2015). According to Market Intelligence (2003) as quoted by
Gatune and Gikera (2015), the effect of this for the banking sector was the invoking of Section
44 of the Banking Act by the Finance minister during the 2003 budget. Gatune and Gikera
(2015) stipulated that this and stricter supervision of banking activities by the Central Bank led
to a decline in profits for the banking sector and a narrowing of interest rate spreads. Despite
this, the interest rate spread stood at 13.36% which was still relatively high.
The central bank rate was then introduced in June 2006, in accordance with Section
36(4) of the Central Bank of Kenya (CBK) Act. Its purpose was to signal the stance of monetary
policy so as to help regulate the high lending rates charged by banks and ultimately the high
interest rate spread (Mwega, 2014). Before the introduction of the CBR, the bank rate being
used since 2000 was three percent above the Tbill rate (Mwega, 2014). The effectiveness of the
CBR in regulating the high lending rates however, has been weak in the last decade since its
introduction, as the interest rate spread which stood at nine point zero eight percent, still
remained relatively higher than the Kenya’s Vision 2030 target of between five to six percent.
In August, 2016, a legislation of the Banking Act that capped lending rates at not more
than four percent above the CBR and deposit rates at 70% of the CBR was approved; it came
into effect on 14th September, 2016 (CBK, 2017). The Economic Survey (2017) stipulated that
the amendment was aimed at protecting borrowers from high interest rates and reducing the
high interest rate spread. This was not the first proposal of such an Act.
According to the Institute of Certified Public Accountants of Kenya (ICPAK) (2016), in
Licensed under Creative Common Page 268
and cap lending rates at four percent above the 91-day Tbill rate and the deposit rate at four
percent below the 91-day Tbill rate, bringing the spread to eight percent. In addition, in 2013,
the Parliamentary Budget Office proposed the pegging of the deposit rates on lending rates
(Cytonn, 2016). However, both of these attempts were futile. The interest rate capping has been
successful in reducing cost of borrowing and the interest rate spread (CBK, 2017). However, the
interest rate spread target as postulated by Kenya’s Vision 2030 has yet to be achieved.
The role of the financial sector in promoting economic growth and development is well
acknowledged in Kenya’s vision 2030. Given the dominant role the banking sector plays in the
financial sector through carrying out the intermediation function, an analysis of interest rate
spread in the banking sector is central in understanding the financial intermediation process and
the macroeconomic environment in which banks operate (Were and Wambua, 2014).
Interest rate spread in Kenya
The difference between the interest rates at which banks lend money to borrowers and the
interest rates they pay to depositors is generally known as interest rate spread (Chelang’a,
2015). Interest rate spread is calculated as follows:
Interest rate spread = Interest rate on loans – Interest rate on deposits………..(1.1) Kenya’s Vision 2030 indicates that the interest rate spread needs to be maintained at a
sustainable level of about five to six percent to achieve the desired level of economic growth
(Ondari et.al, 2016). The country’s banking sector however, has been recording higher spreads,
which has been a source of policy concern.
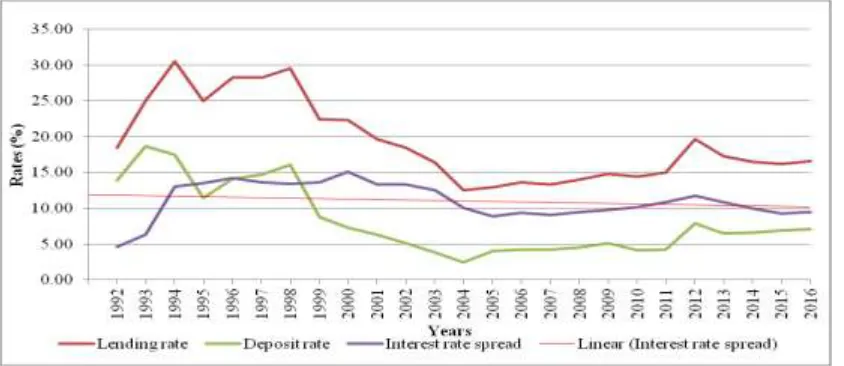
Figure 1: Weighted average commercial banks’ lending rate, deposit rate
and interest rate spread in Kenya: 1992-2016
Licensed under Creative Common Page 269
Looking at Figure 1, a downward trend is seen in the interest rate spread following various
financial reforms undertaken during the period. The abolishment of all charges and fees from
the ceiling on commercial bank loan rates in early 1990s, brought about the spike in the average
lending rates, which increased the interest rate spread between 1992 and 1994 (Nyasha and
Odhiambo, 2012). Further amendments made on the Banking Act in 1995, aimed at increasing
and strengthening the banking industry supervision, saw a further rise in the spread as a result
of a significant drop in both the lending and the deposit rates (Beck et.al, 2010). The period after
1995 to 2003 saw a relatively stable interest rate spread, partly occasioned by the increased
CBK’s monetary autonomy through the amendment of the Central Bank Act in 1997, and the
enhancement of capital requirements by the Central Bank in 1998 (Nyasha and Odhiambo,
2012; Beck et.al, 2010). A gradual decline in the spread followed between 2003 and 2005
largely because of the need of the banking sector to achieve the objective of narrowing high
interest rate spreads set out in the Economic Recovery Strategy (ERS) paper on Wealth
Creation and Employment among other requirements (Government of Kenya (GOK), 2003).
The introduction of the CBR in 2006 and the publication of Kenya’s vision 2030 in 2007
as a long term development plan for the country, saw a relatively stable trend in the interest rate
spread between 2006 and 2011 (GOK, 2007). A general downward trend in the spread was
witnessed between 2012 and 2016 on account of the change of government following the
elections held in 2012. The lowering of the CBR, interbank rate and repo rate in 2013 and the
implementation of the interest rate capping law in mid-September 2016 also contributed to the
downward trend in the spread.
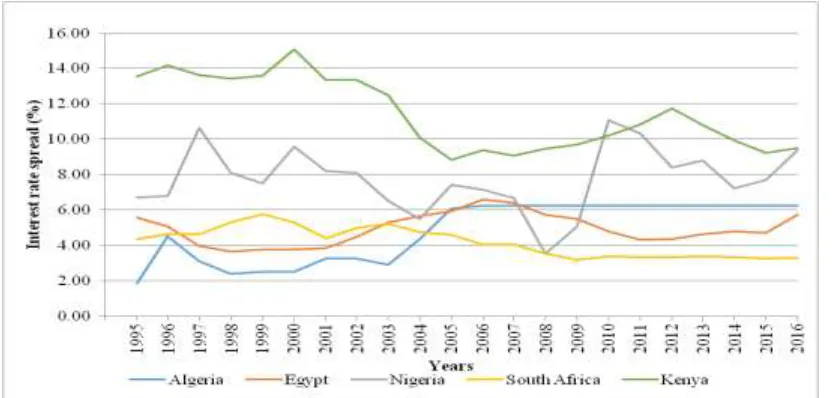
Figure 2: Comparison of interest rate spread between Kenya and
the top economies in Africa: 1995-2016
Licensed under Creative Common Page 270
In comparison with the top four economies in Africa, figure 2 shows that the interest rate spread
in Kenya has been way above that in Nigeria, South Africa, Egypt and Algeria. Algeria has the
most stable interest rate spread having maintained it at six point two five percent for 10 years
since 2006. South Africa has the lowest interest rate spread standing at three point two nine
percent in 2016. While the trend has been declining in Kenya and South Africa, it has been rising
in Algeria, Egypt and Nigeria between 1995 and 2016. South Africa’s spread however, has been
declining at a steadier rate compared to that of Kenya. The interest rate spread in Algeria, Egypt
and South Africa has relatively been stable overtime as opposed to that of Kenya and Nigeria.
Evolution of the Monetary Policy in Kenya after liberalization
Central Bank of Kenya (2017) defines monetary policy as the decisions and actions taken by the
Central Bank to ensure that the supply of money in the economy is consistent with growth and
price objectives set by the government. The CBK has been mandated with the role of
formulating and implementing monetary policy, and the Monetary Policy Committee (MPC) with
the role of making monetary decisions in order to maintain price stability in the economy (CBK
2017). The instruments used by CBK are: the cash reserve ratio (CRR), central bank rate
(CBR), discount window operations, open market operations (OMO), which involve the use of
Tbills, Repos, Reverse Repos, Term Auction Deposits and Horizontal Repos, and foreign
exchange market operations, which involve sale and purchase of foreign exchange to and from
commercial banks (CBK, 2017).
The monetary policy in Kenya has gradually developed since its liberalization in the early
90s. 1990 to 1993 reflected a collapse of the monetary and fiscal policy, with the country
experiencing the near-collapse of the shilling, the rapid growth of money supply reaching 34% in
1991, high inflation of close to 70% and the slowdown in economic growth to less than one
percent in 1993 (Kinyua, 2001). In addition to this, the Central Bank Act allowed the override of
CBK’s Board of Directors decisions by the Minister of Finance, which in itself presented an
anomaly. Hence the bank had only limited authority on the management of monetary policy
(Ngugi, 2001).
In an effort to remedy the deteriorating situation, the Central Bank Act was changed in
1996, expanding the role of CBK to that of maintaining of price stability, promoting liquidity and
ensuring exchange rate and financial stability, with the ultimate goal of long term economic
growth (Kinyua, 2001). Moreover, there was a shift from use of broad money (M3) to broader
money (M3X and M3XT) in 1998. M3X is an aggregation of M3 and foreign currency deposits
(FCDs) held by residents; and M3XT is defined as M3X plus government papers held by
Licensed under Creative Common Page 271
currency in circulation, served as an operating target. OMO, the cash ratio, the reserve
requirement, rediscount facilities and lender of last resort facility were also implemented
(Nyorekwa and Odhiambo, 2014).
Controlled monetary expansion ensured that growth in broad money (M3) remained low
at two point eight percent in 1999. This helped in achieving the main objective of having money
supply expand at the same pace with production of goods and services hence, maintaining low
inflation (Kinyua, 2001). In 2001/02, the government pursued tight monetary policy aimed at
containing inflation within the five percent target and stabilizing of the shilling and exchange
rate. Controlled domestic borrowing by the government led to lowered Tbill rates (Kinyua, 2001).
The period between 2003 and 2016 saw the introduction of the CBR in 2006 and
discount window in 2011, as a means of providing temporary liquidity to banks in extreme cases
(CBK, 2017). In addition, a legislation of the Banking Act that capped lending rates at not more
than four percent above the CBR, and deposit rates at 70% of the CBR, was approved in
August 2016 and implemented in mid-September 2016 to protect borrowers from high interest
rates and reduce the high interest rate spread (CBK, 2017; Economic Survey, 2017).
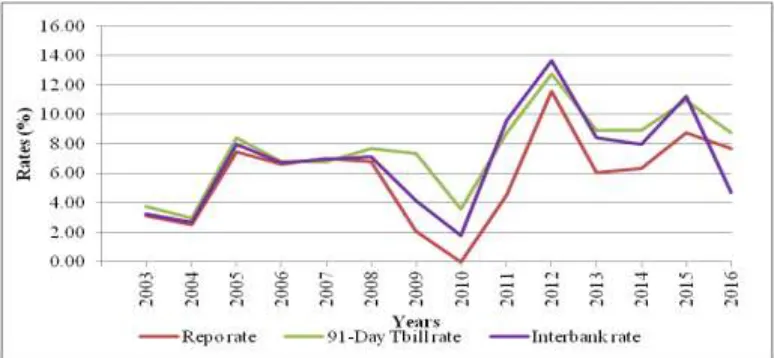
Figure 3: Average repo rate, 91-day Tbill rate and interbank rate in Kenya: 2003 - 2016
Source: Central Bank of Kenya
The figures 3 and 4 show the changes in the Kenya monetary policy from 2003 to 2016. Figure
3 shows cyclical movements of the average repo, 91-day Tbill and interbank rates. All the three
rates sharply increased in 2005 due to improved liquidity conditions (Kenya Gazette, 2006).
Relatively stable rates followed thereafter till 2008 occasioned partly by improved revenue
collection and slower execution of budgeted expenditure (Kenya Gazette, 2006). This was
Licensed under Creative Common Page 272
been caused by political instability; the economy needed some monetary stimulus hence an
expansionary monetary policy (Economic Survey, 2010).
However, an acute rise of the rates was experienced in 2012, partly due to the upward
adjustment of the CBR with a view of taming high inflation that was caused by a surge in the
global commodity prices (Economic Survey, 2013). A decrease followed this phenomenon in
2013 due to the downward adjustment of the CBR for some monetary stimulus after the
elections in 2012 (Economic Survey, 2013). Thereafter, the repo and 91-day Tbill rates steadily
increased due to reduced pressure on domestic borrowing by the government brought about by
the rationalization of expenditures (Monetary Policy Statement, 2016). The interbank rate on the
other hand dipped in 2016.
Figure 4: Average central bank rate, cash reserve ratio and
discount window rate in Kenya: 2003 - 2016
Source: Central Bank of Kenya
Figure 4 shows that CRR reduced from seven point six seven percent in 2003 to six percent in
2004 and then to four point five percent in 2009, following largely the political instability
(Economic Survey, 2010). The CBR also experience a decline till 2010 largely due to the
economic slowdown which had been caused by political instability; the economy needed some
monetary stimulus hence an expansionary monetary policy (Economic Survey, 2010). The CRR,
CBR and discount window rate increased in 2012 by reason of reinforcing the gradual tightening
of the monetary policy by the MPC, to curb inflationary pressures and achieve exchange rate
stability (Economic Survey, 2012). There was a general decline in the CBR and the discount
Licensed under Creative Common Page 273
incipient inflationary pressures and the exchange rate volatility (Economic Survey, 2016). The
CRR was maintained at five point two five percent till 2016.
From the above, it is clear that CBK has over the years continuously refined its monetary
policy operations and procedures so as to enhance the efficiency and effectiveness of delivery
of its objectives in a changing financial and economic environment.
Monetary Policy and interest rate spread in Kenya
In a bid to ensure price stability, Central Banks adopt monetary policy instruments to control
movements in interest rates in the economy. Generally, the Central Banks can undertake
expansionary monetary policy or contractionary monetary policy. A contractionary monetary
policy lowers bank reserves, deposits and loans and increases interest rates. This impacts the
economy through an increase in the cost of borrowing, which then leads to a fall in investment
and the general price level (Akhtar, 1995; Kelilume, 2014). The reverse situation applies with
expansionary monetary policy but, this may not be the actual behavior of interest rate in practice
(Kelilume, 2014).
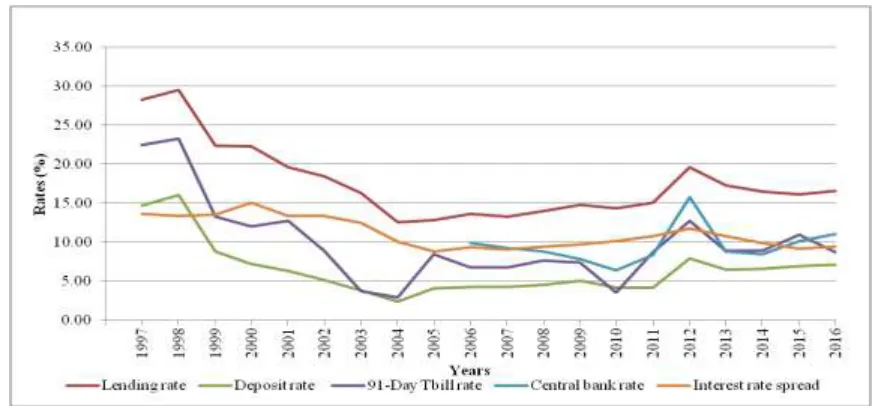
Figure 5: Average lending rate, deposit rate, 91-day Tbill rate, central bank rate
and interest rate spread in Kenya: 1997 - 2016
Source: Central Bank of Kenya
Figure 5 shows the relationship between monetary policy and the interest rate spread in Kenya
in the last two decades since 1997. The Tbill rate and the CBR have not been effective in
regulation the lending and deposit rates and reducing the interest rate spread to levels
Licensed under Creative Common Page 274
rate, lending rate and deposit rate are seen to gradually decline. However, the rate at which the
lending and deposit rates were declining is not proportionate to the rate of decline in the Tbill
rate. While the Tbill rate declined by approximately 70%, the lending rate and deposit rate
declined by 52% and 71% respectively. As a result of this, the interest rate spread only dropped
by roughly 31%.
During the second decade, 2007 – 2016, the rise and fall in the Tbill rate and CBR was
not followed by same proportionate rise and fall in the lending and deposit rates. For instance,
between 2009 and 2010, the average Tbill rate and CBR dropped by 3.78 and 1.46 points
percentage respectively, while the lending and deposit rates only dropped by 0.45 and 0.93
percentage points respectively. This translated to a 0.48 percentage point drop in interest rate
spread. Similarly, Tbill rate and CBR dropped by 3.83 and 6.92 percentage points between
2012 and 2013 while the lending rate only dropped by 2.34 percentage points, the deposit rate
by 1.40 percentage points and the interest rate spread by 0.94 percentage points.
Credit growth and interest rate spread in Kenya
High interest rate spread hinders the access to credit by the private sector which is an
impediment to economic growth (Rebei, 2014). In addition, Gatune and Gikera (2015) noted that
high interest rate spreads are an impediment to financial intermediation, as they discourage
potential savers due to low returns on deposits, and increase financing costs for borrowers,
which lead to reduced investment and growth opportunities.
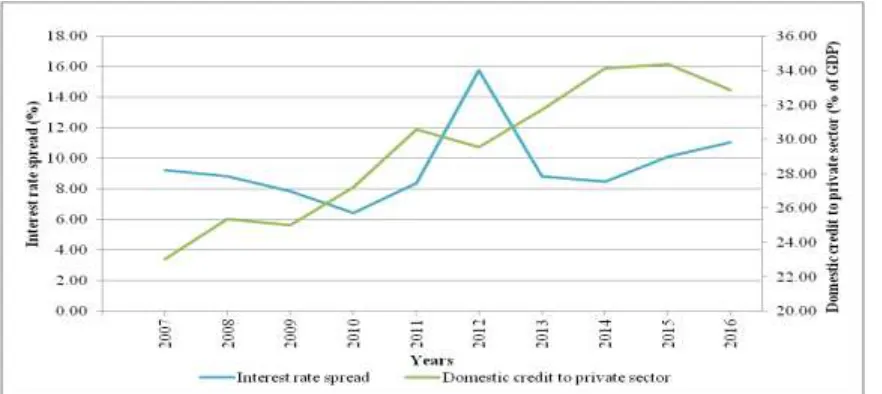
Figure 6: Interest rate spread and domestic credit to private sector in Kenya: 2007 - 2016
Licensed under Creative Common Page 275
Kenya’s banking sector has in the last decade recorded an expansion in the private sector credit
as shown in figure 6. The figure shows that generally, domestic credit to private sector in Kenya
has had a negative relationship with interest rate spread in the decade. The period 2010/11
presented an exemption where the increase of the interest rate spread saw an expansion in
private sector credit on cause of the prevailing monetary policy regime at the time (CBK, 2011).
Due to high interest rate spread, contracted deposits reduce the supply of the bank loans which
increase the loan rate and thus the cost of borrowing becomes higher (Wambugu, 2014). Banks
are therefore expected to carry out intermediation at the lowest cost possible with a view to
promote investment opportunities and overall economic growth (Tarus et.al, 2012).
The statement of the problem
The banking sector in Kenya has been shown to exhibit significant and persistent high interest
rate spread, compared to those in more developed African countries. High interest rate spread
hinders the access to credit by the private sector, which is an impediment to economic growth.
In addition, it discourages the deepening of financial intermediation which limits financing for
potential borrowers due to increased financing costs.
Kenya’s Vision 2030 indicates that the interest rate spread needs to be maintained at a
sustainable level of about five to six percent to achieve the desired level of economic growth.
Despite the ongoing financial sector reforms aimed at enhancing competition, and the monetary
policy developments aimed at reducing the interest rate spread through the regulation of lending
and deposit rates over the years, such as the introduction of the CBR and the implementation of
the interest rate capping, the spread still remains relatively higher than the stipulated target.
In an attempt to understand how to tackle the high interest rate spread problem, various
studies have been conducted on the factors that influence interest rate spread in Kenya.
Despite having a large number of studies done on the determinants of interest rate spread, little
empirical research has been done with respect to the effects monetary policy has on interest
rate spread. In addition, none of the studies have looked at the effects of the changes in
monetary policy instruments on interest rate spread by including the interest rate capping
regime. Therefore, the contribution of this study was to investigate the effects of monetary policy
on interest rate spread in the banking sector in Kenya, by including the first quarter of the
interest rate capping regime since its introduction.
Research questions
i. How do changes in the monetary policy instruments influence the interest rate spread in
Licensed under Creative Common Page 276
ii. What is the difference in the elasticity of lending rate and deposit rate to changes in
monetary policy instruments in Kenya’s banking sector?
Objective of the study
The general objective of this study was to deepen the understanding on the effects of monetary
policy on interest rate spread in Kenya.
Specific objectives
i. To examine how changes in monetary policy instruments influence the interest rate
spread in Kenya’s banking sector.
ii. To establish the difference in the elasticity of lending rate and deposit rate to changes in
monetary policy instruments in Kenya’s banking sector.
Significance of the study
In the Kenya vision 2030, one of the stipulated constraints the financial services sector has to
overcome is to lower the interest rate spread. The understanding of the effects monetary policy
has on interest rate spread would help the CBK to come up with monetary policy reforms aimed
at achieving the interest rate spread target stipulated in the vision 2030. This would encourage
financial deepening through savings and credit expansion, and a safe, sound competitive and
efficient banking system.
The results of the study would also be of great value to the various stakeholders, as
understanding the relationship between monetary policy and interest rate spread would provide
them with an insight into making more informed choices on borrowing, lending and saving. This
would in turn help in short term and long term financial and strategic decision making.
The research would also be beneficial to researchers and scholars, through its
contribution to the pool of knowledge on the effects of monetary policy on interest rate spread in
Kenya and hence form a basis for further research and use as an academic reference material.
Scope of the study
The study focused on the effects of monetary policy on interest rate spread in Kenya from the
third quarter of 2006 to the fourth quarter of 2016. The period of the study is critical because it
reflects a decade of the operation of the central bank rate since its introduction in 2006.
Quarterly data is also used to capture more accurately, any monetary policy changes and the
Licensed under Creative Common Page 277
policy instruments included are the five most commonly used by CBK which were the central
bank rate, credit reserve ratio, interbank rate, repo rate and 91-day Treasury bill rate.
LITERATURE REVIEW
Theoretical literature
Keynesian liquidity preference theory of interest rate determination
The theory was put forward by Keynes (1936) and stated that interest rate is determined by the
desire to hold money and the supply of money. Keynes (1936) defined interest rate as the price
which equilibrates the desire to hold cash with the available quantity of cash. Keynes (1936)
therefore viewed money as the liquid asset and the rate of interest as the payment for the loss
of that liquidity.
Demand for money arises from three motives; transactions, precautionary and
speculative. Under transactions motive, people desire to hold money for carrying out normal
transactions of business and exchange; precautionary motive of money demand entails holding
money for unseen contingencies that may require sudden expenditure; and speculative motive
is the desire to hold money in order to gain profit through changes in prices in future
(Stephanson, 1950). The supply for money is considered to be fixed by the state policy in the
short run and Keynes treated it as a discretionary factor. Short term interest rate is therefore
determined at the point of equilibrium between demand for money and the supply of money and
is therefore viewed as a monetary phenomenon.
The role of interest rate as a reward of parting with liquidity makes interest rate a viable
tool for government intervention through the monetary authority in the financial market to
manage the economy in the short term. This theory therefore, forms the basis of interest rate
channel of monetary policy which is fundamental to this study. This theory however, failed to
adequately explain the role of commercial banks in monetary policy transmission under
imperfect market conditions and is therefore considered as incomplete. The theory is criticized
for assuming interest rates as monetary phenomena and ignoring the effect of savings and
investments on interest rates.
The loanable funds theory of interest rate determination
The theory was developed by Robertson (1937) and later revised in greater detail by Halm
(1946). This theory depicted that the rate of interest is determined by the interaction of the
demand and supply of loanable funds. The origin and magnitude of interest rate is determined
Licensed under Creative Common Page 278
profit expectations and the supply by present and future income and interest rates (Stephanson,
1950).
Halm (1946) defined loanable funds as the sum of money supplied and demanded in the
credit market. The demand for loanable funds consists of consumer demand, which was
reflected in the purchase of durable goods, producer demand and partly included cash balances
(Halm, 1946). Stephanson (1950) indicated that an increasing number of producers were willing
to use increasing amounts of loanable funds at a decreasing interest cost. Hence the demand
curve is downward sloping. The assumption made about the supply of loanable funds is that
people tend to save and hoard more at a higher rate of interest and thus the supply curve is
upward sloping (Halm, 1946).
The theory links to the study by linking the determination of deposit rate and lending
rates to the interaction of the demand and supply of loanable funds, in this case, deposits and
loans. If the lending rate differs from deposit rate there exists a difference which is the interest
rate spread. The theory is criticized for assuming that interest rate is determined by time
preference.
Post Keynesian structuralist theory
The theory held that money supply is endogenous and emphasized on bank lending activity
(Pollin, 1991). Palley (2001) asserted that bank credit leads to creation of deposits and
ultimately increases money supply. The theory prescribed that commercial banks respond to
changes in the market by taking positions that maximize their profits. This means that
commercial banks react to monetary policy changes by revisiting their portfolios of assets and
liabilities (Palley, 2001). The structuralists argued that commercial banks are profit seeking firms
that continually create new financial instruments to economize on reserves, evade interest rate
controls or move assets off their balance sheet.
Commercial banks interaction with Central Bank depends on the commercial banks
liquidity position which means that, it is not always necessary for commercial banks to approach
Central Bank for liquidity provision every time monetary policy changes (Pollin, 1991).
Essentially, the theory claims that Central Bank has control over money supply only to the
extent that changes in monetary policy affect the cost structure of commercial banks, compelling
the banks to adjust their assets and liability positions. This then leads to a change in the
commercial banks’ ability to extend loans to their customers and ultimately changes money
supply. The theory is important to this study because it appraises the credit channel of monetary
transmission which focuses on bank behavior. This study accepts this approach as it explains
Licensed under Creative Common Page 279
Monti-Klein imperfect competition framework
This framework assumes that a commercial bank is confronted by a downward sloping demand
for loans and an upward sloping supply of deposits. The bank seeks to maximize its profits, and
its decision variables are the amount of loans and deposits (Freixas and Rochet, 1997). The
model states that if the policy rate given by the Central Bank is fixed, then the bank’s profits are
given by the sum of intermediation margins on loans and deposits, less management costs. The
higher the market power of a bank, the higher the intermediation margin (Freixas and Rochet,
1997). Market power will lead banks to quote lower deposit rates and higher loan rates leading
to a high interest rate spread.
One implication of this framework is that, when management costs are assumed to be
additive the bank’s decision problem is separable; which means that the optimal deposit rate is
independent of the characteristics of the loans market and the optimal loan rate is independent
of the characteristics of the deposit market (Freixas and Rochet, 1997). In addition, under the
same assumption, the sensitivity of optimal deposit rate and loan rate to changes in the policy
rate depends on the number of banks in the banking sector. As the number of banks grows, the
optimal loan rate decreases and the optimal deposit rate increases.
Empirical literature
A dynamic panel regression analysis by Folawewo and Tennant (2008) on 33 SSA countries
from 1988 to 2005 and guided by the work of Demirguc-Kunt and Huizinga (1999), found the
central bank’s discount rate and reserve requirement to be statistically significant and positively
related to interest rate spread. This study also concluded that Tbill rate has a negative and
statistically significant effect on interest rate spread. Diagnostic tests carried out in the study
included; the multicollinearity test by using the correction matrix and the unit root test for
stationarity of data.
Mohsin (2011) studied the impact of monetary policy on lending and deposit rates in
Pakistan by use of panel data analysis on monthly bank data for the period November 2001 to
March 2011. The study applied the Philip and Loretan (1991) method which is an extension of
Engle and Granger (1987). The study concluded that lending rate was co-integrated while
deposit rate was not co-integrated with the central bank discount rate in the long run. In
addition, it concluded that only 0.2 and 0.16 of the impact of a change in the discount rate is
passed to the lending rate and deposit rate respectively.
Aress (2012) conducted a multiple regression analysis to determine the effect of
monetary policy on interest rates in Kenya. The study, which was anchored on the loanable
Licensed under Creative Common Page 280
lending rate while CBR had negative effect on lending rate in Kenya. Tbill and CBR were
statistically significant while Repo rate was non-significant.
Makambi (2012) applied the Auto Regressive Distributed Lag (ARDL) estimation, Error
Correction Model (ECM) and Augmented Dickey-Fuller (ADF) stationarity test to find out the
nature and dynamics of adjustments of commercial banks’ retail rates to monetary policy
changes in Kenya. The study, which was anchored on the Post Keynesian structuralist theory
and Monti-Klein profit maximization model, found that the interbank rate, repo rate and Tbill rate
had a positive effect on both the lending rate and deposit rate. The study also found that lending
rates were rigid upwards as they adjusted faster to decreases in monetary policy rates relative
to increase in monetary policy rates. In contrast, deposit rates were found to be rigid downwards
as they adjusted faster to increase in monetary policy rates compared to decreases in monetary
policy rates. Diagnostic tests conducted by the study were; the Durbin Watson and
Breusch-Godfrey LM test for autocorrelation, ARCH LM test for heteroskedasticity and F statistics for the
stability of the models.
Oduori (2012), based on the theoretical work of Ho and Saunders (1981), used
generalized least square regression analysis on monthly data between 2007 and 2011 to
analyze the factors affecting interest rate spread amongst commercial banks in Kenya. The
study found the 91-day Tbill rate to be negative and significant, CBR to be positive and
significant and interbank rate and CRR to be negative and non-significant. The diagnostic tests
carried out by the study were the Shapiro-Wilk normality test and autocorrelation test using the
Auto Correlation Factor Plot (ACF). Nonetheless, the period covered by the study was relatively
short which rendered it insufficient to draw inferences over the long run.
Garr and Coleman (2013), by use of panel data regression on time series data from
1990 to 2010 and guided by the works of Demirguc-Kunt and Huizinga (1998), Moore and
Craigwell (2000) and Sologoub (2006), concluded that required reserve, Tbill rate and the
discount rate were found to have no relationship with interest rate spread in Ghana. The study
carried out the test for multicollinearity using the correlation matrix and the ADF Unit root test to
test for stationarity of the data.
Nampewo (2013) found Tbill rate and CBR to have a positive and statistically significant
effect on interest rate spread in Uganda; a study which was based on McKinnon and Shaw
(1973) paradigm. The study employed the Engle and Granger (1987) two-step procedure and
the ECM on quarterly data for the period 1995 to 2010. The study also tested for data
stationarity using the ADF unit root test, for autocorrelation using the Durbin-Watson Statistic,
for model specification using the Ramsey RESET test and for serial correlation using the
Licensed under Creative Common Page 281
A study by Kelilume (2014) on the effects of the monetary policy rate on interest rates in Nigeria,
found that after first differencing, the monetary policy rate had a positive impact on deposit rate
and prime lending rate. The study also found that the interest rate pass-through from monetary
policy rate into prime lending rate was complete and significant while the pass-through to
deposit rate was incomplete and non-significant on the basis of the traditional t-test. The study
was based on the Monti-Klein framework and the marginal cost pricing model, also referred to
as monetary policy approach (de Bondt, 2005) and adopted the Vector Autoregressive (VAR)
methodology. The ADF unit root test was used to test for stationarity. The study however used
a short time span of 2007 – 2012.
Rebei (2014), by use of the pooled estimated generalized least square method of
estimation on panel data from 2009 Q1 to 2013 Q3, also found that policy interest rate proxied
by Tbill rate, known as Bokolo bill rate, had a positively and statistically significant effect on
interest rate spread in Solomon Islands. However the length and size of the sample used could
not conduct analysis on individual banks.
Were and Wambua (2014) applied panel data regression analysis and tested for
multicollinearity on annual data for the period 2002–2011 to empirically investigate the factors
that drive interest rate spread of commercial banks in Kenya. It was anchored on the bank
dealership model by Ho and Saunders (1981). The study found the effect of monetary policy,
proxied by the CBR, on interest rate spread to be positive but not highly significant.
Nevertheless the study used a simple measure of spread which is affected by the composition
of lending of individual banks.
Ondari et.al (2016) used panel data regression on annual data between years 2002 to
2011 to analyze the determinants of interest rate spread in Kenya. The study was based on the
model by Ghosh (2008) and the dealership model of Ho and Saunders (1981). Diagnostic tests
carried out were; the unit root test, normality test, tests for fixed and random effects and tests for
multicollinearity, autocorrelation and heteroskedasticity. The findings revealed Tbill rate to be
positive and significant and CRR to be negative and non-significant in determining interest rate
spread. The study however, did not include all the banks in study.
Overview of literature
The theoretical literature review discussed loanable funds theory of interest rate determination,
Keynesian liquidity preference theory of interest rate determination, post Keynesian structuralist
theory and Monti-Klein imperfect competition framework. Various studies carried out on how
monetary policy influences interest rate spreads, deposit rates and lending rates were
Licensed under Creative Common Page 282
Empirical literature review showed that results varied for various studies and in different
countries. While Folawewo and Tennant (2008) and Oduori (2012) concluded that Tbill rate had
a negative effect on interest rate spread, Nampewo (2013) and Ondari et.al (2016) concluded
that Tbill rate had a positive effect on interest rate spread. Similarly, while the results by
Kelilume (2014) concluded that the monetary policy rate had a positive impact on deposit rate
and prime lending rate, Mohsin (2011) concluded that lending rate was co-integrated while
deposit rate was not co-integrated with the central bank discount rate in the long run. In
addition, different models of estimation were used by different studies such as panel data
regression, pooled generalized least square method, ECM, ARDL model and multiple
regression among others.
Most studies used the Tbill rate, CBR and reserve requirement as the main proxies for
monetary policy. The other monetary instruments have been under researched. In addition,
none of the studies reviewed in Kenya has looked at the effect of monetary policy instruments
on interest rate spread by including the interest rate capping regime. This in itself posed a
research gap. There was therefore a need to extend investigations to accommodate the interest
rate capping period.
As a result, the study was anchored on post Keynesian structuralist theory and
Monti-Klein imperfect competition framework because Kenya’s banking sector is characterized by
commercial banks seeking to maximize their profits in the presence of information asymmetry
and imperfect competition. In addition, Aress (2012) and Oduori (2012) guided the choice of
independent variables and Makambi (2012) guided the use of ARDL estimation models by the
study. ARDL model was chosen because it eliminates the problem of serial correlation in error
term, it is fairly straightforward to determine the optimal number of lags to be included in an
ARDL model and the model is valuable in testing for the presence of long run relationships
between economic time series.
Diagnostic tests carried out by the study were: the stationarity test, multicollimearity test,
heteroskedasticity test, serial correlation test, model specification and model significance and
reliability, as in the studies: Folawewo and Tennant (2008), Makambi (2012), Garr and Coleman
(2013), Nampewo (2013), Were and Wambua (2014) and Ondari et. al (2016).
METHODOLOGY
Research design
The study adopted the experimental research design which is often used where there is time
priority in a causal relationship; in other words, the cause precedes the effect. The dependent
Licensed under Creative Common Page 283
independent variables used were the average central bank rate (CBR), cash reserve ratio
(CRR), interbank rate, repo rate and 91-day Tbill rate.
Theoretical framework
The methodology adopted was anchored on the post Keynesian structuralist theory and
Monti-Klein imperfect competition framework because Kenya’s banking sector is characterized by
commercial banks seeking to maximize their profits in the presence of information asymmetry
and imperfect competition. This in turn leads to the determination of the lending and deposit
rates and ultimately, interest rate spread.
Effects of changes in monetary policy on interest rate spread
In order to meet the first objective, this study adopted the Monti-Klein imperfect competition
model developed by Freixas and Rochet (1997). The model held that banks face a downward
sloping aggregate demand for loans and an upward sloping aggregate supply of deposits, that
is, there is imperfect competition in the market for banks (Spahn, 2008). D is assumed to
represent deposits, L represents loans, rD represents return on deposits and rL represents the
price on loans (Spahn, 2008). Further the model assumes that technology is given which implies
that the cost of handling deposits and loans is represented by C (D, L) (Spahn, 2008). The
model also assumes that there are N banks (n = 1, 2,…, N) which use the same technology
(Spahn, 2008).
Bank n’s balance sheet is represented as: Dn = Ln + Mn………....(3.1)
Where; Dn are deposits (liability), Ln are loans (asset) and Mn are the interbank balances
(asset). Mn is the net position of bank n on the interbank market where the interest rate m, is
exogenous to the bank (Spahn, 2008).
Spahn (2008) showed that the profit of bank n is given by:
* *
(
)
(
)
(
,
)
L D
n n m n n n m n n n n
m n m n
r L
L L
mM
r D
D D
C D L
………(3.2)
Freixas and Rochet (1997) showed that equation 3.2 using equation 3.1, can be rewritten as the
sum of the intermediation margins on loans and deposits minus costs as follows:
* *
{ (
L)
}
{
D(
)}
(
,
)
n n m n n m n n n n
m n m n
r L
L
m L
m r D
D
D
C D L
………(3.3)
The unique Cournot equilibrium of the banking sector is characterized by an N-tuple vector (
* n
D
,
* n
L
) n = 1, 2,…, N and has each bank settingD
n*= D*/N andL
*n= L*/N (Freixas and Rochet,Licensed under Creative Common Page 284
The first order conditions are therefore given by:
*
'
( )
*( )
* '( , )
0
L
n
L L
n
L
r L
r L
m C D L
N
L
………..…..(3.4) *'
(
*)
(
*)
'( , )
0
D
n
D D
n
D
r D
m r D
C
D L
N
D
………..….(3.5)Assuming a linear cost function, Cn (Dn, Ln) =ωDD + ωLL, solving for the optimal deposit and loan
rates from equations 3.4 and 3.5 gives:
*
* '
( )
*L
L L
L
r
r L
m
N
………...(3.6) * * '(
*)
D D DD
r
r D
m
N
………...(3.7)
From equation 3.6 and 3.7, it can be seen that in perfect competition where N → ∞, the deposit
and loan intermediation margins are equal to their respective marginal costs (Spahn, 2008).
With oligopoly, N becomes smaller and the loan intermediation margin increases since
' L
r
< 0,whereas the deposit intermediation margin decreases since
' D
r
> 0 (Lim, 2001).Rewriting equations 3.6 and 3.7 obtains:
1 1
*
L
r
m
………..………..(3.8)2 2
*
D
r
m
………...(3.9)Where;
1
* '
( )
*L
r L
LL
N
and 2 * '(
*)
D
r D
DD
N
1
and
2 are constant loan and deposit intermediation margins while
1 and
2measure theeffect of a change in market rate on the loan and deposit rates (Spahn, 2008). Equations 3.8
and 3.9 form the basis of the study’s empirical investigation.
One result that follows from this model is that, when management costs are assumed to be
additive the bank’s decision problem is separable; which means that the optimal deposit rate is
independent of the characteristics of the loans market and the optimal loan rate is independent
of the characteristics of the deposit market (Freixas and Rochet, 1997). This rather important
assumption is employed in literature to justify the use of two separate equations of lending and
deposit rate determination.
Let *
L
r
= Lt be the commercial banks lending rate, *
D
r
= Dt be the commercialbanks deposit rate and m = MPt be the proxy for monetary policy rate at time t. Equations 3.8 and 3.9 can therefore
Licensed under Creative Common Page 285 Lt = β0 + β1MPt...(3.10)
Dt = λ0 + λ1MPt………..……..(3.11)
Since both the lending rate and deposit rate are functions of monetary policy, it implies that
interest rate spread is also a function of monetary policy and can be represented as:
IRSt = θ0 + θ1MPt………..………..(3.12)
Where IRSt = Lt - Dt is the commercial banks interest rate spread at time t.
Difference in the elasticity of lending rate and deposit rate to changes in monetary policy
The methodology adopted to meet the second objective of the study borrows from the
theoretical framework. The Monti-Klein imperfect competition model developed by Freixas and
Rochet (1997) was used to yield equations 3.10 and 3.11. These two equations formed the
basis of the empirical investigation of the second objective, which is to establish the difference
in the elasticity of lending rate and deposit rate to changes in monetary policy.
Model specification
Given the scope and objectives of this study, three empirical Autoregressive Distributed Lag
(ARDL) models were derived. The first ARDL model would help in analyzing the first objective
while the other two ARDL models would analyze the second objective. The study adopted the
ARDL model because the use of Akaike Information Criteria (AIC) to determine the appropriate
number of lags absorb serial correlation and correctly specifies the consequent ARDL model
(Greene, 2003).
The effects of changes in monetary policy on interest rate spread
Equation 3.12 presents the long run relationship between interest rate spread and the monetary
policy rates. The interest rate spread – monetary policy rate ARDL (p,q) model in period t is:
0
1 0
p q
t i t i i t i t
i i
IRS
IRS
MP
……….………..(3.13) Where:
t
IRS
is the average quarterly interest rate spread in period tt i
IRS
is the average quarterly interest rate spread in period t – it i
MP
is the average quarterly monetary policy rate in period t – ii
are the coefficients for short run relationshipi
are the coefficients for long run relationshipLicensed under Creative Common Page 286 t
is the error term in period t, normally distributed about the mean of zeroTo examine the long run effects of changes in monetary policy instruments on interest rate
spread, equation 3.13 was estimated as follows:
0 1 2 3 4 5
t t t t t t
IRS
CB
CR
IB
RP
TB
………...(3.14)Where:
t
IRS
is the average quarterly interest rate spread in period tt
CB
is the average quarterly CBR at time tt
CR
is the average quarterly CRR at time tt
IB
is the average quarterly interbank rate at time tt
RP
is the average quarterly repo rate at time tt
TB
is the average quarterly 91-day Tbill rate at time ti
are the coefficients for long run relationship for i = 1,2,3,4,5The difference in the elasticity of lending rate and deposit rate to changes in monetary
policy
Equation 3.10 presents the long run relationship between the lending rate and the monetary
policy rates, while equation 3.11 presents the long run relationship between the deposit rate and
monetary policy rates. To meet the second objective, the study sought to derive two ARDL
models; one showing the long run relationship between lending rate and monetary policy rates
and the other showing the long run relationship between to the deposit rate and monetary policy
rates. The study then analyzed the difference between corresponding coefficients in both
models. The lending rate – monetary policy rate and deposit rate – monetary policy rate ARDL
(p,q) models in period t were therefore given as:
0
1 0
p q
t i t i i t i t
i i
L
L
MP
……….………..(3.15) 0 1 0 p qt i t i i t i t
i i
D
D
MP
……….……….…(3.16) Where:
t
L
is the average quarterly lending rate in period tt i
L
is the average quarterly lending rate in period t – it
D
is the average quarterly deposit rate in period tt i
Licensed under Creative Common Page 287 t i
MP
is the average quarterly monetary policy rate in period t – ii
and
i are the coefficients for short run relationshipi
and
i are the coefficients for long run relationshipp and q are the number of lag for quarters
t
and
t are the error term in period t, normally distributed about the mean of zeroIn order to examine the difference in the elasticity of lending rate and deposit rate to changes in
monetary policyinstruments in the long run,equations 3.15 and 3.16 were estimated as follows:
0 1 2 3 4 5
t t t t t t
L CB CR IB RP TB ……….……...…………..(3.17)
0 1 2 3 4 5
t t t t t t
D CB CR IB RP TB ……….(3.18)
Where:
t
L
is the average quarterly lending rate in period tt
D
is the average quarterly deposit rate in period tt
CB
is the average quarterly CBR at time tt
CR
is the average quarterly CRR at time tt
IB
is the average quarterly interbank rate at time tt
RP
is the average quarterly repo rate at time tt
TB
is the average quarterly 91-day Tbill rate at time ti
and
iare the coefficients for long run relationship i = 1,2,3,4,5
Definition and measurement of variables
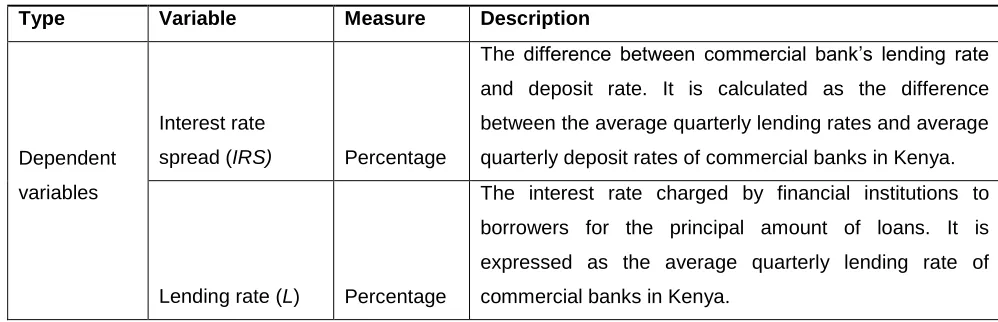
Table 1: Definition and measurement of variables
Type Variable Measure Description
Dependent
variables
Interest rate
spread (IRS) Percentage
The difference between commercial bank’s lending rate
and deposit rate. It is calculated as the difference
between the average quarterly lending rates and average
quarterly deposit rates of commercial banks in Kenya.
Lending rate (L) Percentage
The interest rate charged by financial institutions to
borrowers for the principal amount of loans. It is
expressed as the average quarterly lending rate of
Licensed under Creative Common Page 288 Deposit rate (D) Percentage
The interest rate paid by financial institutions to deposit
account holders. It is expressed as the average quarterly
deposit rate of commercial banks in Kenya.
Independent
variables
Central bank rate
(CB) Percentage
The lowest rate- of interest Central Bank charges on
loans to commercial banks. It is expressed as the
average quarterly central bank rate in Kenya.
Cash reserve ratio
(CR) Percentage
A specified percentage of total deposits commercial
banks should keep in cash as reserve in case of mass
withdrawals by customers. It is expressed as the average
quarterly cash reserve ratio in Kenya.
Interbank rate (IB) Percentage
The rate of interest charged on short-term loans between
banks. It is expressed as the average quarterly interbank
rate in Kenya.
Repo rate (RP) Percentage
The rate at which eligible government securities by the
Central Bank are auctioned in the market to commercial
banks. It is expressed as the average quarterly repo rate
in Kenya.
Tbill rate (TB) Percentage
The return on Treasury bills which are secure short term
investments. It is expressed as the average quarterly
91-day Treasury bill rate in Kenya.
Data type and source
The study used secondary data on the interest rate spread, lending rate, deposit rate, CRR,
CBR, interbank rate, repo rate and the 91-day Tbill rate. Average quarterly time series data was
used ranging from the third quarter of 2006 to the fourth quarter of 2016. The data was obtained
from the Statistical Bulletins published on CBK’s website.
Data analysis approach
The first objective examined how changes in monetary policy instruments influence the interest
rate spread in Kenya’s banking sector. The long run ARDL equation 3.14 was modeled with the
dependent variable being interest rate spread and the independent variables being the
monetary policy rates namely central bank rate, cash reserve ratio, interbank rate, repo rate and
91-day Tbill rate.
Since the study used time series data, each variable was subjected to a unit root test
using the Augmented Dickey-Fuller (ADF) test and the Phillip Perron (PP) test, to determine
stationarity and order of integration. PP test is a superior criterion because it takes care of serial
Licensed under Creative Common Page 289
auto correction and structural breaks. If the variables were found to be integrated at level I(0)
and stationary, then the study proceeded to estimate the ARDL model. If the variables were
found to be non stationary at levels, then the study carried out the first differencing and repeated
the ADF and PP tests. To proceed to estimate the ARDL model, data must be integrated at level
I(0) or after the first differencing I(1). This test was guided by Garr and Coleman (2013) and
Kelilume (2014).
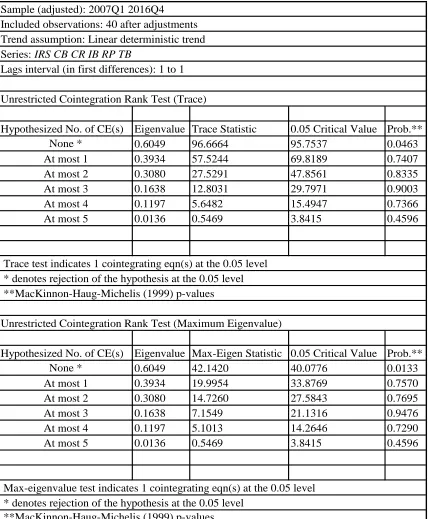
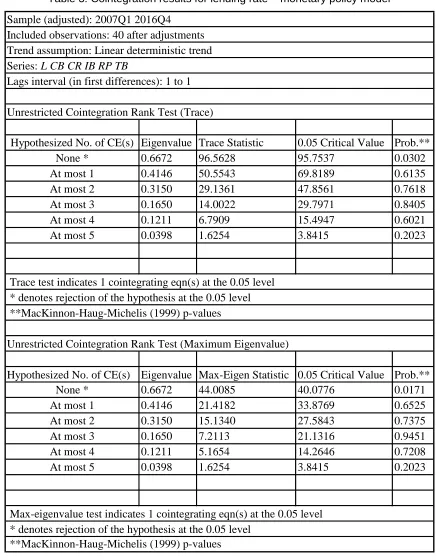
A cointegration analysis was also carried out using Johansen cointegration test. Trace
and Eigen values were used to determine the number of cointegrating vectors. If the test found
that there was at least one cointegrating vector equation among the variables and rejected the
null hypothesis, then the study proceeded to estimate the ARDL model. Estimation of the ARDL
model was done using the Eviews software.
After estimating the ARDL model, tests for multicollinearity, heteskedasticity, serial
correlation, model specification and model significance and reliability were carried out. A test for
multicollinearity was performed by carrying out a correlation analysis for each pair of
independent variables to yield a correlation matrix. Multicollinearity occurs when one
independent variable can be used to predict another independent variable because of very high
inter-association. A correlation coefficient of 0.8 and above implies severe multicollinearity.
Folawewo and Tennant (2008) guided the use of this test.
A heteroskedasticity test was carried out using the Breusch-Pagan-Godfrey test. The null
hypothesis of no heteroskedasticity was assumed and tested at five percent level of significance
The Breusch-Pagan-Godfrey test concludes that heteroskedasticity exists when the p value is
less than five percent level of significance. The Breusch-Godfrey Serial Correlation LM test was
conducted to test for serial correlation on the residuals. The null hypothesis of no serial
correlation was assumed and tested at five percent level of significance. The Breusch-Godfrey
test concludes that serial correlation exists when the p value is less than five percent level of
significance. These tests were guided by Makambi (2012) and Nampewo (2013).
The Ramsey RESET was conducted to test for model specification. The null hypothesis
of correct model specification was assumed and tested at five percent level of significance.
RESET concludes that a model is correctly specified when the p value is less than 0.05 level of
significance. Nampewo (2013) guided the use of this test. Further, F statistics and R-squared
were used to evaluate the significance and reliability of the model. Significance of individual
coefficients was tested using the t statistics and corresponding p values at five percent level of
significance.
The second objective established the difference in the elasticity of lending rate and